BITCOIN - Price can exit from wedge and rose to $102K pointsHi guys, this is my overview for BTCUSDT, feel free to check it and write your feedback in comments👊
Some days ago, the price declined to $81600 level, after which it bounced and rose to $88500 points and then started to fall.
Also price entered to wedge pattern, where it fell to support line, breaking support level, but soon turned around and bounced up.
Price broke $81600 level again and continued to grow next, but later it corrected to support line.
Then, BTC rose from this line to $93000 level, broke it, and reached resistance line of wedge, after which corrected.
After correction, BTC fell to $93000 level and then rose back to resistance line of wedge, where it trades close.
In my mind, price can correct to support line and then bounce up to $102000 points, exiting from a wedge.
If this post is useful to you, you can support me with like/boost and advice in comments❤️
Crypto

COIN BASE BREAKOUT + FLAG SETUPCoin has nice flag pattern with this BTC strength and MSTR strenght. Thinking this can get picked up.
We are flagging for the last 5 days with a bigger break starting from March also setting up. Thinking target to the 200sma and risk down to the 9ema

HolderStat | What Tokens does a Successful Trader BuyThe trader owns ~$48.9K 💵
23 hours ago, he exchanged $10K USDC for ~$69K MEXC:DSYNCUSDT , increasing his position to ~138K tokens.
Top Holdings:
● $30K USDC as a reserve for purchases.
● ~138K MEXC:DSYNCUSDT with an average price of $0.14
Smart rotation at this stage of growth! 🔥

HolderStat | Insane Profits in 9 Deals🚀 Wallet turned $5.9K into 25.78 ETH CRYPTOCAP:ETH (~$47.4k) with just 9 trades, netting a massive 2567% profit in 58 months! With avg buy at $705 & avg sell at $4,647, it’s proof that smart timing and patience pay off big in crypto! 🔥

XRP 5X Lev. Full PREMIUM Trade-Numbers (PP: 1380%)Good afternoon my fellow Cryptocurrency trader, this is a great weekend and a wonderful day.
The bullish bias for XRP has been confirmed more than enough. It is time. The time is right and the time is ripe to go LONG.
I am publishing to give you full trade-numbers for you to enjoy.
This is a high probability chart setup.
I am wishing you success and great profits. Crypto is going up.
We are doing mid-leverage on this pair. We are going with 5X because the action is already moving. Earlier, we would go higher, but we like to keep risk moderate.
Full trade-numbers below:
_____
LONG XRPUSDT
Leverage: 5X
Current price: $2.15
Entry levels:
1) $2.18
2) $2.12
3) $2.05
4) $1.98
Targets:
1) $2.50
2) $3.02
3) $4.51
4) $6.29
5) $8.08
Stop-loss:
Close weekly below $1.95
Potential profits: 1380%
Capital allocation: 5%
_____
I am wishing you great profits and tons of success.
This is for advanced traders.
You decide how to secure profits, how to adapt to market conditions and how to trade.
You also decide your own level of risk. If you win, all the profits are yours.
If you lose, that's ok, the market offers endless opportunities and life goes on.
It is not about winning them all. It is about winning and growing.
Thanks a lot for your continued support.
Namaste.

Cardano 5X Lev. Full PREMIUM Trade-Numbers (PP: 2110%)I want to share a trade setup that looks really good. It has relatively low risk with a very high potential for reward. The low risk is not based on the amount of leverage but the chart itself.
Notice the low 3-Feb., there is a higher low 7-Apr.
If you can open a position that is safe above the 3-Feb. low, then this would a low risk position and can work for the long-term.
The falling wedge pattern and the two green candles are also great. The previous session and the current active session.
Since we already looked at Cardano in detail, let's focus on the full trade-numbers for this chart setup. Most of the targets should hit within months.
_____
LONG ADAUSDT
Lev: 5X
Current price: $0.6637
Entry levels:
1) $0.6800
2) $0.6300
3) $0.6000
4) $0.5710
Targets:
1) $0.7000
2) $0.8213
3) $1.0130
5) $1.1508
9) $1.8300
12) $2.6500
13) $3.4620
Stop-loss:
Close weekly below $0.5600
Potential profits: 2110%
Capital allocation: 5%
_____
This chart setup can also be approached with 3X since it is already moving.
The amount of leverage you use will depend on your own risk tolerance.
Leveraged trading is high risk. High potential for rewards but also very high risk. This is a game not for kids. This is for adults. Mistakes can result in a major loss. Good decisions can result in big gains.
If you enjoy the content, consider hitting follow and leaving a comment.
Boost also to show your support.
Thank you for reading.
You are appreciated.
Your support is appreciated.
I am here working for you for the long-term.
Namaste.

AI16Z Forming Cup and Handle Pattern🚨 $AI16Z Forming Cup and Handle Pattern 🚨
$AI16Z is forming a cup and handle pattern and is currently waiting for a breakout above the red resistance zone. If the breakout is confirmed, the target will be the green line level.
📈 Technical Overview:
Pattern: Cup and Handle
Resistance Zone: Red area currently being tested.
🎯 Breakout Target: Green line level upon confirmation.

IMXUSDT Forming Inverse Head and Shoulder
IMXUSDT is currently showcasing one of the most reliable bullish reversal patterns on the charts – the inverse head and shoulders. This formation typically signals a shift from a bearish to a bullish trend, and with the neckline nearing a potential breakout point, this setup is becoming increasingly attractive. The current price action reflects a strong bounce from a key support level, aligning perfectly with the right shoulder of the pattern.
Volume has started to rise significantly during this bounce, which further validates the possibility of a confirmed breakout once the neckline is breached. Such volume activity typically precedes large price movements, especially when it coincides with technical patterns like this. Traders and investors are beginning to recognize this potential and are showing renewed interest in IMX.
With an expected gain of 150% to 160% from current levels, this setup could be one of the most explosive moves in the altcoin space. The pattern targets suggest a move toward previous highs, making IMXUSDT a strong candidate for mid-term bullish trades. The broader market sentiment also supports altcoin rallies, adding fuel to the bullish thesis for this coin.
✅ Show your support by hitting the like button and
✅ Leaving a comment below! (What is You opinion about this Coin)
Your feedback and engagement keep me inspired to share more insightful market analysis with you!

TURBOUSDT Showing Bullish Breakout
TURBOUSDT has successfully bounced from a strong support zone, marked by extended consolidation and accumulation in the highlighted pink range. This critical area acted as a base for bullish interest and now the price is showing a breakout pattern with a surge in both volume and momentum. This is typically a strong sign of renewed bullish sentiment among retail and institutional traders.
As seen in the chart, Turbo is currently trading around 0.0055 and could be setting up for a major move towards the projected price target of approximately 0.013. That’s a potential gain of over 130%, which makes this trade highly attractive for short to mid-term swing traders. The volume confirmation adds further strength to the breakout, suggesting that demand is increasing and sellers are drying up.
Technically, the market structure has shifted with higher highs and higher lows, signaling trend reversal from the downtrend seen earlier in the year. If price holds above the breakout zone, we could witness rapid movement to the upside. Investors are taking interest in this low-cap gem, especially with current sentiment favoring altcoin breakouts.
✅ Show your support by hitting the like button and
✅ Leaving a comment below! (What is You opinion about this Coin)
Your feedback and engagement keep me inspired to share more insightful market analysis with you!

Bitcoin Terminal Price Risk IndicatorToday we’ll explore the Bitcoin Terminal Price Risk Indicator , which builds on the concept of Bitcoin Terminal Price. We’ll follow the same logic as in our previous idea on the Pi Cycle Top Risk Indicator. By the end, we'll have a new tool for analyzing INDEX:BTCUSD market cycles.
First, let’s recap Terminal Price.
Terminal Price = Transferred Price × 21
Transferred Price = Coin Days Destroyed ÷ (supply × time)
It normalizes historical spending behavior to the full 21M BTC supply. This metric has historically been effective at calling Bitcoin cycle tops whenever the price of Bitcoin crosses above it. That being said, it signaled the April 2021 peak, but not the November one.
Let’s now divide the weekly BTC price by Terminal Price. This gives us BTC-to-Terminal Price Ratio. (We use the formula from the Bitcoin Master Cycle indicator by InvestorUnknown for Terminal Price on TradingView.)
When the ratio crosses above 1, BTC price exceeds Terminal Price and signals cycle top. We can notice that each cycle top forms slightly lower ratio peaks.
Now let’s draw two logarithmic curves through the highs and lows of this ratio, and add a midline.
This creates a band within which the BTC-to-Terminal Price ratio tends to oscillate. These bounds can help anticipate major turning points in future market cycles.
Next, we normalize the ratio between these bounds: bottom curve = 0, top curve = 1.
This gives us the Bitcoin Terminal Price Risk Indicator.
Currently, risk sits around 0.46 , bouncing between 0.3 and 0.6 for ~1.5 years. This range suggests a stepwise price increase with consolidation periods in between — and no mania and blow-off top.
Historically:
Risk > 0.9 = potential selling zone
Risk < 0.1 (or < 0.05) = potential buying zone
Note: Risk stays > 0.9 for just 1–2 weeks.
Reality check: the top curve lies above 1 and slopes down only slightly.
This implies that if the ratio approaches the upper boundary, BTC price could meet or exceed Terminal Price this cycle — currently ~$155K and will be rising quickly should BTC move towards it.
However, so far we have very few data points and they don’t fit the curve perfectly. And there’s no guarantee we’ll reach that upper bound.
For a more conservative take, we can replace the log curve with straight lines.
This steeper upper line would signal a top earlier — below Terminal Price.
Using this method, risk is slightly higher now at 0.55. While also not perfect, this linear approximation can serve as a cautious alternative until more data points emerge.
We'll keep tracking these charts.

EURUSD DETAILED ANALYSIS FUNDAMENTALS AND CRYPTOEURUSD is currently trading around 1.13, having completed a successful retest of the previous breakout zone. The pair is now showing signs of bullish momentum, suggesting a potential move toward the 1.17 target.
From a technical perspective, the recent price action indicates a strong support level around 1.13, where buyers have stepped in to halt the previous decline. This support aligns with the 50-day moving average, reinforcing its significance. The bullish engulfing candlestick pattern formed at this level further confirms the likelihood of an upward move.
Fundamentally, the euro has been supported by stronger-than-expected economic data from the Eurozone, including a 0.4% GDP growth in Q1 2025, surpassing forecasts. Additionally, the European Central Bank's recent rate cuts have provided a more accommodative monetary environment, boosting investor confidence. Conversely, the U.S. dollar faces headwinds due to concerns over economic slowdown and potential rate cuts by the Federal Reserve.
In summary, the confluence of technical and fundamental factors suggests that EURUSD is poised for a bullish move toward the 1.17 target. Traders should monitor key resistance levels and economic indicators to confirm the continuation of this upward trend.

XAUUSD DETAILED ANALYSIS TECHNICAL AND FUNDAMENTALS XAUUSD is currently trading around the 3256 level and is clearly respecting a descending channel on the 1-hour timeframe. The price is now pushing higher from the lower boundary of the channel, suggesting short-term bullish momentum. Based on the current technical structure, I am anticipating a clean breakout above the channel resistance, with the next key target at 3300. The marked purple resistance zone around 3310–3320 also acts as a magnet for price once the breakout is confirmed.
On the fundamental side, gold remains supported by ongoing geopolitical uncertainty and speculation around the Fed's next rate decision. With recent U.S. economic data showing mixed signals—strong labor market figures but slowing inflation momentum—the market is pricing in fewer rate hikes, which weakens the USD and favors upside in XAUUSD. Additionally, central bank gold demand remains strong globally, acting as a long-term support for bullion.
Traders are currently reacting to a softening dollar index and treasury yields, which further underpins bullish sentiment in gold. A clear break above the upper boundary of this channel, ideally with strong volume confirmation, could set the stage for a swift move to retest the 3300 psychological level. From a risk-reward perspective, the breakout trade setup here aligns well with institutional strategies that favor trend continuation post-consolidation.
In summary, XAUUSD is trading inside a clean descending channel, with buyers stepping in aggressively near the support zone. A breakout above the structure could trigger a bullish continuation move toward 3300, backed by strong macro tailwinds and technical confirmation. This setup offers an excellent opportunity for swing traders to capitalize on short-term momentum. Are you also tracking gold fundamentals this week?

XRP is Back!Hello TradingView Family / Fellow Traders. This is Richard, also known as theSignalyst.
📈XRP has been overall bullish from a medium-term perspective trading within the rising channel marked in blue.
Moreover, the green zone is a strong structure!
🏹 Thus, the highlighted blue circle is a strong area to look for buy setups as it is the intersection of structure and lower blue trendline acting as a non-horizontal support.
📚 As per my trading style:
As #XRP approaches the blue circle zone, I will be looking for bullish reversal setups (like a double bottom pattern, trendline break , and so on...)
📚 Always follow your trading plan regarding entry, risk management, and trade management.
Good luck!
All Strategies Are Good; If Managed Properly!
~Rich

Ethereum H4 | Falling toward a multi-swing-low supportEthereum (ETH/USD) is falling towards a multi-swing-low support and could potentially bounce off this level to climb higher.
Buy entry is at 1,732.25 which is a multi-swing-low support that aligns close to the 23.6% Fibonacci retracement.
Stop loss is at 1,650.00 which is a level that lies underneath a pullback support and the 38.2% Fibonacci retracement.
Take profit is at 1,938.37 which is an overlap resistance that aligns with the 78.6% Fibonacci retracement.
High Risk Investment Warning
Trading Forex/CFDs on margin carries a high level of risk and may not be suitable for all investors. Leverage can work against you.
Stratos Markets Limited (tradu.com):
CFDs are complex instruments and come with a high risk of losing money rapidly due to leverage. 63% of retail investor accounts lose money when trading CFDs with this provider. You should consider whether you understand how CFDs work and whether you can afford to take the high risk of losing your money.
Stratos Europe Ltd (tradu.com):
CFDs are complex instruments and come with a high risk of losing money rapidly due to leverage. 63% of retail investor accounts lose money when trading CFDs with this provider. You should consider whether you understand how CFDs work and whether you can afford to take the high risk of losing your money.
Stratos Global LLC (tradu.com):
Losses can exceed deposits.
Please be advised that the information presented on TradingView is provided to Tradu (‘Company’, ‘we’) by a third-party provider (‘TFA Global Pte Ltd’). Please be reminded that you are solely responsible for the trading decisions on your account. There is a very high degree of risk involved in trading. Any information and/or content is intended entirely for research, educational and informational purposes only and does not constitute investment or consultation advice or investment strategy. The information is not tailored to the investment needs of any specific person and therefore does not involve a consideration of any of the investment objectives, financial situation or needs of any viewer that may receive it. Kindly also note that past performance is not a reliable indicator of future results. Actual results may differ materially from those anticipated in forward-looking or past performance statements. We assume no liability as to the accuracy or completeness of any of the information and/or content provided herein and the Company cannot be held responsible for any omission, mistake nor for any loss or damage including without limitation to any loss of profit which may arise from reliance on any information supplied by TFA Global Pte Ltd.
The speaker(s) is neither an employee, agent nor representative of Tradu and is therefore acting independently. The opinions given are their own, constitute general market commentary, and do not constitute the opinion or advice of Tradu or any form of personal or investment advice. Tradu neither endorses nor guarantees offerings of third-party speakers, nor is Tradu responsible for the content, veracity or opinions of third-party speakers, presenters or participants.

What Happened To OFFICIAL TRUMP? No More Bullish Action? Read...Did you give up already?
If you did you are not playing the game right. Patience is key.
The initial bullish breakout is in so the next bullish wave is confirmed; but, the initial bullish breakout is corrected and ends in a higher low. This retrace can last a few days just as it can last a few weeks, it is random the market chooses how big is this wait.
If the whales learn that participants are anxious and desperate, the retrace and higher low will take longer so that people will fold and they can buy more at the lows.
If the bots track your trading and see that you are likely to fold if the next rise is delayed by 3-5 more days, then the bots will not start buying until people sell at low prices. The moment you sell the next rise starts to develop almost instantly. Patience is key is what I say.
How long it takes it doesn't matter that's not how it works. The way it works is that you buy with a long-term mindset, "I will wait for as long as it is necessary for my money to grow." Once in, you hold. That's it, nothing more can be done.
Prediction: Just watch! TRUMPUSDT will grow from a higher low. The last low was the bottom and the current retrace, literally five days, is nothing more than bullish consolidation. After some time, a small wait, we will have a higher high. That is how it works. The market never moves straight down but neither straight up. It fluctuates... Doing zig-zags... And that's what you see on the chart.
Be patient, Trump will grow.
Just set it and forget it, comeback when prices are up.
Namaste.

Vana Will Grow Because I Say So... (Vana Or Banana?)It is a young chart, but the chart is so simple and easy that it cannot be ignored.
When we a look at a chart what are we looking for? Mainly bullish potential. A chart that looks ready to grow. A chart that says the bearish wave is over and a new bullish wave will start.
For this reason, VANAUSDT is easy.
There are no strong bullish signals. Basically there are no signals at all, but, we have price action.
VANAUSDT was in a descending trend and then goes sideways. So now we have information. We know the bearish action is over because we no longer have lower lows and lower highs. We know consolidation is happening because prices are sideways. We know soon there will be change because volume continues to drop. So, if the downtrend is over and the market enters a sideways range, we can assume that a bullish trend/wave/phase will develop next.
We can only make this assumption because we have an understanding of market cycles and keep an eye on the rest of the market. If we were unfamiliar with Cryptocurrencies are were looking at this chart in isolation we would not be able to make this assumption in a valid way. We would be able to make it but it would be a wild guess rather than an educated guess.
We know the market will grow.
We know Bitcoin is growing and we know some Altcoins are growing even three digits green in a single day. This never happens in a bear market and this happens only at the start of a new bullish phase.
We also know that the Altcoins that are breaking bullish and moving up strongly went through exactly the same pattern as VANAUSDT. They were going down and stopped going down and went sideways, from sideways turned green.
That's how I know that VANA will grow.
Thanks a lot for your continued support.
Namaste.

Vulcan Forged Late 2025 1340% & 2188% Potential Profits TargetsVulcan Forged is now on a broken downtrend. The highest volume ever comes after the All-Time Low. The session that produced this really high volume ended up red but the fact that the price is much higher (last week) compared to the ATL (7-April) means that PYRUSDT is now bullish.
Good evening my fellow Cryptocurrency trader, you will be surprised by the performance of this pair.
There are many pairs, many projects, many Altcoins; it is hard to choose, sometimes.
If we develop a plan and invest some time choosing becomes easy.
Choosing doesn't have a be mathematical left brain type of thing. It can be something more creative where you interact with the information that I share, you interact with the market and other traders; let what comes up come up and give it a deep look. Repeat over and over and you will be able to choose with a high level of certainty what is right for you.
There is a trick here. If you don't know what to choose, first, that's ok and it means you are not ready. Wait longer; read, read, read, read everything I share.
Keep reading and then it happens. You get the feeling and the feeling comes with a certainty, "I want to buy this pair." And that's one. Keep doing it until you reach 5 or 10, depending on your capital and plan of course. That's a start.
The trick is that there is no rush, you can take your time and it will work.
Nobody can pick for you, this would be a mistake. I can choose pairs for you, some people ask me which pairs they should buy, and somehow this never works, why? Because you are the one who is going to collect the profits or accept the loss, for this, you are the one that should invest the energy on what to buy and hold.
When you read the analysis, when you see the numbers, some will standout. Those that standout you mark with a check. When you are ready, you start choosing from your very own list of pairs.
You can wait and after sometime you will see many pairs going up. Say you didn't buy but you can easily recognize the ones that called your attention. Next time, when you get that feeling, that intuition, you know it is the right one.
You can also track those that didn't move or went the other way; what type of feelings did you have when you saw those pairs? When you get that feeling again, you know to stay away. It is a mental game.
If you can gain control of your mind, you can make the right decision. If you can make the right decision at the right time, money flows.
The money you make will depend 100% on your mindset, your efforts and the market as a whole.
Support the market, participate and eventually the market will reward with your desired results.
» Vulcan Forged (PYR) is bullish now. Still trading at bottom prices with huge potential for growth. Very strong targets can be seen on the chart.
Namaste.

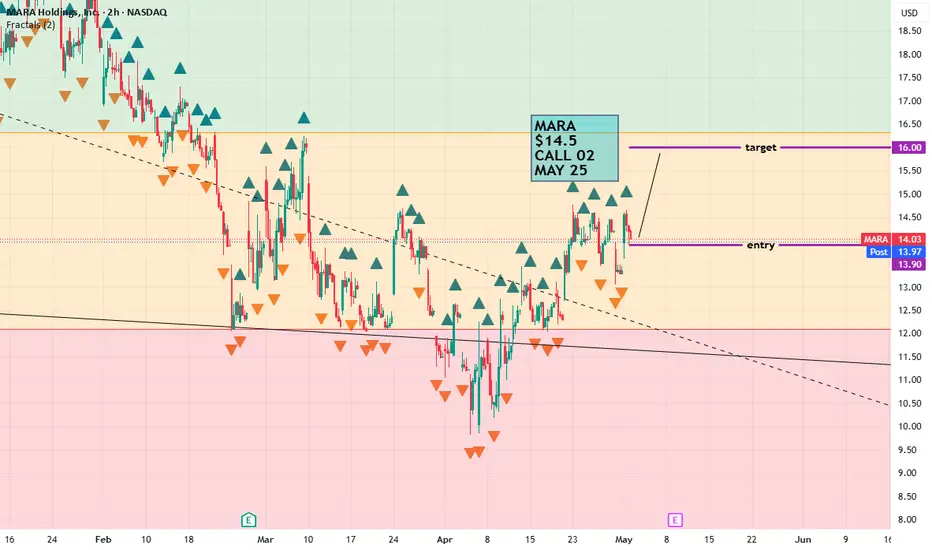
$MARA $14.5 call *This is not financial advice, so trade at your own risks*
*My team digs deep and finds stocks that are expected to perform well based off multiple confluences*
*Experienced traders understand the uphill battle in timing the market, so instead my team focuses mainly on risk management
!! This chart analysis is for reference purposes only !!
If you want to see more, please like and follow us SimplyShowMeTheMoney
Crypto Total Market Cap. Simple Signals (New All-Time High Soon)On April 22 TOTAL moved above its 3-Feb. low after trading below this level for some 50 days. Moving above this low is a major bullish development. A very strong yet simple signal.
On April 22 TOTAL moved above and two days later, on the 24, this level was tested as support and holds. The session ended with long lower wick.
The candle 30-April produced a higher low compared to 3-Feb. and this is a major bullish signal. This one here reveals that TOTAL is set to challenge the next major resistance point. This is all happening with a very strong RSI.
The strong RSI is another simple signal and cannot be denied. TOTAL is now moving towards a new All-Time High, and this ATH will happen very soon, likely mid-term (within 3 months).
The next resistance after the advance that will happen in the coming days will happen around 3.25T. This is a mild resistance and should break after some bullish pressure. This will be followed by a challenge of the previous ATH as resistance. It will be pierced right away through a wick and then a new price discovery session will develop.
» The entire Cryptocurrency market is bullish right now and set to grow. The grow is already happening since early April.
Thanks a lot for your continued support.
Namaste.

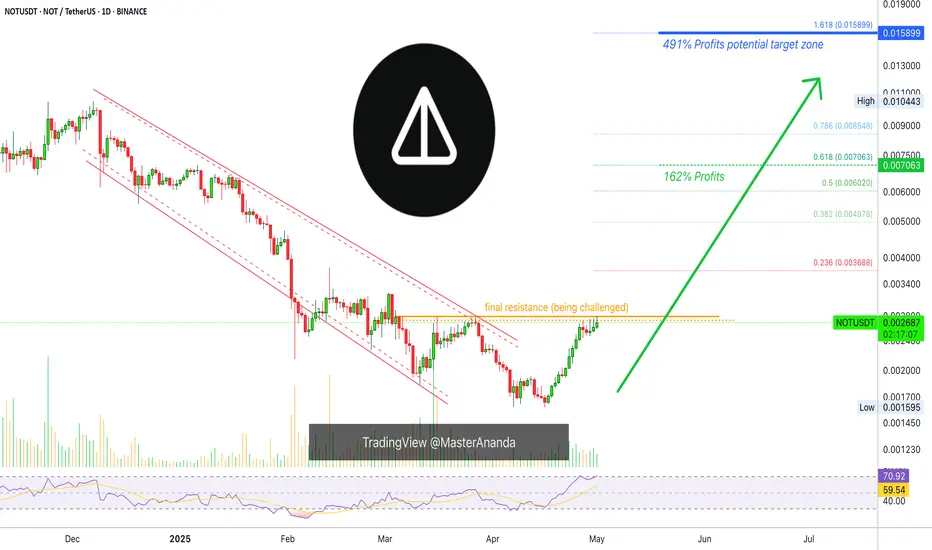
Notcoin Friendly Update: One More Opportunity (PP: 491%)It hasn't move since the last time I wrote about it. Notcoin (NOTUSDT).
It is still at resistance. It is a bit higher but still at resistance.
Let me tell you something; the next move will be huge and there is no downside projected here, it is going up.
The RSI is now above 70. Have you been seeing the charts that I've been publishing lately? (Visit my profile @MasterAnanda) The Altcoins I've been looking at are in similar conditions but the RSI is at 50, 60 most. None are yet at 70. Notcoin is at 71 which is super strong. This means that a major advance will happen next.
Today, NOTUSDT just pierced a little bit higher hitting the highest price since early March. The more a resistance level is challenged, the weaker it becomes.
This resistance is getting weak and we know resistance is weak because Bitcoin is growing, the Altcoins are growing everything is moving up. Some pairs are growing slowly others are breaking up strong.
Let me make a prediction, bullish momentum will only grow from now on. By the time we reach late May, wow!, everything will be awesome. Everything will be green and we are going to be celebrating with the market sentiment reading extreme greed.
Let's trade together long-term.
This is wonderful advice that can change your life for the better.
Read and follow.
Thanks a lot for your continued support.
Namaste.
Neiro: Your Altcoins Choice (S5)I am very curious as to why dogs became so famous within the Cryptocurrency market... It is very interesting. What is the relationship of dogs and this technology? Why dogs and not turtles or dragons? We know the cats went to videos but Crypto gets to enjoy man's best friend.
Neiro is good my dear friend very good just as you. Thanks a lot for your support.
I appreciate the time took out to comment and make this analysis request, I hope you are happy with the results.
NEIROUSDT is good, this is a solid chart.
This analysis is 100% based on the chart, technical analysis—TA.
The RSI looks pretty good on the bullish zone (above 50).
There is a bottom pattern in the form of a rounded bottom coming after a major downtrend. The action recovered above the 11-March low and the ensuing retrace was minimum which is a signal of strength.
The chart candles, the volume and indicators are telling me that an advance will happen next. The main move will be an up-move. Higher prices for sure. You can find targets mapped on the chart, it will be easy, it is high probability and it will be great.
Strategy? Buy and hold. But make sure to sell when prices are up do not become greedy. Enjoy the profits and move on. Opportunities are endless. You are good because you have good timing. Having good timing means that you are balanced in your life because you are looking at the market just at the right time. To be able to be here at the right time means that you are looking to win. Those that are looking to play will join when it is too late.
Timing is very important when trading because it removes all the complexities that come with joining a move when it is already underway. Buy and hold easy. NEIRO is set to grow in the coming weeks and months.
Thank you for reading.
Namaste.

Decentraland: Your Altcoins Choice (S5)I looked at MANA (Decentraland) recently, two weeks back, and the chart is the same but with the bullish reversal now confirmed.
MANAUSDT produced a major low last month and now is full green. This is the fourth week with growing prices and a bullish bias. A clear recovery. This recovery will lead to a major bullish wave.
The recent low activated the lowest prices since February 2021 and this support level back in 2021 launched the fifth wave of the last bull market. In April 2025, this same level marks the start of the current bullish cycle. We are set to experience maximum growth so lets focus on the targets.
» A very easy target can be found at $1.93 with 505% profits potential. This is a strong target with a very high probability to be hit within the next 3-6 months. A strong target sits at $3.75 and gives 1,076% profits potential or more than 11X.
» Short-term, there is a target at $0.6017 for 88% and this is just too easy, it should be ignored. Aim higher.
If this bull market becomes a really strong one, which I believe will be the case, MANAUSDT can move to hit a new All-Time High. An ATH for 2025 can be $6 just as it can be $9.37. The latter gives 2,837% profits potential or almost 30X from current prices.
This is a good project and has done great in the past. Timing is good now if you focus on the long-term.
The low is in. The correction is over. The bottom is in, higher highs and higher lows next.
A bullish cycle.
Thanks a lot for your continued support.
Namaste.

SUSDT Potential UpsidesHey Traders, in today's trading session we are monitoring SUSDT for a buying opportunity around 0.4890 zone, SUSDT is trading in an uptrend and currently is in a correction phase in which it is approaching the trend at 0.4890 support and resistance area.
Trade safe, Joe.
