TradeCityPro | SUIUSDT Is the best time to buy ?👋 Welcome to TradeCityPro Channel!
Let's analyze and review one of the most popular coins in the market, sui, and update our previous analysis and find new triggers
🌐 Bitcoin Overview
Before starting today's altcoin analysis, let's look at Bitcoin on the 1-hour timeframe. Since yesterday, Bitcoin experienced a correction, which was necessary for the market, and it pulled back to the 102135 range. The next trigger for a long position will be a breakout above 104714.
Yesterday's correction, coupled with an increase in Bitcoin dominance, caused noticeable declines in some altcoins. This highlights the importance of monitoring BTC pairs in your checklist these days.
📊 Weekly Timeframe
In the weekly time frame, it is one of the coins that is in good condition, it is really in the market and is still fluctuating on the high support levels.
After hitting 5.24, we made a new ceiling or ATH, and after that, due to recent market news, we experienced some drops, and this has also caused the price correction of this coin.
For re-buying, if we make a good support candle at this level 2.4, it will be a good trigger and the main trend will start again after we break 5.24. Also, after breaking 1.77, we can temporarily exit this coin and cash out!
📈 Daily Timeframe
In the daily time frame, it has been in relatively good conditions compared to other coins in the market and has experienced fewer declines and still has a lot of support to lose!
After breaking the 1.0333 level, which was our trigger spot, we made our purchase and experienced a move after its failure with the entry of momentum and recorded a new ceiling with this event!
Along with this trend, we can draw our Fibonacci levels, which are currently involved in the important level of 0.382, and after it rises and breaks the ceiling of 5.24, we can experience a powerful move!
If this level is broken, we can also hit the support levels of 1.7702 and 1.3859 and we need to form a structure to buy now, but after breaking the trend line and the 3.65 trigger, it can be a good point! For selling, I will continue to hold for now!
📝 Final Thoughts
Stay calm, trade wisely, and let's capture the market's best opportunities!
This analysis reflects our opinions and is not financial advice.
Share your thoughts in the comments, and don’t forget to share this analysis with your friends! ❤️
Cryptocurrency

BITCOIN Can it really take 1 month to form a bottom??Bitcoin (BTCUSD) quickly invalidated the Crypto Reserve rally by Trump and finds itself again on the 1D MA200 (orange trend-line) for the 2nd time in 5 days and 3rd since October 14 2024. The key technically development that we should concentrate at is the failure to break above the 1D MA50 (blue trend-line) during Sunday's rally, as it is the level the price was being rejected throughout the whole February.
Until BTC breaks and closes above the 1D MA50, we can't expect a justifiable recovery. We are also on the 0.382 Fibonacci retracement level from the August 05 2024 Low. The last time the price was trading on those parameters was in late August 2023. More specifically, yesterday's 1D MA50 rejection resembles the August 29 2023 one, which came after a vastly oversold 1D RSI on August 18 2023, similar to the oversold RSI of February 26 (last Wednesday).
During this price action, it took Bitcoin exactly 1 month from the RSI bottom to break again above its 1D MA50, starting a rally that initially broke marginally above the -0.5 Fibonacci extension before a new 1D MA50 pull-back.
As you can see, the similarities between the two main phases of since the 2022 bottom are striking. Both started on a Channel Down and after the first Higher Lows formation, formed the Channel Up that was confirmed upon a 1D Golden Cross. It has to be highlighted that the 1W MA50 (red trend-line) has been holding since March 14 2023, it even supported during the August 2023 bottom formation and provided a massive bounce on the August 05 2024 low. With the 1W MA50 currently at 75070 and rising, it is natural to assume that it is the ultimate Support level.
As a result and based on all the above conditions, it is possible to see Bitcoin consolidate sideways in an attempt to cement the bottom for the majority of March. A break above the 1D MA50 either then or earlier, would be a technical bullish break-out confirmation. The rally that will follow can technically reach $160000, which is just below the -0.5 Fibonacci extension.
So what do you think? Is Bitcoin currently forming its new long-term bottom and if yes, will it reach $160k after that? Feel free to let us know in the comments section below!
-------------------------------------------------------------------------------
** Please LIKE 👍, FOLLOW ✅, SHARE 🙌 and COMMENT ✍ if you enjoy this idea! Also share your ideas and charts in the comments section below! This is best way to keep it relevant, support us, keep the content here free and allow the idea to reach as many people as possible. **
-------------------------------------------------------------------------------
💸💸💸💸💸💸
👇 👇 👇 👇 👇 👇

YGG ANALYSIS🚀#YGG Analysis :
🔮#YGG is consolidating in a parallel channel.... currently falling from its resistance zone. It is trading above its major support zone and there maybe a small retest towards lower supprt level and after that we will see a bullish move📈📈
🔰Current Price: $0.2400
🎯 Target Price: $0.2900
⚡️What to do ?
👀Keep an eye on #YGG price action. We can trade according to the chart and make some profits⚡️⚡️
#YGG #Cryptocurrency #TechnicalAnalysis #DYOR

ADA/USDT at Decision Point – Major Move Incoming!ADA/USDT is testing a major resistance zone after retesting the 100 EMA and bouncing from the rising support line. The price remains in a long-term symmetrical triangle, with the resistance trendline as a key breakout level.
The Stochastic RSI is recovering from oversold levels, indicating potential bullish momentum. A breakout above resistance could trigger a strong uptrend continuation, while rejection may lead to a pullback toward support.

Bitcoin: A US Reserve CurrencyCME: Micro Bitcoin Futures ( CME:MBT1! )
On the morning of March 2nd, President Donald Trump posted a tweet to reinforce his commitment to a Crypto Strategic Reserve, including XRP, SOL and ADA.
Cryptocurrency market took off immediately. Despite not being mentioned in the tweet, Bitcoin shot up from $78,400 to $83,900, and Ethereum from $2,090 to $2,240.
Later in the afternoon, President Trump posted an update and clarified that BTC and ETH will be in the Reserve. “I also love Bitcoin and Ethereum!”, he tweeted.
At the time of this writing, BTC is quoted $94,308, up 20.3% since the first tweet. ETH is trading at $2,520, up 20.6% within the day.
We are in a new age of cryptocurrencies, where BTC, ETH, XRP, SOL and ADA just gained the official backing of the US Government. This day has been in the making for months.
• On May 24, 2024, then presidential candidate Trump promised to launch a national crypto stockpile if he wins the election. Investors warmed to this idea and Bitcoin lifted 18%
• On November 5, 2024, Trump won the US election. Market cheered for the most pro-crypto president and Bitcoin shot up 57% in a month
• On January 23, 2025, President Trump signed the “Executive Order to establish United States leadership on digital financial technology.” Bitcoin went up 17%
• Recent events have brought bitcoin down 28% since reaching its all-time-high of $109,241. In a matter of two tweets, the crypto market has completely turned around
Bitcoin for the Long Haul
A year ago, I published this market commentary, “A Bitcoin Bull Run?”, and laid out the key drivers for bitcoin’s long-term rise.
Limited supply, increased demand and excessive liquidity helped bitcoin prices doubled in a year. In my opinion, these tailwinds remains intact for bitcoin in the coming months. On top of these, we now have the explicit endorsement from a sitting US president. Therefore, I stay bullish for holding bitcoin for the long haul.
Trading with Micro Bitcoin Futures
On “HODL with a Twist”, published on May 6, 2024, I explored using Futures Rollover strategy to invest in CME Micro Bitcoin Futures ( LSE:MBT ). This strategy worked nicely in the past, and I favor to continue deploying it. The paragraphs below provide a brief update with new contract months and new price data.
Firstly, using futures over spot bitcoin provides these compelling advantages:
• Capital efficiency in using margins. A trader could invest with as little as $2,075 to take on the full exposure of $9,431 (1/10th of a bitcoin)
• Futures contracts come with build-in leverage. For MBT, it is approximately 4.5 times (= 9431/2075). If bitcoin moves 10% in your favor, you could gain 45% with futures
• Price protection. MBT has a daily price limit (limit-up and limit-down) at 10%. In a volatile day with big moves, the Exchange will pause trading at the prescribed limits
Secondly, futures contracts have a limited lifespan that will influence the outcome of your trades and exit strategy. Micro Bitcoin futures are traded actively in the nearby March and April contracts. Liquidity in the back-month contracts has yet to pick up.
Rollover is when a trader moves his position from the front month contract to another contract further in the future, prior to the expiration of his existing holding.
Below is an illustration on how to hold a long MBT position overtime:
• In March, a trader buys (going long) April contract (MBTJ5) at $94,308
• In April, the trader enters an offsetting trade, going short on MBTJ5, to close his existing position. He would book a profit or loss, determined by the difference in selling price and purchasing price
• Simultaneously, the trader would buy May MBT contract (MBTK5) and re-establish a long position in Bitcoin
• In May, the trader will close out MBTK5 (going short) and buy June (MBTM5)
• The trader would repeat the above steps, so far as he holds a bullish view
Finally, Bitcoin prices are extremely volatile. Holding spot Bitcoin with no leverage could face potential drawdown of 70%-80%. With the leverage in futures, a sharp price move in the wrong direction could quickly deplete the available fund and trigger margin calls.
Trader could set up a stop-loss in the buy order, limiting the maximum loss. Hypothetically, he could set the stop-loss at $85,000 when executing long futures at $94,308. If bitcoin moves sharply down, the maximum loss will be $931 (= (94308-85000)*0.1). His margin account will be decreased to $1,144 from $2,075.
To learn more about all the Micro futures and options contracts traded on CME Group platform, you can check out the following site:
www.cmegroup.com
Happy Trading.
Disclaimers
*Trade ideas cited above are for illustration only, as an integral part of a case study to demonstrate the fundamental concepts in risk management under the market scenarios being discussed. They shall not be construed as investment recommendations or advice. Nor are they used to promote any specific products, or services.
CME Real-time Market Data help identify trading set-ups and express my market views. If you have futures in your trading portfolio, you can check out on CME Group data plans available that suit your trading needs www.tradingview.com

Verbal intervention was great but what's on the back?Morning folks,
So, the pullback that we were waiting for is done. Although we thought that it will be driven by some natural forces and reasons. The way how it has happened and by what factors make us to be caution on its perspectives.
Indeed, it was just verbal intervention from D. Trump. It had bad week - scandal in White House with Zelensky, stocks are falling, crypto are falling, inflation expectations are raising, March debt ceil and shutdown is almost here, EU "allies" do not want to work together... So, to say couple of words and pump the market is not a bad idea at all.
But, what is on the back? Nothing. Special Committee will make Reserve report only by July. I'm sure on crypto Summit this week we also will hear a lot of bravery speeches, but this is just words.
This is a reason why we do not want to buy BTC now and prefer to watch for reversal signs around our resistance 96-97K area. Sooner or later but fundamentals should return control over the market.
I do not have yet the specific picture but, since we have strong upside momentum - it should fade and appearing, say H&S or butterfly pattern, together with completion upside XOP target seems as great combination. Once this patterns will be formed, we could try to use it for short entry.

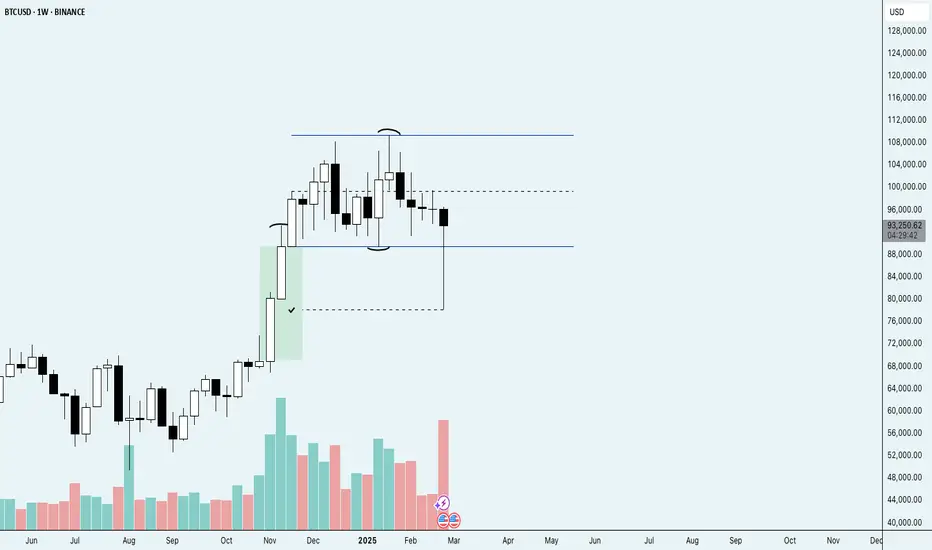
Bitcoin Pressing the RangeThis is a wild candle, not often do we see this much pressure.
If this weekly closes back inside the range, it's pretty clear imo that the trend will simply continue. BTC has cleared the imbalance and already wicked back upside of the range low, wild stuff.
Not bulltarding, just simple TA.
From $110K to $66K? The Political Game Behind BitcoinBitcoin's surge from $73,000 to $110,000 was purely driven by political factors and Trump's statements. However, after Trump took office, the market was waiting for a stimulus to continue its bullish rally. With Trump's silence and the start of a trade war, sellers took control, leading to a 30% correction from the all-time high.
🚨 Key question: What happens next? 🚨
📉 If Bitcoin doesn’t receive further political support from Trump, we could see a drop below $73,000, possibly even $66,000!
Is this a buying opportunity or a warning sign? Let me know your thoughts! 👇💬🚀

TradeCityPro | Deep Search: In-Depth Of Solana👋 Welcome to TradeCity Pro! In this analysis, I will thoroughly review the SOL project, one of the largest crypto projects with a market cap of $73 billion, ranking it 6th among cryptocurrencies.
🔍What is Solana?
🔹Solana is a high-performance, permissionless blockchain platform launched in 2020 by Solana Labs (founded in 2018 by Anatoly Yakovenko and Raj Gokal).
Solana is a high-performance Layer-1 blockchain designed for speed, scalability, and low costs. Launched in 2020 by Solana Labs, it processes up to 65,000 transactions per second (TPS) with sub-second finality and low fees (~$0.0002 per transaction). Unlike Ethereum, which relies on Layer-2 solutions, Solana achieves scalability on Layer-1 using novel technologies like Proof of History (PoH). It is optimized for DeFi, NFTs, gaming, and payments, positioning itself as a fast, cost-efficient alternative to Ethereum.
—
🔹History & Background
olana’s development began in 2018, when Anatoly Yakovenko (a former Qualcomm engineer) published a whitepaper introducing Proof of History (PoH) as a new approach to timekeeping in distributed systems. The project attracted venture funding; in 2019 Solana raised $20 million in a Series A led by Multicoin Capital.
After several testnet iterations (nicknamed Tour de Sol, etc.), Solana’s mainnet beta officially went live in March 2020. The Solana Foundation, a Swiss non-profit, was also established in 2019 to steward ecosystem development.
Solana nodes take full advantage of multicore CPUs, GPUs, and high-bandwidth networks, processing transactions in parallel and pipeline fashion. The network’s 400–600 millisecond block times and capacity for multithreaded execution are a stark contrast to the single-threaded EVM model
—
🔹How Does Solana Work?
Solana’s speed and efficiency come from eight core innovations:
1) Proof of History (PoH): A cryptographic clock that timestamps transactions before consensus, reducing latency.
2) Tower BFT Consensus: A Proof-of-Stake (PoS) mechanism that leverages PoH to speed up block finalization.
3) Turbine: A block propagation system that breaks data into smaller packets for faster distribution.
4) Gulf Stream: A mempool-less forwarding system that pre-assigns transactions to upcoming validators.
5) Sealevel: A parallel smart contract execution engine, unlike Ethereum’s single-threaded execution.
6) Pipelining & Cloudbreak: A transaction processing unit and scalable storage for high throughput.
7) Archivers: A distributed storage system for historical blockchain data.
Together, these technologies enable high throughput and low fees while maintaining decentralization.
—
🔹 Solana’s Consensus Mechanism
Solana combines Proof-of-History (PoH) and Proof-of-Stake (PoS), with Tower BFT handling validator voting.
- PoH timestamps transactions, eliminating the need for validators to agree on time.
-PoS selects validators based on staked SOL, securing the network.
-Tower BFT speeds up consensus by locking validator votes, reducing fork probabilities.
-Finality is achieved within seconds, making Solana one of the fastest blockchains.
—
🔹SOL Tokenomics & Vesting
Initial supply: 500M SOL at launch (2020).
Distribution: 39% community, 25% private investors, 13% team and 10% foundation.
Inflationary model: Started at 8% annual inflation, decreasing 15% yearly until reaching 1.5% final inflation.
Token burn: 50% of transaction fees are burned, reducing supply growth.
Vesting: Early investor and team tokens had a 4-year vesting period, most fully unlocked by 2023.
—
🔹Some of wallets Supporting Solana
- Phantom
-Solflare
-Trust Wallet
- Atomic Wallet
- Exodus:
-Ledger Nano S/X
-Backpack
-Glow, Torus
—
🔹Platforms for Staking SOL
BlazeStake
marinade.finance
Jito
Lido
—
🔹Liquidity Pool Platforms
Raydium
Orca
Jupiter
Meteora
Saber
Pancakeswap
Lifinity
Saros Finance
Drift Protocol
Aldrin
Crema Finance
🔹Solana’s 2025 Roadmap and DeFi Opportunities
A key focus in 2025 is Firedancer: a new Solana validator client being developed by Jump Crypto. Firedancer aims to drastically boost Solana’s throughput and stability – it has demonstrated a theoretical capacity of over 1 million transactions per second in tests. As of early 2025, the Solana team is actively testing Frankendancer (an early Firedancer version) on testnets, pushing for a supermajority of validators to trial it. This upgrade, once fully deployed, is expected to give Solana a significant edge in scalability and help avoid the network congestion issues seen in the past.
New Token Standard (Token-22): Solana’s roadmap also introduces Token-22, an enhanced token standard designed for more functionality in payments and digital assets. Token-22 will support built-in features like automatic royalties and richer ownership controls, which is especially useful for NFTs and gaming assets on Solana. This upgrade will enable developers to create more versatile dApps – for example, NFTs with enforced royalty payments or tokens with conditional transfer rules – improving the user experience within Solana’s ecosystem
Scaling Techniques (Sharding and Parallelization): Even though Solana already handles about 50k TPS, the core team is exploring sharding and other parallelization techniques to stay ahead of future demand
Security and Stability Enhancements: After a few high-profile outages in earlier years, Solana’s developers have made network robustness a top priority. The 2025 plan includes more rigorous third-party audits and battle-testing of the network under heavy load. y diversifying its validator client software (e.g. introducing Firedancer) and adding safeguards, Solana aims to prevent single points of failure. New cryptographic techniques and quality-of-service improvements are being rolled out to harden the network against both bugs and malicious attacks
—
🔹Popular Projects on Solana
DeFi: At its peak, SEED_TVCODER77_ETHBTCDATA:10B + TVL, now recovering post-FTX collapse.
NFTs: Second-largest NFT ecosystem after Ethereum, driven by low fees.
Gaming: Web3 gaming hub with Star Atlas, Genopets, and move-to-earn projects.
DePIN (Decentralized Physical Infrastructure): Helium’s migration brought millions of new transactions to Solana.
—
🔹CertiK Skynet Score: 91.67
🔹Fundraising: $359.55 M
🔹Some of Solana Investors:
Polychain Capital
CMS Holding
a16z
Distributed Global Crypto Fund
RockawayX
Multicoin Capital
—
🔹Seed and Private Sales:
Before its public launch, Solana raised capital through several funding rounds. In 2018, a seed round sold SOL tokens at about $0.04 per token, raising approximately $3.17 million.
This was followed by private investment rounds in 2019 where tokens were priced higher roughly $0.20 to $0.25 per SOL, bringing in additional funding (over $12 million in the first private round and $5–6 million in a second round)
Solana’s public token sale occurred in March 2020 on the CoinList platform, just prior to the network’s launch. 8 million SOL (about 1.6% of the initial 500M supply) were sold in this auction-style sale at a price of $0.22 per SOL.
🔹Solana's TVL and revenue:
First, let's examine its Total Value Locked (TVL). Overall, since early November 2023, we have witnessed an upward trend with strong momentum, reflecting growing attention and trust in this ecosystem. Specifically, the amount of locked Solana has increased from 9 million SOL on November 11 to nearly 50 million SOL (March 2, 2025). However, despite the rise in TVL, the network's revenue has been on a downward trend since January 2025, dropping from 70.5 thousand SOL to 2 thousand SOL, a decrease of approximately 97.16%.
🔹Solana On-Chain Analytics Overview
Whale Activity & Large Transactions:The number of whale addresses (holding ≥10,000 SOL) peaked in January 2025 but has since slightly declined, suggesting that some large holders may have reduced their positions. On February 24, a significant whale transaction involving 846,613 SOL ($127M) sparked speculation of a potential sell-off. Meanwhile, other whales appear to be accumulating SOL, with Binance withdrawals totaling 95,600 SOL on February 28, a portion of which was moved to staking, indicating confidence in the network's long-term value.
Active and New Addresswork Expansion:Despite robust growth in total addresses, daily active usage on Solana has recently tapered off. By late February 2025, daily active addresses dropped to approximately 3.5 million, marking a three-month low for the network. However, Solana continues to see strong adoption, adding over 5 million new addresses per day, even amidst market volatility. While the total address count grows, the decline in daily active addresses to 3.5 million reflects reduced user engagement. Transaction volume has also fallen to $1.5 billion, a four-month low, and stablecoin transfer volume has plummeted from $394 billion to $7.1 billion, signaling a significant slowdown in network activity.
👀 Now that we've reviewed the project, let's move on to the chart to also technically analyze this coin
🗓 Weekly Time Frame
As you can see in the weekly timeframe, after breaking the $27.55 level, SOL initiated a strong uptrend and managed to reach its previous ATH at $255.98. Currently, a price box has formed ranging from $126.40 to $255.98, where it has been oscillating for about a year.
⭐ The floor of the box aligns with the 0.236 Fibonacci level, creating a PRZ (Potential Reversal Zone). If the box is breached downward, SOL could begin its corrective wave targeting the significant Fibonacci levels of 0.382, 0.5, and 0.618. A pullback to the SMA99 could also be a plausible scenario.
⚡️ A divergence trigger in the RSI has activated with the break below 50, indicating a potential trend change to bearish, increasing the likelihood of breaking below $126.40.
🔼 If the price finds support at $126.40, there's a high possibility it could retest the upper boundary at $255.98, especially if Bitcoin stabilizes and forms a base.
🗓 Daily Time Frame
In the daily timeframe, we can observe more detailed price movements. After being rejected at the $260.88 area, SOL started its downward trajectory, breaking below $180.63, pulling back to this level, and continuing its decline.
🔍 The critical support now stands at $126.01, where the price has touched and initially reacted to this level. A break below this support could lead to further declines in the chart. Important areas in the daily timeframe are $99.81 and $82.39.
✅ The RSI is near a crucial area, close to entering the Oversell zone. Entry into this zone could heighten the probability of a bearish scenario and the breach of $126.01.
🧩 If the price rebounds from this support, as mentioned in the weekly analysis, we could witness a move up to the box ceiling. However, for now, any buying or long positions should be held off until the price forms a new structure and we can identify clear long and short triggers.
📝 Final Thoughts
This analysis reflects our opinions and is not financial advice.
Share your thoughts in the com
BITCOIN on Daily ChartThis analysis suggests that Bitcoin completed a major cycle in November 2022 and subsequently began an upward trend, characterized by an extended Wave (3) of the Intermediate degree, following Elliott Wave Theory principles. A recent breakdown below the Minor Wave 4 indicates a potential retracement. The analysis identifies a key retracement zone at approximately 61.8% of the previous upward move, potentially representing the Wave ((2)) of the Primary degree. This level is crucial for observing potential support and a trend reversal.
Disclaimer :
Not Financial Advice : This analysis is for informational and educational purposes only. It should not be construed as financial advice or a recommendation to buy or sell any cryptocurrency.
Market Volatility : The cryptocurrency market is highly volatile and subject to rapid and unpredictable price swings.
Risk of Loss : Trading and investing in cryptocurrencies involve substantial risk of loss. You could lose some or all of your invested capital.
Independent Research : You should conduct your own thorough research and consult with a qualified financial advisor before making any investment decisions.

UniversOfSignals | TAO, an AI-focused cryptocurrency currentlyLet's take a quick look at TAO, an AI-focused cryptocurrency currently with a market cap of $138 million, ranked 36th in the coin market cap.
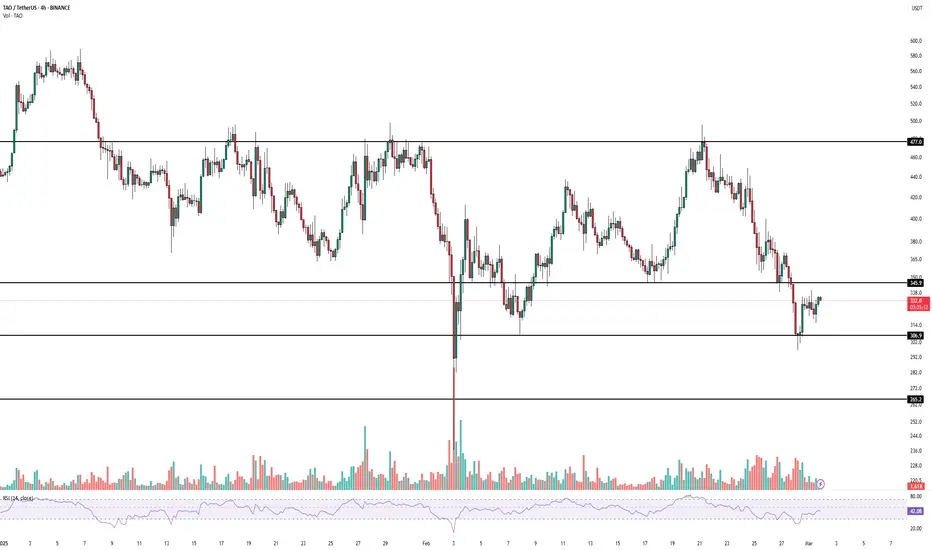
🥸 In the 4-hour timeframe, we are observing a descending range pattern with significant resistance at the area around 477. Every time the price attempts to rise, it gets rejected from this level. Recently, the support at 345.9 was broken, and the price has dropped to a lower level, reaching the support at 306.9.
⭐ The RSI oscillator has exited the oversell zone after completing a bearish leg and has returned to the normal range. The market volume appears to be decreasing, which is common on weekends.
🕯 If the support at 306.9 breaks and the RSI enters the oversell zone again, we could witness the next bearish leg down to the support at 265.2. If the price ranges today and tomorrow while the market volume is low and then breaks this support at the start of the new week, this breakdown would be more credible.
📈 As for long positions or buying, we need to wait until this bearish momentum exits the market and the price establishes a new structure. Therefore, I cannot provide a specific trigger for long positions at the moment.
TradeCityPro | MKRUSDT 70% Move?👋 Welcome to TradeCityPro Channel!
Let's analyze and review one of the best coins in the DAo area together and find another entry point together and update our previous triggers
🌐 Overview Bitcoin
Before starting today's altcoin analysis, let's look at Bitcoin on the 1-hour timeframe. Since yesterday, Bitcoin experienced a correction, which was necessary for the market, and it pulled back to the 102135 range. The next trigger for a long position will be a breakout above 104714.
Yesterday's correction, coupled with an increase in Bitcoin dominance, caused noticeable declines in some altcoins. This highlights the importance of monitoring BTC pairs in your checklist these days.
MakerDAO’s sharp increase in fees and growth in Total Value Locked (TVL) has fueled demand. On February 20, $156.77 million of MKR was burned, reducing supply. Growth in active addresses and trading volume has driven the price higher. Strong resistance at $1,800 may limit further growth. MakerDAO’s emergency offering has raised concerns about $3.1 billion USDC exposure.
📊 Weekly Timeframe
In the weekly timeframe, the token has seen a 95% gain on the coin, which is a good sign in these market conditions!
Also, in this timeframe, we are in an opening triangle, which is characterized by high volatility, and we are constantly moving towards the bottom and top of this triangle, regardless of the ceiling and floor or support and resistance, and the exit from this triangle will also be sharp.
In this timeframe, we did not have a trigger in advance to say that we could buy or anything else, and it moved very sharply. If you lose, it is normal and do not blame yourself and your strategy.
After exiting this triangle and breaking 2.182, we can have a good trigger to buy, and for now, if you bought and held during this fluctuation and are in profit above 50%, it is logical to save profit, but if you did FOMO and bought, it is better not to continue trading and be busy watching the tutorial for now.
📝 Final Thoughts
Stay calm, trade wisely, and let's capture the market's best opportunities!
This analysis reflects our opinions and is not financial advice.
Share your thoughts in the comments, and don’t forget to share this analysis with your friends!

Looking for LongETH is looking for a great opportunity for a movement to the upside after forming correction on a weekly timeframe & will breakout soon, expecting target to reach at $10,000


ETH ANALYSIS🚀#ETH Analysis :
🔮As we can see in the chart of #ETH that there is a formation of Descending Channel Pattern in #ETH. As we know crypto market is bearish then we could expect more bearish move in alt coins then after that a bullish move could be expected
🔰Current Price: $2229
⚡️What to do ?
👀Keep an eye on #ETH price action. We can trade according to the chart and make some profits⚡️⚡️
#ETH #Cryptocurrency #TechnicalAnalysis #DYOR

Did Bitcoin Just Trick the Bears? RSI Says Yes!Bitcoin's recent price action suggests a potential bear trap, as the price sharply dipped below a key support zone before rebounding. The sudden breakdown may have triggered panic selling, but the rapid recovery and bullish divergence on RSI indicate that this could have been a false breakdown designed to shake out weak hands before a stronger upward move.
The price is now reclaiming levels above the previous demand zone, signaling a possible reversal. If Bitcoin sustains momentum and reclaims the $90,000 region, it could invalidate the bearish breakdown and push toward new highs.

THE CLV WHALES BREAK..THE CLV WHALES BREAK..
CLV interesting for new voluume
Always manage the risk since it has shown an increased trend of 60% to risky to enter directly with no plan.
There is high chance this coin can break up $0,10 coming time

Phemex Analysis #63: Riding the Storm of BTC’s DropThe crypto market never sleeps, and neither does Bitcoin’s legendary volatility. From euphoric rallies to gut-wrenching drops, Bitcoin continues to test the nerves of traders worldwide. Now, with BTC hovering in the low $80,000s, many are asking: Is this the beginning of a deeper correction, or the perfect setup for the next big opportunity?
Professional traders don’t just watch the market; they capitalize on it. While many fear a price drop, seasoned market participants know that volatility breeds opportunity. Whether Bitcoin tumbles further or stabilizes, there are multiple ways to navigate and profit from its price movements.
1. Short Selling – Profiting from the Fall
Bitcoin is experiencing high trading volume and a low RSI, signaling strong bearish momentum with no immediate signs of reversal. When the market trends downward, skilled traders can capitalize by strategically shorting BTC.
To execute this strategy, traders should initiate short positions to profit from BTC’s continued decline. Proper risk management is essential, with the $87,060 resistance level serving as a key point for setting a stop-loss to minimize potential losses.
For profit-taking, key support levels to watch include $75,000, where Bitcoin historically tends to bounce after a 25% drop, $66,814, a known demand zone where reactions from buyers are likely, and $58,917, a critical level that, if broken, could signal a more extended bear market.
Noted that this strategy is best suited for advanced traders who can time their entries effectively and manage risk appropriately.
2. Grid Trading – Automating Profits in Volatility
Even in a downtrend, Bitcoin rarely moves in a straight line. Price oscillations near major support levels create opportunities for frequent small profits, making it an ideal setup for grid trading bots. By deploying these bots, traders can automate buy and sell orders at predefined price intervals, systematically capturing gains from Bitcoin’s price swings.
The key to success in grid trading is identifying strong support levels where Bitcoin exhibits frequent bounces. Setting up a trading grid near critical levels like $75,000, $66,814, and $58,917 allows the bot to execute buy orders on dips and sell orders on small recoveries, profiting from volatility even during a broader downtrend.
While this strategy is effective in choppy markets, it requires careful adjustments. If Bitcoin breaks below support with high volume, traders must reevaluate grid placement or temporarily pause the strategy to avoid excessive losses.
3. Dollar-Cost Averaging (DCA) – Playing the Long Game
For long-term Bitcoin believers, every dip presents an opportunity. Instead of trying to time the exact bottom, DCA allows traders to accumulate BTC gradually at lower prices, reducing overall entry cost and minimizing exposure to short-term price swings.
Setting up recurring buy orders near or slightly below key support levels ensures steady accumulation. Allocating a fixed percentage of capital to these entries helps maintain discipline and prevents emotional trading.
Over time, as Bitcoin recovers, the lower cost basis translates to greater long-term gains. While this strategy requires patience, it remains one of the most effective ways to build a strong position in Bitcoin without being affected by daily price fluctuations.
Final Thoughts – Turning Fear Into Opportunity
Bitcoin’s latest dip isn’t just a test of nerves—it’s an opportunity for skilled traders to make strategic moves. Whether shorting the downtrend, trading the volatility with automation, or accumulating for the long haul, each strategy offers a unique way to profit from market conditions.
Short selling takes advantage of continued bearish momentum, grid trading systematically generates profits from price fluctuations, and dollar-cost averaging builds a solid long-term position.
By applying disciplined risk management and adapting to market conditions, traders can turn Bitcoin’s volatility into a profitable advantage rather than a source of uncertainty.
Tips:
🔥 Break free from "buy low, sell high"! Our new Pilot Contract empowers you to profit from ANY market direction on DEX coins with up to 3x leverage. Go long, go short, go further!
Check out Phemex - Pilot Contract today!
Disclaimer: This is NOT financial or investment advice. Please conduct your own research (DYOR). Phemex is not responsible, directly or indirectly, for any damage or loss incurred or claimed to be caused by or in association with the use of or reliance on any content, goods, or services mentioned in this article.

Litecoin Could Triple Against Bitcoin (LTC/BTC)As much as crypto annoys me these days, I can't help but still pay attention to this wild market.
There are some red flags - a lot of uncertainty and major paradigm shifts apparently looming on the horizon. Bitcoin has really slowed down, when it comes to price increases and volatility. It's also now associated with political polarization, as it has been predictably co-opted by wealthy interests, aimed at centralizing financial control and surveillance. Nevertheless, cryptocurrencies chug along.
I'll admit, I've always liked Litecoin. Maybe it's because it was the first cryptocurrency I bought where I realized, hey, Bitcoin isn't the best at what it's supposed to do. It was a lot faster and cheaper, and remains a preferred medium of exchange for crypto transfers. This is evidenced by its growing number of active addresses, when compared with Bitcoin's stagnation.
bitinfocharts.com
bitinfocharts.com
Bitcoin's growth has stagnated, when it comes to its use as a transfer of value, whereas Litecoin continues to grow slowly. Litecoin's active addresses are also only about 50% less when compared with Bitcoin, making its "adoption" not all too far behind.
Of course, there are probably many flaws with Litecoin, as there are with cryptocurrencies as a payment method in general, but when you look at the current crypto market cap and how much Litecoin is actually used, it seems to be undervalued when compared to all the other fluff out there.
It just works. Its max supply is also only 4x that of Bitcoin. It's unlikely to ever achieve a market cap similar, but even if it it goes 4x from here in USD terms (taking it just above its past ATH), its market cap would be the same as Dogecoin, around $37B. That's honestly pretty funny to me.
The only thing I like about crypto is that it's marginally better than a lotto ticket. Maybe if things get even more dystopian, owning some crypto isn't a terrible idea. Things are absurd as it is. I don't like it, but that's how things have been going.
For some quick technicals. Litecoin is on its strongest tear against ETH since 2018:
Litecoin also broke down from a major uptrend against the USD a while ago, but if it gets back in (currently above $170ish), it could fuel a pretty explosive rally.
Based on the above LTC/BTC chart, there is room for a pretty large upside correction.
HOWEVER, it's important to keep in mind that markets are fragile overall right now. If Bitcoin makes a sizeable correction, back down to $70-80k or deeper, Litecoin may drop down to some lows not seen in some time. It's also important to remember that serious upside for Litecoin has previously occurred near market tops.
This is not meant as financial advice! This represents my opinion and feelings about the markets, which are always evolving.
-Victor Cobra

TradeCityPro | LTCUSDT Let's go for spot buying?👋 Welcome to TradeCityPro Channel!
Let's go together to analyze and review Litecoin analysis, one of the oldest coins in the market, and let's go to update the triggers of the previous analysis!
🌐 Overview Bitcoin
Before starting today's altcoin analysis, let's look at Bitcoin on the 1-hour timeframe. Since yesterday, Bitcoin experienced a correction, which was necessary for the market, and it pulled back to the 102135 range. The next trigger for a long position will be a breakout above 104714.
Yesterday's correction, coupled with an increase in Bitcoin dominance, caused noticeable declines in some altcoins. This highlights the importance of monitoring BTC pairs in your checklist these days.
📊 Weekly Timeframe
On the weekly time frame, it is one of the coins that is in a good position compared to the coins and has had the least correction in recent declines and is in this position due to the possibility of ETF approval
There is no need to complicate things in this time frame and after the break of 136.45, we will buy and be above 98.44. This trigger is valid and we do not have much of an exit trigger for the conditions of these days on this chart and for now it is better to continue holding
📈 Daily Timeframe
On the daily time frame, we are also in a good position and we had a good return after the recent market decline due to the Bybit hack and Trump's tariffs and this is a good thing!
After breaking the 75.01 level and exiting the daily box and breaking its ceiling, we moved up to the resistance of 136.45 and are now fluctuating between the 98.44 to 136.45 boxes.
We also had a curve line in this time frame that was a good support for this event and every time we hit it, we made a good move upwards, but after its failure, it can be said that the upward trend moved into the range and went to form a new structure.
To buy spot after the 136.45 trigger is broken, we can buy for spot with a stop loss of 98.44 and as long as we are above 114.38, the 136.45 trigger is very important for us and it shows us more the strength of buyers and in case of a 98.44 break, we will go for 89 and 80 and we will have a price correction.
📝 Final Thoughts
Stay calm, trade wisely, and let's capture the market's best opportunities!
This analysis reflects our opinions and is not financial advice.
Share your thoughts in the comments, and don’t forget to share this analysis with your friends!

Long Signal Entry for ACH/USDT
Based on the daily chart for ACHUSDT on Bybit, here's a concise analysis:
MLR vs. SMA: The MLR (blue) is above the SMA (pink), indicating a bullish trend.
MLR vs. BB Center: The MLR is above the BB Center Line (orange), suggesting bullish momentum.
PSAR: The PSAR dots (black) are under the price, confirming a bullish trend.
Price vs. SMA 200: The price is above the 200-period SMA (red), supporting a long-term bullish trend.
Current Strategy: Since all entry conditions for a long position are met (MLR above SMA, MLR above BB Center, PSAR under price, price above SMA 200), you might consider entering a long position. You can enter now or wait for the close of the day, depending on your availability. Waiting for the close of the day would be preferred to confirm the trend.
Stop Loss (SL): Set the stop loss at the current level of the PSAR dots to manage risk.
Monitor My Idea: Keep monitoring my idea for any changes in trend or potential profit-taking opportunities.

HNT/USDT CAN TARGET $5 soon -> Helium TIMES IS BACKHNT/USDT CAN TARGET $5 soon
We will follow this coin.
Our goal is to follow the coins that have the most chance to break.

LTC/USD Secondary trend (part). 09 12 2023Logarithm. Time frame 1 day. Part of the secondary trend. Channel to work, price consolidation in its lower part. A high probability of an upward exit from it. Key levels are shown by arrows. Percentages for clarity and target orientation similarly.
This is how it looks like on a line chart without "market noise". .
Double bottom with a flat top in an accumulation channel. Post-halving time.
A local uptrending channel that has a double bottom with a flat top. This is a strong bullish pattern that says price is (this accumulation zone) at the lows of the trend initiation. The last cycle after the capitulation (end of the participation phase) of all liquid instruments (this is important) began with this structure, which is a display of the actions, first of all, of large market participants that have an impact on pricing (holding). For example, look at the bitcoin 2020 chart and this structure. Similar to what happened on LTC a few months after the halving.
Major trend. Cycles. Super profits.
LTC is a cryptocurrency that has survived many cycles and has not depreciated completely, although it can be seen that the capitalization and leadership positions are not able to compete with the new 2 cycle HYIP giants.
From the position of the cycle before last (distributions, i.e. highs) 2017, this cryptocurrency is on a big super profit. There are very few cryptocurrencies in the crypto market that are in their main trend in an uptrend and are on super profits relative to previous cycles. LTC is one of them. As a rule, the opposite is true. It is clear that the main major holders in most cases for such a long period of existence in the crypto market, LTC has already been repeatedly changed. But with this logic of the price chart, which is displayed on a long history and on a large time frame, should be considered and taken into account in its risk management.
Major trend. Time frame 1 month.
