Bullish Pennant in ARDR: A Pause Before Another RallyAfter an aggressive surge marked by a big green candle, BINANCE:ARDRUSDT is now moving sideways. This sideways action represents a "voting phase" between buyers and sellers — a battle to decide who will take control next.
Looking at the current price structure, this consolidation is setting up a potential continuation move toward the next target zone at 0.15199 – 0.15900.
Technically, the sideways movement is forming a bullish pennant pattern — a classic sign where price briefly pauses after a strong rally, gathering momentum before continuing its upward trend.
One thing to watch: after breaking the previous high (marked by the red arrow), price should not fall back into the pennant structure. A re-entry would weaken the bullish setup.
As long as price holds above the key support at 0.12273, the bullish scenario remains intact.
What's your view on this setup?
Cryptocurrency

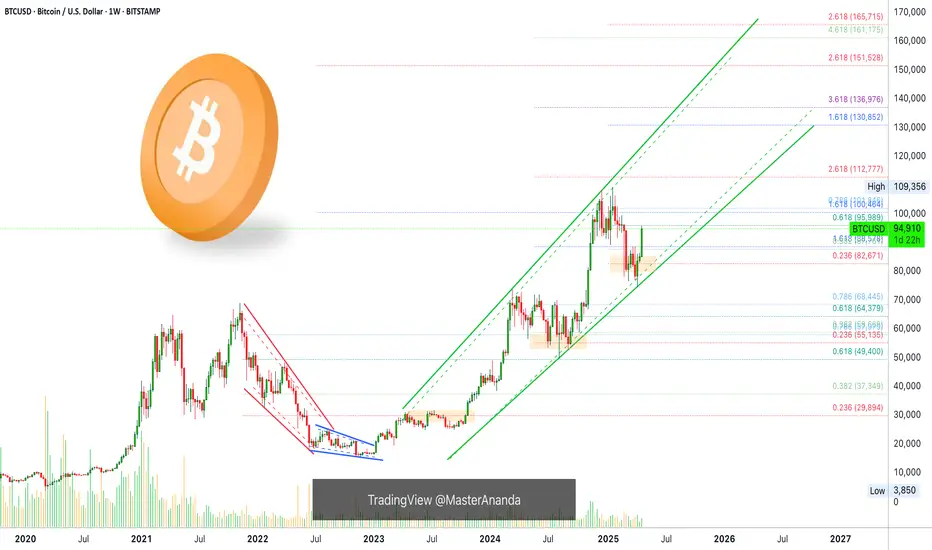
BITCOIN Why is this rally surprising you?Bitcoin (BTCUSD) has completed 3 straight green weeks, with an impressive last 1W candle closing and started the new one right where it left. This rise shouldn't be surprising to most as it has fulfilled all the conditions that initiated all major rallies since the November 2022 Bear market bottom.
The first week of April rebounded strongly on the 1W MA50 (blue trend-line), which as mentioned numerous times on our channel, has been this Bull Cycle's main Support and kickstarted the Q4 2023 and Q4 2024 rallies.
At the same time, the 1W RSI broke last week above its MA, which has been the final confirmation of those Bullish Legs. With the 1W Bollinger Bands (BB) still ranged, the top trend-line is expected to rise aggressively as BTC's uptrend accelerates, something that resembles October 2023 and October 2024.
Throughout this Bull Cycle, those rallies have lasted around the same time, the longest being 14 weeks. As a result, the latest the current Bullish Leg tops should be on the week of July 14 2025 and a +92% rise as February - March 2024 should deliver a test of the Higher Highs trend-line around $140000.
Do you think that's the most probable scenario? Feel free to let us know in the comments section below!
-------------------------------------------------------------------------------
** Please LIKE 👍, FOLLOW ✅, SHARE 🙌 and COMMENT ✍ if you enjoy this idea! Also share your ideas and charts in the comments section below! This is best way to keep it relevant, support us, keep the content here free and allow the idea to reach as many people as possible. **
-------------------------------------------------------------------------------
💸💸💸💸💸💸
👇 👇 👇 👇 👇 👇

BTCUSDTHello Traders! 👋
What are your thoughts on BITCOIN?
Bitcoin has reclaimed the $90K– GETTEX:92K zone after a sharp 32% correction from its all-time high, closing the week strongly above this critical area.
As long as price holds above $90,000, the primary bias remains bullish. The $90K– GETTEX:92K area now acts as a key support zone, ideal for pullback buying opportunities.
A breakout above $101,000 could trigger a strong acceleration toward the next major targets at $115K–$125K.
A weekly close below the green support zone would invalidate the bullish scenario and suggest caution.
What’s your outlook? Will Bitcoin maintain momentum and break $101K? Share your thoughts below!
Don’t forget to like and share your thoughts in the comments! ❤️

28/04/25 Weekly OutlookLast weeks high: $95,778.66
Last weeks low: $84,688.21
Midpoint: $90,233.44
Last week Bitcoin ETFs recorded their second highest net inflows ever, $3.06B between April 21st-25th. The result of this buyside volume is evident on the chart as BTC breaks up into the mid $90k's, and in doing so is now back at the level in which BTC fell from originally to hit $74,500. As a result it is fair to say this area will be a big resistance level, but where is new support after this rally?
The aggressive nature of last weeks move up has left a number of areas of imbalance that the market does tend to revisit. Just below midpoint we have the $89,000-$90,000 area just below a key S/R level at $91,000. Dipping below this area into the FWB:88K 's briefly to sweep the demand and reclaiming $91,000 would be ideal for the bulls and very healthy for the next rally.
A less appealing area of imbalance for the bulls would be towards weekly low of $85,300-$86,300, that would be very painful for anyone longing a retest of the $91,000 area and from a HTF perspective would be a lower high and a SFP of the range midpoint, both bearish signals. The 4H 200 EMA is currently around that area at $87,000 too which would mean losing the level after just climbing back above it.
This week I'm looking at that first imbalance area to be a level of support for the next leg up, that's the ideal bullish scenario in my mind. A move below midpoint with acceptance is a red flag on this move and would start to look like a lower high bearish continuation.
Good luck this week!

BITCOIN's Trump effect: The 2025 PARABOLIC FINALE is coming!Bitcoin (BTCUSD) has completed 3 straight green 1W candles, making an impressive start into Q2 2025. But is it a coincidence or systemic behavior of technical trends?
It certainly is no coincidence the structure that the market has with Trump under President. Q1 has been undoubtedly disastrous due to the Trade War fueled by back and forth tariffs. But this is a pattern we've seen before and more specifically in Trump's 1st Term during Q1 2017.
As you can see, BTC was again under heavy volatility during Trump's 1st Term Q1, even though the correction wasn't as hard initially. What's more interesting however, is that in both Terms, the U.S. Dollar Index (DXY, blue trend-line) topped in Q1 and started collapsing. In 2017 that was the catalyst that fueled BTC's insane Parabolic Rally for the rest of the year.
Can the current Dollar collapse kick-start a rally for the rest of 2025? If the Trade War stabilizes, it certainly looks so. It is no coincidence that in 2017 Trump came out storming that the Dollar was too high just like he states now that the Interest Rates are too high, pressuring the Fed to cut.
So what do you think? Is the rest of 2025 destined to be as strong as 2017? Feel free to let us know in the comments section below!
-------------------------------------------------------------------------------
** Please LIKE 👍, FOLLOW ✅, SHARE 🙌 and COMMENT ✍ if you enjoy this idea! Also share your ideas and charts in the comments section below! This is best way to keep it relevant, support us, keep the content here free and allow the idea to reach as many people as possible. **
-------------------------------------------------------------------------------
💸💸💸💸💸💸
👇 👇 👇 👇 👇 👇

97K and 88KMorning folks,
So picture almost has not changed since our last talk. Now we get great setup on monthly chart with upside potential starting from 110K and up to 127K. And our task now is to join this coming action.
It would be great to get a pullback, but the shape of intraday market has changed slightly and it seems that BTC is forming 3-Drive "Sell" with target around 97K. Hopefully this pattern will trigger the pullback that we need.
If it happens, then the next area that we will be watching is around 88-90K, which is nice support area .
That's being said, our strategy for now is action to ~97-97.3K first and pullback to 88-90K second.
I mark this update as "bullish" due to our first point, but you've got the idea.

BTC ANALYSE The next Fibonacci extension level for BTC on the Monthly timeframe is between
This target could be reached within three Monthly candles, representing an advance of over 27%.

BTC- crash is coming? Most likely no)In its best traditions, bitcoin in one impulse reached the monthly target 95000, which I wrote about
The probability of a correction to set a higher low in the equilibrium area of the range is increasing.
Probably in May the crypto market will have to pass the last stability test, in case of success we will get excellent opportunities for spot and speculative positions before the next cyclical growth spiral.
For now have to wait for weekly open but there are 2 options:
pump till PWH and then move on correction
slow bleeding till 0.5 or mb till 83k in worst case and then pump to ATH

BAT ANALYSIS🚀#BAT Analysis :
🔮As we can see in the chart of #BAT that there is a formation of "Falling Wedge Pattern". In a daily timeframe #BAT broke out the pattern. Expecting a bullish move in few days if #BAT retest the levels
⚡️What to do ?
👀Keep an eye on #BAT price action. We can trade according to the chart and make some profits⚡️⚡️
#BAT #Cryptocurrency #TechnicalAnalysis #DYOR

Ethereum Trade IdeaEthereum has broken out of it's ascending triangle pattern.
A possible retest of the triangle resistance levels which might turn to support.
If the level holds up that will be a begining of a new uptrend for Ethereum.

Internet Computer (ICP)ICP project was announced with great fanfare and promised great features. However, ICP's price was in a long downtrend until recently when price broke the downtrend line and made a higher high and a higher low. It's too soon to surmise the major trend reversal has happened since at least another higher high and higher low is needed. Let's see what happens.

Aptos (APT)Aptos is a new project in crypto market with a lot of attention as well as features to offer. There is not much price candles to tell the big picture pattern; but as can be seen after APT made a harmonic pattern, it went into a corrective phase which seems unfolded in a complex two a-b-c pattern. Please note that this corrective wave might take longer to finish and get more complex. Anyway, we need to see the minor downtrend line break as the first signal for upward continuation. Let's see what happens.

Mask Network (MASK)Mask is moving in a downtrend channel. If price breaks the upper band, theoretically, it can ascend to a level equal to the width of the channel. Although, behavior of price movement may change after the channel breaks; so keep that in mind.

Bitcoin(BTC/USD) Daily Chart Analysis For Week of April 25, 2025Technical Analysis and Outlook:
Bitcoin experienced a significant rally in this week's trading session, breaking through all identified Mean Resistance levels: 86400, 90600, and 94500. This breakout led to the completion of the Interim Coin Rally at 88400. As a result, the newest identified Interim Coin Rally at 95000 has also been completed, indicating a possible pullback to the Mean Support at 92000 and a further decline potential toward an additional Mean Support target at 88500. However, it's important to recognize the chance of upward momentum emerging from a retest of the completed Interim Coin Rally at 95000, which could advance toward the next Interim Coin Rally at 100000.

Crucial Level to Watch on BTC.DWe can see that CRYPTOCAP:BTC.D is still in a bullish trend and is currently testing a crucial level, which will determine whether it continues to make a higher high or starts weakening towards its previous low.
The influence of CRYPTOCAP:BTC.D on the crypto market is simple: if CRYPTOCAP:BTC.D moves higher, it means more money is flowing into Bitcoin. For example, if CRYPTOCAP:BTC.D is at 64%, it means 64% of the total crypto market capitalization is in Bitcoin, and the remaining 36% is spread across altcoins like CRYPTOCAP:ETH , CRYPTOCAP:SOL , CRYPTOCAP:DOGE , CRYPTOCAP:PEPE , etc.
Conversely, if CRYPTOCAP:BTC.D moves lower, it means more money is shifting into altcoins.
Strategy when CRYPTOCAP:BTC.D is rising:
You can allocate more into Bitcoin rather than altcoins. Alternatively, you can find altcoins that are outperforming Bitcoin.
How to find altcoins that outperform Bitcoin?
Look for altcoin/BTC pairs, for example: BINANCE:WIFBTC , BINANCE:NEARBTC , or $BINANCE:TAOBTC.
If the price of BINANCE:WIFBTC is going up, it means SEED_WANDERIN_JIMZIP900:WIF is gaining more value compared to $BTC. If it's going down, it means Bitcoin is performing better than $WIF.
Back to CRYPTOCAP:BTC.D :
Currently, CRYPTOCAP:BTC.D is testing the 64.19% – 64.10% zone.
This area will determine whether CRYPTOCAP:BTC.D continues upward or starts to weaken.
To get early confirmation, you can zoom into the 1-hour chart and look for signs of bullish divergence.
If bullish divergence appears on the 1-hour chart, it often leads to a bounce on the 4-hour chart and a potential continuation of the bullish trend, possibly breaking the previous high.
However, if there's no bullish divergence confirmation, or if there's a strong rejection at the support level, CRYPTOCAP:BTC.D is likely to weaken and move towards its previous low.

Bitcoin & The Cryptocurrency MarketWhat is the energy like? Are the energies rising or falling?
That's the question that you should ask yourself now in relation to Bitcoin and the Cryptocurrency market.
Falling energies lead to falling prices. What was happening just two months ago? The energy was low and the market dropped but, can you feel it? It has been heating up. Something is brewing behind the scenes and excitement is building up... It is coming, like a storm, a quiet storm.
The energies are rising and conditions are so much difference to just two months ago. Three months ago. Conditions are different now, the action on the chart will also be different now because the correction is over and once the correction is over we will always experience growth, no doubt for sure.
Mars will be in full force in May 2025 and Mars is the action planet. When Mars was retrograde the action died down, the action energy felt down and the market moved down. Mars goes full 1000% forward motion new territory high energies; fiery, impulse and barriers and blocks removed as Cryptocurrency grow.
That's the energy. It cannot be avoided it cannot be stoped, when it was going backward all the bullish action disappeared from the market, December 2024. As it goes back in full force the action is heating up and the proof will be seen clearly in the results. Bitcoin is already ultra bullish above $95,000. 80K is no more. No longer possible soon to be a dream long gone.
"Imagine buying Bitcoin when it was trading at 78,800, 80,000 or 90,000," that's exactly what people will be thinking in just a few short weeks when Bitcoin trades at $120,000 and then $150,000 with bullish momentum only growing and prices going higher.
What about the Altcoins?
You cannot have a bear market followed by a bear market supported by a bear market within a bear market. That's not how the market works. The market alternates between bearish and bullish periods between periods of corrections and growth.
Such a long correction we went through that we forget that Cryptocurrency is worth more than Gold. But we will remember soon because there is something cooking behind the scenes and the dish is almost ready to be served.
Your dish will be a desert, what you really deserve; huge profits.
The market will reward you for being a buyer when everybody was selling.
The market...
Thank you for reading.
Namaste.
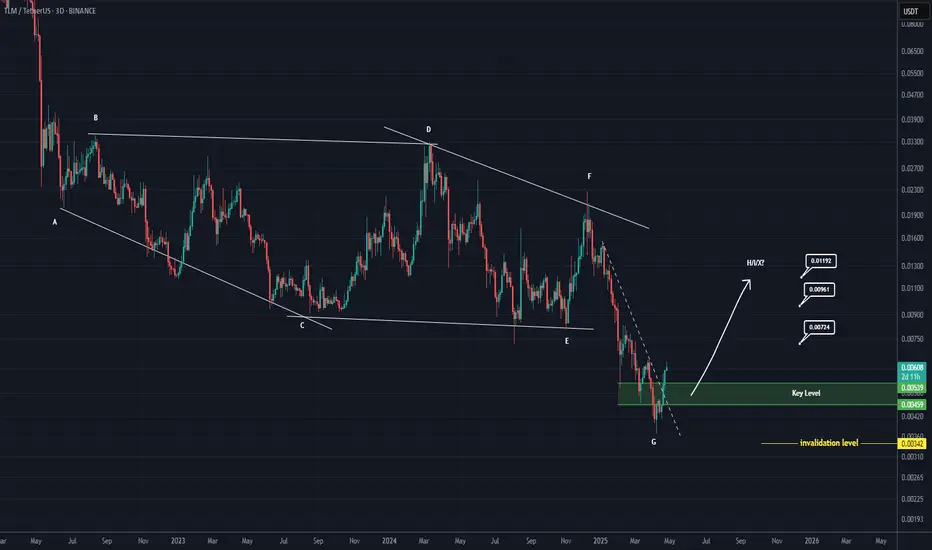
TLM Looks Bullish (3D)It seems that a diametric has completed on the chart, or Wave G of a symmetrical pattern has ended, or the price is attempting to form a bullish X-wave.
There is a key zone on the chart that the price has reclaimed, marked in green.
As long as this zone holds, the price can move toward the targets, which are highlighted on the chart.
A daily candle closing below the invalidation level would invalidate this analysis.
For risk management, please don't forget stop loss and capital management
When we reach the first target, save some profit and then change the stop to entry
Comment if you have any questions
Thank You
BITCOIN $140k will come sooner than you think!Bitcoin (BTCUSD) eventually made the strong rebound we've been talking about on the highly important Support cluster of: a) the 1W MA50 (blue trend-line), b) the former All Time High (ATH) trend-line and c) the Higher Lows Zone of the current Bull Cycle.
This Triple Hold Move is expected to produce the strongest rally of the Bull Cycle, the Parabolic Rally. But even if it is similar to the 'weakest' rally of this Cycle, then we should be expecting at least a +92.94% rise from the bottom, which translates to a price marginally above $140000. And that could come as early as this August.
So do you think we'll be seeing a rally at least as strong as last year's? Feel free to let us know in the comments section below!
-------------------------------------------------------------------------------
** Please LIKE 👍, FOLLOW ✅, SHARE 🙌 and COMMENT ✍ if you enjoy this idea! Also share your ideas and charts in the comments section below! This is best way to keep it relevant, support us, keep the content here free and allow the idea to reach as many people as possible. **
-------------------------------------------------------------------------------
💸💸💸💸💸💸
👇 👇 👇 👇 👇 👇

$BTC - Road to $140K#Bitcoin will hit $140K but needs to firstly close above GETTEX:87K and above $109K with a mandatory retest of $106.5K DYOR.
Perfect retest of previous resistance as support backs my idea for the next bull run, although the aforementioned terms are obligatory.

Ethereum (ETH) XABCD Pattern – $3,000 Target Ahead?ETHUSDT is at $1,759 and we’ve got an XABCD harmonic pattern in play!
▸ From $1,516 (X) to $4,147 (A), then slow retracement to $2,120 (B), then a big spike to $4,120 (C), and crash to $1,385 (D).
▸ Now, the chart is eyeing $3,000 as the next big target!
▸ Watch $2,100 and $2,500 as resistance on the way up. $1,500 is key support – let’s see if it holds!
✉️ What’s your take?
Will ETH hit $3,000, or are we dipping first? Drop your thoughts! ⬇️

Pullback to 87-88KMorning folks,
So, our 2-week journey successfully over, market hits 93K targets and even overcome them a bit, completing H&S AB=CD extension. Now what?
In general we expect very good 1-3 months for BTC based on our recent fundamental report. Speaking about short-term situation. Market is obviously overbought a bit. So we prefer to wait for pullback somewhere to ~87-88K area before considering any new longs.

BlackRock's Bitcoin ETF Can Be Unfolding A Bullish ImpulseBlackRock's Bitcoin ETF with ticker IBIT made a massive rally in 2024, which can be wave 3 of an ongoing five-wave bullish impulse. Despite the recent decline at the beginning of 2025, it's still above 42 invalidation level, and as long as it's above that level, it can be wave 4 correction, so we may still see that 5th wave this year.
The Elliott Wave Principle is a form of technical analysis that identifies patterns in market movements. A bullish impulsive wave is one of the most important and common wave structures in an uptrend. It describes how prices typically move in the direction of the main trend. A bullish impulsive wave consists of five waves labeled 1, 2, 3, 4, 5.

DOGE The 1D MA50 that starts historic rallies happened.Dogecoin (DOGEUSD) broke and closed 2 days ago above its 1D MA50 (blue trend-line) for the first time in 3 months (since January 18 2025) and basically the start of the Trade War fueled correction. This was achieved after the price hit and rebounded on the 2-year Higher Lows Zone.
This is a major bullish development as every time DOGE closed above its 1D MA50 following a Higher Lows Zone test, it started a major Bullish Leg of the current Bull Cycle. At the same time, the 1D RSI signaled a huge Bullish Divergence on that bottom, consistent with all previous bottoms within that 2 year span.
As for how high this new expected rally can get, we expect at least a test of the 1.5 Fibonacci extension, which is still lower that all rallies before it. Conservative long-term Target at $0.9000.
-------------------------------------------------------------------------------
** Please LIKE 👍, FOLLOW ✅, SHARE 🙌 and COMMENT ✍ if you enjoy this idea! Also share your ideas and charts in the comments section below! This is best way to keep it relevant, support us, keep the content here free and allow the idea to reach as many people as possible. **
-------------------------------------------------------------------------------
💸💸💸💸💸💸
👇 👇 👇 👇 👇 👇
