TradeCityPro | MNTUSDT Effects of the Bybit Hack👋 Welcome to TradeCityPro Channel!
Let’s dive into the analysis of the popular DeFi coin that’s active on the Mantle chain—where they’re running multiple airdrops and utilizing it for fees. Let’s break it down and analyze it together!
🌐 Overview Bitcoin
Before starting the analysis, I want to remind you again that we moved the Bitcoin analysis section from the analysis section to a separate analysis at your request, so that we can discuss the status of Bitcoin in more detail every day and analyze its charts and dominances together.
This is the general analysis of Bitcoin dominance, which we promised you in the analysis to analyze separately and analyze it for you in longer time frames.
📊 Weekly Timeframe
After hitting 1.4077, which was our previous ATH, there were practically no buyers present here, preventing us from breaking this key ceiling and moving upward.
Additionally, after the rejection from this high and an engulfing of the previous two candles, it’s safe to say our upward movement has concluded, and we’re now heading into at least a period of correction. This has already started as we’ve entered a resting phase from the prior trend.
However, after breaking 0.9030—coinciding with the news of the Bybit hack and the theft of Ethereum and its coins by North Korean hackers—we experienced a sharp drop. Given that Bybit held a large volume of this token, the decline was even more pronounced.
📉 Daily Time Frame
In the daily timeframe, after the rejection from 1.4077 and a deep drop, we moved upward again. This time, we hit resistance at 1.2353 multiple times, but nothing happened—buyers couldn’t push above this level.
With this lack of buying pressure, sellers stepped into the market. We then formed a support at 1.0102, but after breaking it—along with the hack news—we saw a sharp drop down to 0.06552! This level is highly significant!
It’s important because this was previously a key resistance, and after breaking it earlier, we kicked off our main uptrend. So, it’s a critical support now, and it won’t break easily! However, if this support does fail, we’ll likely see a drop to 0.5340.
For buying, it’s not a good time yet. But if we get support at 0.6552 with a strong daily candle, we could consider a buy. Alternatively, wait for a box formation and structure. Our current entry trigger would be a break above 0.8464. For selling, my stop loss would be below 0.5340.
✍️ Final Thoughts
Stay level-headed, trade with precision, and let’s capitalize on the market’s top opportunities!
This is our analysis, not financial advice always do your own research.
What do you think? Share your ideas below and pass this along to friends! ❤️
Cryptocurrency

BITCOIN Can a USD sell-off save the Cycle?Bitcoin (BTCUSD) is hanging on its 1W MA50 (blue trend-line) amidst the market chaos and especially following last night's stronger 104% trade tariffs to China from the U.S.
This is a simple yet powerful classic chart, displaying Bitcoin against the U.S. Dollar Index (DXY, black trend-line). This shows the long-term negatively correlated pattern they follow on their Cycles.
Every time DXY entered an aggressive sell-off in the final year of the 4-year Cycle, Bitcoin started its final parabolic rally of its Bull Cycle. This time the DXY peaked exactly at the start of the year (2025) and is on a selling sequence up until today but due to the ongoing Trade War, BTC not only didn't rise but is on a correction too.
Can an even stronger DXY sell-off save the day and complete the 4-year Cycle with a final rally? Feel free to let us know in the comments section below!
-------------------------------------------------------------------------------
** Please LIKE 👍, FOLLOW ✅, SHARE 🙌 and COMMENT ✍ if you enjoy this idea! Also share your ideas and charts in the comments section below! This is best way to keep it relevant, support us, keep the content here free and allow the idea to reach as many people as possible. **
-------------------------------------------------------------------------------
💸💸💸💸💸💸
👇 👇 👇 👇 👇 👇

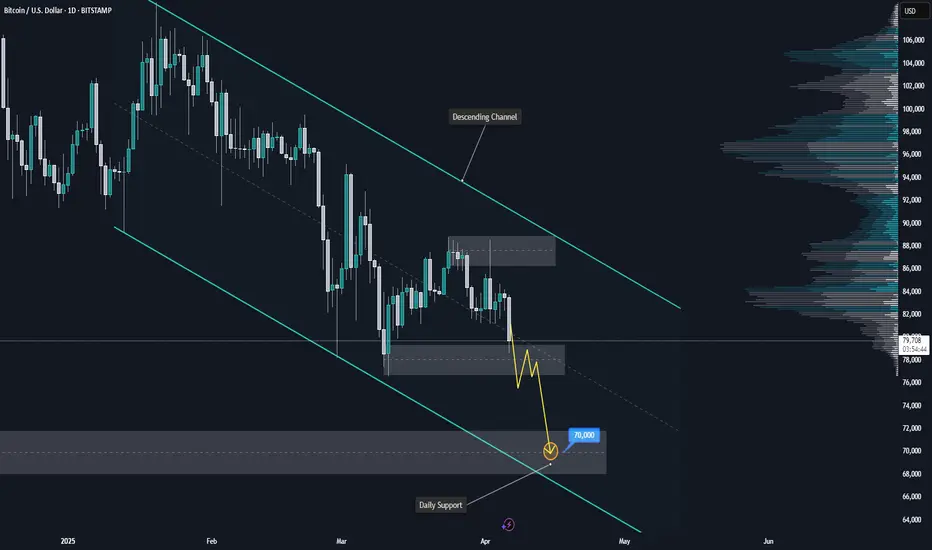
BITCOIN Downtrend Continues – Is $70K the Next Stop?COINBASE:BTCUSD continues to trade within a well-defined descending channel, maintaining a clear bearish market structure on the daily timeframe. After a strong rejection from the upper boundary of the channel, the price has retraced to a minor support zone around $78,000.
Given the prevailing momentum and strength of the broader downtrend, this support is likely to break under continued selling pressure. A clean breakdown below this level would reinforce the bearish bias and open the door for a move toward the daily support zone near $70,000, which aligns with the lower boundary of the channel.
This zone marks a potential area of interest where price may react or attempt a short-term bounce. However, unless there is a significant shift in momentum, the path of least resistance remains to the downside.
Traders should watch for confirmation of the bearish continuation, such as lower highs, weak bullish pullbacks, or increased volume on red candles, before considering short entries.
If you align with this outlook or have additional perspectives, feel free to share your thoughts below.
BTCUSD: Last chance to prove the Bull Cycle is still intact.Bitcoin remains bearish on its 1W technical outlook (RSI = 40.819, MACD = 1234.500, ADX = 47.185) as it is on the 3rd red 1W candle in a row, which just hit the 1W MA50. First contact since Sep 2nd 2024. The weeky low is also almost at the HL bottom of the Bull Cycle's Channel Up. Needless to say, it has to hold in order for the bullish trend to continue. Practically this is the market's last chance to prove that the Bull Cycle is still intact. So far the -32% decline is no different that all prior inside the Channel Up but an Arc shaped bottom needs to start forming. If it does and that's the new bottom, expect $160,000 by September.
## If you like our free content follow our profile to get more daily ideas. ##
## Comments and likes are greatly appreciated. ##

Is there any chance for an ALTSEASON now??Just some chart fun. Do you think the pattern will be completed and the current altcoin Bull Cycle will follow the previous two? Do you think there will be a new Altseason amidst the tariff chaos?
Whatever happens, the 1W MA100 (green trend-line) has to hold (close 1W candles above it) if that would be the case and it just got breached.
-------------------------------------------------------------------------------
** Please LIKE 👍, FOLLOW ✅, SHARE 🙌 and COMMENT ✍ if you enjoy this idea! Also share your ideas and charts in the comments section below! This is best way to keep it relevant, support us, keep the content here free and allow the idea to reach as many people as possible. **
-------------------------------------------------------------------------------
💸💸💸💸💸💸
👇 👇 👇 👇 👇 👇

Ripple May Face Another Rally This YearRipple with ticker XRPUSD hit all-time highs for the final blue wave V as expected, so we should be aware of limited upside this year. However, despite recent slowdown, which we see it as an ABC correction within red subwave (IV), there can still be room for another rally this year, at least up to 4-5 area to complete final subwave (V) of V of an impulse on a daily chart.

ETH ANALYSIS🔮 #ETH Analysis :: Support & Resistance Trading
💲💲 #ETH is trading between support and resistance area. If #ETH sustains above major support area then we will a bullish move and if not then we will see more bearish move in #ETH then could expect a pullback.
💸Current Price -- $1564
⁉️ What to do?
- We have marked crucial levels in the chart . We can trade according to the chart and make some profits. 🚀💸
#ETH #Cryptocurrency #DYOR

FXAN & Heikin Ashi Trade IdeaBINANCE:ETHUSD
In this video, I’ll be sharing my analysis of ETHUSD, using FXAN's proprietary algo indicators with my unique Heikin Ashi strategy. I’ll walk you through the reasoning behind my trade setup and highlight key areas where I’m anticipating potential opportunities.
I’m always happy to receive any feedback.
Like, share and comment! ❤️
Thank you for watching my videos! 🙏

BITCOIN Is it still on track with past Cycles??Bitcoin (BTCUSD) saw a strong correction last week as well as early trade yesterday on Monday, along with all major stock markets, but had an equally impressive round on Wall Street opening, which keeps it so far above its key 1W MA50 on a potentially weekly closing.
So the critical question now is this: Will it continue the pattern of past Cycles and give one more major rally in 2025?
Well based on the BTC Rainbow Waves, it is still on track and actually in a similar situation as July 2013 when after a 3-month correction/ pull-back sequence, it got back to the Blue Buy Zone and near the Fair Value green trend-line.
As you can see all Cycles peaked on the Red Zone and so far on this Cycle we haven't even reached the 1st orange trend-line. Based on the Time Cycles, the next peak should be around November 2025 and if the price action confirms the Rainbow Wave model again, the closest level to the Red Zone by then would be around $180000.
Do you think that amidst the trade war chaos, that's a realistic expectation? Feel free to let us know in the comments section below!
P.S. I am attaching a snapshot below in case the waves aren't displayed properly on the chart above:
-------------------------------------------------------------------------------
** Please LIKE 👍, FOLLOW ✅, SHARE 🙌 and COMMENT ✍ if you enjoy this idea! Also share your ideas and charts in the comments section below! This is best way to keep it relevant, support us, keep the content here free and allow the idea to reach as many people as possible. **
-------------------------------------------------------------------------------
💸💸💸💸💸💸
👇 👇 👇 👇 👇 👇

Phemex Analysis #71: Pro Tips for Trading Ripple (XRP)Ripple ( PHEMEX:XRPUSDT.P )has seen significant developments with the launch of its US dollar-backed stable coin, RLUSD (launched in December 2024), integrated into its Ripple Payments platform to improve cross-border enterprise transactions. The stable coin, regulated by the NYDFS, has experienced substantial growth, approaching a $250 million market cap and nearly $10 billion in trading volume, exceeding Ripple's projections. RLUSD is increasingly used as collateral in both crypto and traditional finance markets, and NGOs are exploring its use for donations.
Despite the positive developments surrounding RLUSD, XRP's price has failed to hold above the $1.76 support level. XRP recently dropped to a low of $1.61 due to US tariff news that pushed the broader market downwards.
Today, we will explore several possible scenarios for XRP's price action in the coming days to identify potential profit opportunities in this uncertain market.
Possible Scenarios.
1. Bearish Breakdown Below Support:
If XRP breaks decisively below the $1.61 support level with significant volume, it could signal a continuation of the bearish trend.
Pro Tips:
Consider shorting XRP on a confirmed break below $1.61.
Potential support levels to target: $1.43, $1.28, or even $1.05.
Place a stop-loss order above a recent swing high (e.g., $1.65) to manage risk.
2. Rebound from Support:
The $1.61 level represents a recent low, and a price bounce is possible, especially if broader market sentiment improves. Besides, support levels like $1.43, $1.28, and $1.05 are targets to watch for too.
Pro Tips:
Watch for bullish reversal patterns around the support level (e.g., increased buying volume, RSI divergence, bullish candlestick patterns).
Consider entering a long position on confirmation of a rebound.
Potential resistance levels to target: $2.0, $2.17, and $2.45.
Place a stop-loss order below the targeted support level to protect against further downside.
3. Consolidation within a Range:
XRP might consolidate between the $1.61 support and the $2.0 resistance if market uncertainty persists.
Pro Tips:
Consider range-bound trading strategies: buying near $1.61 and selling near $2.0.
Utilize grid trading bots within this range.
Set stop-loss orders outside the range (below $1.60 and above $2.0) to prepare for a potential breakout or breakdown.
Conclusion.
XRP's price action is currently influenced by both the positive developments surrounding RLUSD and the broader market uncertainty. Traders should remain vigilant and adapt their strategies based on the prevailing market conditions. By carefully monitoring key support and resistance levels, analyzing trading volume and technical indicators, and implementing appropriate risk management measures, traders can position themselves to capitalize on potential opportunities in the XRP market. Whether the price breaks down, rebounds, or consolidates, a disciplined and informed approach is crucial for successful trading.
Tips:
🔥 Break free from "buy low, sell high"! Our new Pilot Contract empowers you to profit from ANY market direction on DEX coins with up to 3x leverage. Go long, go short, go further!
Check out Phemex - Pilot Contract today!
Disclaimer: This is NOT financial or investment advice. Please conduct your own research (DYOR). Phemex is not responsible, directly or indirectly, for any damage or loss incurred or claimed to be caused by or in association with the use of or reliance on any content, goods, or services mentioned in this article.

BTCUSD: Can this M2 supply signal trigger a massive rally?Bitcoin has neutralized the previously oversold levels on its 1D technical outlook (RSI = 35.383, MACD = -1887.100, ADX = 31.814) as it is making a strong technical rebound on the 1W MA50. Today's analysis features the Global M2 supply, which is a leading indicator for Bitcoin. Both in July 2024 and November 2022 (the last two major bottoms for the market) when the M2 started to rise aggressively, Bitcoin declined and consolidated. It followed the bullish trend of the M2 with a rise of its own much later. This is similar to what the market has been experiencing since January 2025, when the M2 started rising but Bitcoin peaked on its ATH and started a decline that continues to this very date. If the pattern gets repeated then by end of April - start of May we are in for a strong Bitcoin recovery (if not earlier).
## If you like our free content follow our profile to get more daily ideas. ##
## Comments and likes are greatly appreciated. ##

Pullback to 80KMorning folks,
So, our long-term bearish journey that we were following for 4-5 weeks comes to an end. BTC more or less hit our 74K target and strong weekly support area .
The next one stands around 69K, but market strongly needs a new driving factor to break ~70K support area, and hardly this will happen this week.
Taking in consideration that market is oversold, now we set a tactical target- pullback to 80K resistance area , and then we will see, should be sell again or not.

Will BITCOIN prove to be resilient amidst this market crash??Bitcoin (BTCUSD) just hit its 1W MA50 (red trend-line) for the first time since September 06 2024, while completing the first 1D Death Cross since August 09 2024. This is a critical double combo development as last time those conditions emerged it was a bullish signal.
Despite the theoretically bearish nature of the Death Cross, the last one on 1D was formed just four days after the market's previous major long-term bottom of August 05 2024. That bottom was exactly on the level that the market hit today, the 1W MA50.
The 1W RSI sequences among the 2 fractals are identical and if it wasn't for the abysmal negative market fundamentals regarding the back-and-forth tariffs, that would be an automatic long-term buy entry, the 3rd on of this Bull Cycle.
The only condition we can technically rely on right now, amidst the stock market crash, is for the weekly candle to close above the 1W MA50, as it did on August 05 2024. In that case and of course if and only if the trade war gets under control (and/ or the Fed makes an urgent rate cut), we can expect a new long-term Bullish Leg to begin towards $150k and above.
Failure to address those concerns and a 1W candle close below the 1W MA50, can result into a stronger sell-off towards $50000 and the next long-term technical Support level of the August 05 2024 Low (49150). That would also be a major Support cluster as the 1W MA200 (gray trend-line) is just below that level (and holding since October 16 2023) and by the time of the drop, the market may test that as well.
So what do you think? Will BTC turn out to be resilient amidst this market crash or will it follow suit and decline towards $50k? Feel free to let us know in the comments section below!
-------------------------------------------------------------------------------
** Please LIKE 👍, FOLLOW ✅, SHARE 🙌 and COMMENT ✍ if you enjoy this idea! Also share your ideas and charts in the comments section below! This is best way to keep it relevant, support us, keep the content here free and allow the idea to reach as many people as possible. **
-------------------------------------------------------------------------------
💸💸💸💸💸💸
👇 👇 👇 👇 👇 👇

BTC HTF ThoughtsChart from end of Dec/early Jan. Idea back then was that the top is in, and we'll revisit at least 51.5 levels. IMO low will be between 41.5-32.5, with potential to reach 23s.
However, it won't happen in one day and it's finally at prices i want to scale in and hold for the next weeks/months incase i'm wrong with the macro idea.
I'm a buyer between 74-62, levels in between are 72, 69, 65 and 62.

Bitcoin Analysis - Bear Trap Complete - Bullish Reversal StartedBitcoin recently swept the liquidity resting at the $78K level, taking out the previous lows before initiating a strong reversal with a double break of structure to the upside. This signals that smart money has engineered liquidity to trap retail traders and induce early shorts before driving price in the intended direction.
The move up has left behind a well-defined bullish order block in confluence with a fair value gap, which held firmly on the retracement. This confirms that institutional positioning is present, and the market is now efficiently repricing higher. The fact that price reacted strongly from this zone further reinforces that smart money has absorbed sell-side liquidity, and the path of least resistance is now to the upside.
With liquidity now resting above the descending bearish trendline, price has a clear target. The bearish trendlines, especially in the context of a corrective move, act as a liquidity magnet. Retail traders shorting into this structure are providing the fuel for the next leg up, as their stops accumulate above each lower high. The market makers and algorithmic liquidity providers understand this, and price is now gravitating towards that liquidity pool. The inefficiencies left on the chart from the recent aggressive down move also suggest that these imbalances need to be filled, further strengthening the case for continued bullish expansion.
The entire bearish move preceding this was nothing more than a well-structured inducement. It served to lure in breakout sellers, create the illusion of a sustained downtrend, and trap liquidity at the lows before the true direction was revealed. This is a classic example of manipulation before expansion. This principle repeats across all timeframes and market conditions.
With this in mind, the most probable scenario now is a continuation towards the next major liquidity pool above the bearish trendline, likely leading price into the 92K–98K range where a significant daily order block sits. This area will be critical to observe, as it could act as a distribution zone where smart money starts offloading positions. However, until then, the structure remains decisively bullish, and every retracement into demand zones should be seen as an opportunity to position long, rather than a sign of weakness.

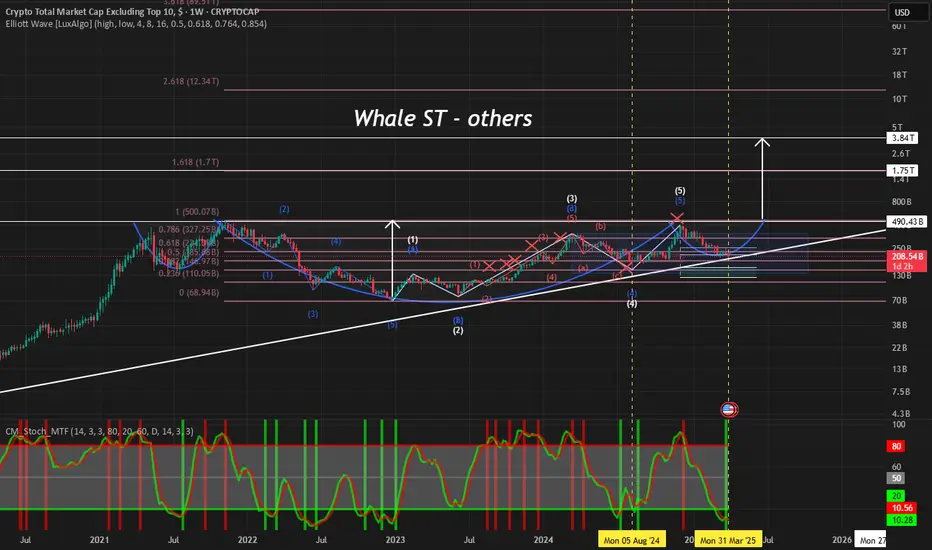
$others @whalest_The Others chart has not yet seen its old peak. I think the big rise will start soon. This chart represents other altcoins except for big projects. There will be exciting times soon.
Cryptocurrency and Stocks will DecoupleI still remember the AI saying that NVDA was going to 320 "in the near future." This was back in June 2024. No matter when you asked the AI, its only prediction would be up, it couldn't make an analysis based on the data coming from the chart. The program wasn't very intelligent, that's what I concluded.
I disagreed. NVDA is going down and this is now fully confirmed.
We are seeing a very long distribution phase and the crash is now taking place.
Ok, but what about Bitcoin?
Bitcoin will decouple from traditional markets, just look at the news.
While Cryptocurrency is due a generational bullish wave, the stock market is due a generational retrace.
I honestly don't know how the stock market will perform but I can look at individual charts. NVDA is bearish and going down strong.
NVDA, TSLA, the SPX, the NDX and Crypto are not the same. These are two completely different monsters.
The SPX and NDX is landline.
Crypto is free wireless internet for all.
The SPX and the NDX is centralization and control.
Bitcoin is decentralization, innovation, technology and freedom.
Times change.
The stock market will recover and it is sure to continue growing long-term.
Will the establishment let it crash or will they jump in and pump it up?
I don't know. But NVDA is bearish and going down. What one does, the rest follows.
But, what about Bitcoin? Bitcoin is going up.
It is very simple. They will decouple, they will not move together anymore. Many, many Altcoins are trading at bottom prices, many stocks are trading high up.
The giant stocks will crash, while the Cryptocurrency market goes up. This is one more of the reasons why we are about to experience the biggest bull-market in the history of Crypto.
People are evolving, the world is changing. We are changing from centralized monopoly money, to a free decentralized technology that is available for all.
Money is not the paper, the shiny stone or the codes; money is what we decide to use for the purpose of exchanging value.
At one time, salt used to be money as well as cows. Sea shells, glass and cacao are also on the list. People used to use these things as money.
The argument that Bitcoin has no value is obviously flawed. If you want to buy a Bitcoin you have to pay a price, that's value, nothing more.
If we decide to use something as money, it becomes money.
Bitcoin is money for the new generation.
The old generation dies out and a new one takes its place.
Life will continue to evolve and money will do the same.
Now it is Bitcoin, later down the road it will be something else. But Bitcoin has value, it is really expensive and it will continue to grow.
After the crash, NVDA will recover for sure.
Namaste.

LTC ANALYSIS (support & resistance)🔮 #LTC Analysis 🚀🚀
💲💲 #LTC is trading between support and resistance area. There is a potential rejection again from its resistance zone and pullback from its major support area. If #LTC sustains above major support area then we will a bullish move till its major resistance area
💸Current Price -- $82.20
⁉️ What to do?
- We have marked crucial levels in the chart . We can trade according to the chart and make some profits. 🚀💸
#LTC #Cryptocurrency #DYOR

BTCUSD: Conservative September Target $150kBitcoin remains neutral on its 1W technical outlook (RSI = 46.307, MACD = 1999.100, ADX = 44.501), firmly supported on top of the 1W MA50. On this analysis you see the Channel Up that dictated the price action of the last three Cycles. Since December 2023 BTC has traded solely inside the 0.382 - 0.618 Fibonacci Zone, the median zone of the Channel Up. The Theory of pre-Halving / post-Halving symmetry implies that the time range from the Cycle Bottom to the Halving is almost the same as the time from the Halving to the Cycle Top. Since on the current Cycle, the time from the Bottom to the Halving has been 76 weeks, in theory the Top should be another 76 weeks from the Halving. We take the worst case estimate of 74 weeks like the 2017 Top. That's the end of September. And with regards to the target, a conservative estimate is just over the 0.5 Fib at 150k, like the highs of December 2024 and March 2024.
## If you like our free content follow our profile to get more daily ideas. ##
## Comments and likes are greatly appreciated. ##

ATOMUSD: Channel Down bottomed. Strong buy signal.Cosmos turned bullish on its 1D technical outlook (RSI = 60.498, MACD = 0.008, ADX = 27.015), which raised 1W to a neutral state. This is perfectly aligned with the market structure at the moment, which is a technical rebound at the bottom of the 3 year Channel Down. The 1W RSI is on a HL trendline, which is a bullish divergence as far as the Channel's LL are concerned. This means that there is potential to break this Channel to the upside, but until this happens, we will be targeting the 0.786 Fibonacci retracement level (TP = 9.500), like the previous bullish wave did.
## If you like our free content follow our profile to get more daily ideas. ##
## Comments and likes are greatly appreciated. ##

Sui Bear Flag !! Big Cluster liquidity area
Bearish Continuation Trade Idea - Potential Breakdown from Bear Flag
📉 Market Outlook:
The price has been in a strong downtrend, forming a bear flag after an impulsive move downward. This pattern is typically a continuation signal, suggesting further downside if the price breaks below the flag structure.
📍 Key Observations:
1️⃣ Big Cluster Liquidity Area: The highlighted zone marks an area where the price previously accumulated/distributed liquidity before a strong breakout. Now that the price has fallen below this region, it is acting as a major resistance.
2️⃣ Bear Flag Formation: After a steep decline, the price is moving inside a narrow ascending channel, which often acts as a bearish continuation pattern.
3️⃣ Potential Breakdown: A clear break below the lower boundary of the flag could confirm the next leg down.
🔴 Trade Plan (Short Setup):
Entry Trigger: Wait for a confirmed breakdown below the bear flag's lower boundary, ideally with a strong bearish candle close.
Stop Loss: Place above the recent swing high inside the flag to limit risk.
Take Profit Targets:
First target: Recent swing low
Second target: Major support zone with historical liquidity
⚠️ Risk Management:
Position sizing should align with your risk tolerance.
Beware of false breakouts; a confirmed breakdown with strong momentum is preferred.
Monitor macroeconomic events that might cause volatility.
📌 Conclusion:
The overall trend remains bearish, and the formation of a bear flag suggests further downside if confirmed. If the price breaks lower with conviction, sellers may push it toward key support levels.
🔔 Disclaimer: This is NOT financial advice. Always conduct your own analysis and manage risk accordingly.
Would love to hear your thoughts—drop a comment below! 🚀🔥

BITCOIN Bollinger squeeze and 1D Death Cross aiming at $150kBitcoin (BTCUSD) will complete today a 1D Death Cross (1D MA50 crossing below the 1D MA200). A technically bearish pattern in theory but in practice it has been one of the greatest buy signals during the 2023 - 2025 Bull Cycle.
** Bollinger Squeeze, 1D Death Cross, 1W MA50 **
As you can see, since the long-term Channel Up started with the November 21 2022 Bear Cycle bottom, we have had another two 1D Death Crosses. Both took place on the Channel Up bottoms (September 04 2023 and August 05 2024), serving as Higher Lows for the pattern. At the same time, the price had a test (or close) of the 1W MA50 (red trend-line), while the Bollinger Bands (blue cloud) have already started to squeeze.
This squeeze is critical as it was even present during the November 21 2022 Bear market bottom, having started a little earlier on October 31 2022. In fact the squeeze started earlier on all three bottom phases and even on the current price action we are seeing so far a Bollinger Squeeze since March 17 2025, a little after the near test of the 1W MA50.
** The Transition Month **
In typical cyclical manner, each year had one Channel Up bottom. This bottom process (consisting of the Bollinger Squeeze, 1D Death Cross and 1W MA50 test) technically appears once a year. We call this month 'Transition Month', which is the necessary phase that BTC spends to go from the bottom to the new Bullish Leg of the Channel Up. In 2022 that month was December, in 2023 it was September and in 2024 August. Since all bottom conditions have been met this time also, we expect April to be the 2025 Transition Month.
** What's next? **
As far as the next leg up in concerned, all 3 previous Bullish Legs rose by at least +100% from the bottom. Since March 10 was the close test of the 1W MA50, we can consider that the bottom from which to measure the +100% leg up. That suggests that BTC will hit at least $150000 on the next top.
But what do you think? Has this Bollinger Squeeze, 1D Death Cross, 1W MA50 Triple Combo just priced the new bottom? And if yes, will April be the Transition Month for the new Bullish Leg to $150k? Feel free to let us know in the comments section below!
-------------------------------------------------------------------------------
** Please LIKE 👍, FOLLOW ✅, SHARE 🙌 and COMMENT ✍ if you enjoy this idea! Also share your ideas and charts in the comments section below! This is best way to keep it relevant, support us, keep the content here free and allow the idea to reach as many people as possible. **
-------------------------------------------------------------------------------
💸💸💸💸💸💸
👇 👇 👇 👇 👇 👇

ETHEREUM at Major Support: Bullish Rally Incoming?COINBASE:ETHUSD is on the verge of a major move. The price has reached a key support level that has historically triggered strong buying interest. This zone has acted as a demand area multiple times, increasing the likelihood of a bullish reaction if buyers step in once again.
The market structure suggests that a confirmed bounce from this level could ignite a significant recovery. If bulls hold the support, the first upside target is $2,400, which represents a logical target for this setup. However, a sustained breakout beyond $2,400 could mark the beginning of a stronger rally, fueled by renewed buying momentum and increasing volume.
Given the prolonged bearish move leading into this setup, a retracement here could turn into a larger trend shift. However, a clean breakdown below support would invalidate this bullish bias and open the door for further downside.
🚀 If this rally takes off, we could see COINBASE:ETHUSD reclaiming higher levels in the coming weeks. What are your thoughts? Drop them in the comments! 🚀
