BTCUSDT – System-Based Long Signal (3D Timeframe)
📅 April 19, 2025
Yesterday’s 3D candle closed with a clear PSAR flip, shifting from bearish to bullish — an early signal of potential trend reversal.
In addition, price is now trading above the 200 MA, which confirms a return into long-term bullish territory.
🟢 Based on these two system signals, we have a valid long entry setup forming.
However, the system is not fully aligned yet:
⚠️ MLR < BB Center < SMA
This suggests the internal momentum structure is still weak.
We are above 200MA and have a PSAR trigger, but the trend metrics aren't in full confluence.
📌 Strategy suggestion:
- Consider a partial spot entry only
- Avoid leverage until full confirmation
- Wait for MLR to flip above BB Center for added strength
This is a trigger-before-confirmation type of setup — and in such cases, discipline > excitement.
Cryptomarket

APE Analysis | Lost in the Jungle or Making a Comeback? (1D)The larger-degree APE pattern appears to be a large symmetrical triangle, and we are currently in the G wave of this pattern. The G wave is bearish, and within the G wave, we can also observe a smaller-degree symmetrical triangle.
It seems we are nearing the final leg of this pattern, and we expect one more drop from the red box. If the price reaches the green zone, we may have a low-risk opportunity to enter a buy position.
Potential targets are marked on the chart.
A daily candle closing below the invalidation level would invalidate this outlook.
For risk management, please don't forget stop loss and capital management
When we reach the first target, save some profit and then change the stop to entry
Comment if you have any questions
Thank You

SOLUSDT - Trade LogSOLUSDT – Long Setup in Daily FVG
Entry: Buy at 124 USDT (floor of the daily Fair Value Gap)
Stop Loss: 105 USDT (just below the daily FVG low)
Take Profit: 200 USDT (new all‑time highs)
Rationale:
• Price is retracing into the daily FVG, offering a high‑probability support zone
• Daily RSI double divergence & trendline support reinforce the FVG floor
• Spot accumulation targeting euphoria phase—leveraging the FVG for entry
Risk Management: Risk ~5% of account. If SOL closes below 105 USDT (invalidating the FVG), exit and reassess. Keep an eye on BTC direction as the primary driver.

ApeCoin 666% —The Uptrend From Hell (How To Maximize Profits)It has been now five months and a half since this downtrend here on the ApeCoin chart got started. The candles fit perfectly within a descending channel.
The highest bearish volume session happened 24-February. This is followed by the highest volume day ever, then APEUSDT continues lower and producing lower lows with minimum trading volume.
The 7-April low ended closing green and with a reversal candle. It is easy to see that the downtrend has no strength. It is no surprise then to find out that I am calling for a reversal now, a change of trend.
» How does one can maximize profits from a chart set up like this one?
Buy as low as possible and sell as close as possible to the top. Right now we don't know where the top is but we can easily spot the bottom. The bottom the current price and trading zone. At whatever price ApeCoin is trading now will remain the bottom when action turns green. There can be shakeouts and swings and this wouldn't change anything for you and me. A spot trader should only buy and hold. If the market lowers, nobody cares, we wait. If the market moves higher; truly awesome, this is great.
» How to maximize profits?
Buy now and wait.
Namaste.

Pi Network is a stablecoin? “Cryptocurrency is becoming more popular. A legal framework for stablecoins is a good idea.”
Jerome H. Powell
The market, global economy is entering a greatest thunder storm, yet not end.. and it is still going. The financial market, organization, banks, ets.. are now getting fear, panicking on what is happening to the market crash, and new tariff pause.
Yet, there is a crypto..still not yet plumeting crashing and waitting the game changer. Crypto already grow rapidly fast years by years, and proven in the market crash, covid , the crypto still strong.
The price currently trying to breaking trough resistance and still in the bearish for the moment.

Pengu Shortwe are only a few 100'drenths away from zero , so im pretty sure, we going to go all the way down to zero and then maybe bounce back.
but the zero will come before the falling wedge pattern plays out ;) !!
and tariffs- !!

Bullish Rounding Bottom!📈 GHST Update – Bullish Rounding Bottom! 🚀
👀 GHST has formed a bullish rounding bottom. If breakout red resistance zone target green line level.
🔑 We are waiting for a breakout above the red resistance zone to target the green line level.
Keep a close eye on GHST!

Jesus Coin (JESUS) Price Jumps Over 50% in a Week Jesus Coin (JESUS) has experienced notable price action this week, rising by 52.90% in the past seven days. At the time of writing, the token trades at $0.00000006999. Despite a -7.61% drop in the past 24 hours, the coin maintains momentum, supported by increased attention within its community.
The project holds a market capitalization of approximately $7.19 million, positioning it at rank #1101 in the crypto market. Daily trading volume has declined to $110.11K, showing a 61.50% drop, signaling reduced short-term interest despite recent price movements.
Jesus Coin was created as a decentralized, community-led initiative aimed at promoting generosity and faith-based values in crypto. It brands itself as an “anti-meme coin,” built to counter dishonest projects and scams that have plagued the space.
Unlike typical crypto ventures, Jesus Coin launched without a team allocation and functions entirely through community efforts. Its mission focuses on inspiring generosity and cultural transformation through blockchain.
From a technical perspective, Jesus Coin shows signs of renewed bullish activity after a prolonged consolidation phase. The 3-day candlestick chart highlights a recent push attempt. JESUS has also moved above the 50-day moving average (0.00000006201), suggesting short-term bullish momentum. However, it remains below the 200-day moving average, indicating that long-term sentiment has not yet flipped.
The token’s trading range remains tight, with historical support near 0.0000000513 and recent highs around 0.000000071. Trading volume remains modest, implying cautious interest from market participants.
With strong community involvement and recent technical signals, Jesus Coin may continue to draw attention. Watch for sustained volume and price movement above resistance for further confirmation of trend direction.

TradeCityPro | Bitcoin Daily Analysis #65👋 Welcome to TradeCity Pro!
Let’s move on to the analysis of Bitcoin and key crypto indicators. In this analysis, as usual, I want to review the New York futures session triggers for you.
🔄 Yesterday, the market was range-bound again, and none of my triggers were activated. Today, a high has formed that could be suitable for opening an early position.
⏳ 1-Hour Timeframe
In the 1-hour timeframe, as you can see, the price is within a box between 83,233 and 85,550, and market volume has decreased compared to yesterday. I recommend keeping an eye on the market today because the volume is very low, and the likelihood of a sharp move is high.
✔️ Today, we have a new trigger for a long position. In yesterday's analysis, I said that the price is creating a new high that could be used as a trigger if it reacts to this area again. As you can see today, the price reacted to this area and was rejected from it.
💥 So, considering that a sharp move is likely, it wouldn’t be bad to open a long position on the breakout of 85,126 so that if we can’t get a proper confirmation from the candle on the breakout of 85,550, we already have a position open.
⚡️ However, for a short position, the 83,233 trigger is still valid and this area is very important. If the price stabilizes below this support, the next supports the price could reach are the areas of 80,595 and 78,778.
👑 BTC.D Analysis
Let’s move on to Bitcoin dominance. As you can see in the chart, I told you yesterday that if the price is supported from the 63.87 area and breaks the previous high, the next bullish leg could begin. However, although dominance was supported at this area, it failed to break the previous high, formed a lower high, and is now again at the 63.87 support.
🔼 If this support is broken, we can temporarily confirm a bearish move in dominance. The next key supports for Bitcoin dominance are the areas of 63.61 and 63.23.
📈 For Bitcoin dominance to become bullish again, in my opinion, we need to wait for it to break the previous high at 64.12.
📅 Total2 Analysis
Let’s move on to the Total2 analysis. The condition of this index is very similar to Bitcoin, but because Bitcoin dominance is bullish, Total2 is one level lower than Bitcoin. Although Bitcoin is struggling with its main resistance, Total2 has moved away from the 980 area and has formed its box between 954 and 932.
🔽 If the 954 area is broken and Bitcoin dominance is bearish, you can open a long position. But if dominance is bullish, Bitcoin will be a better choice.
🎲 If the 932 bottom is broken, you can confirm a bearish trend in altcoins. In this case, I think dominance will become bullish and altcoins will drop more than Bitcoin.
📅 USDT.D Analysis
Let’s look at Tether dominance. The entire market is waiting to see what Tether dominance does with the 5.39 area. If it is supported at this area and breaks the 5.59 high, we can say that dominance is bullish and the market may drop.
🔍 But if dominance can first break the 5.48 area and then the 5.39 area, the market could start a new bullish move and Bitcoin will definitely break the 85,550 high.
❌ Disclaimer ❌
Trading futures is highly risky and dangerous. If you're not an expert, these triggers may not be suitable for you. You should first learn risk and capital management. You can also use the educational content from this channel.
Finally, these triggers reflect my personal opinions on price action, and the market may move completely against this analysis. So, do your own research before opening any position.

TradeCityPro | AR: Key Triggers in Web3 Storage Coin’s Downtrend👋 Welcome to TradeCity Pro!
In this analysis, I want to review the AR coin for you. This project is one of the Storage and Web3 platforms, and the coin of this project, with a market cap of $352 million, is ranked 124th on CoinMarketCap.
⏳ 4-Hour Time Frame
In the 4-hour time frame, as you can see, this coin is in a downtrend, and in its latest leg, after being rejected from the 7.70 top, it started to drop, and this decline continued down to the 4.78 zone.
✔️ Currently, the price has retraced to the 0.382 Fibonacci level and has created a range box between 4.78 and 5.65. A break of this box can determine the trend of this coin for the coming days or even weeks.
✨ The SMA99 indicator has so far acted well as a dynamic resistance, and within the current box, the price has already reacted to it once and is now again pulling back to this moving average.
💥 If the price is rejected from this indicator and forms a lower high than 5.65, the probability of breaking the 4.78 bottom increases significantly, and the price could move toward lower lows.
⚡️ The 4.78 support is actually a support range between 4.78 and 4.92, and to confirm a bearish move, the risky trigger is 4.92, and the main trigger is 4.78.
🔼 For a long position or spot buy, we should first wait for the SMA99 to break and for the 5.65 zone to activate. The break of this zone would be the first confirmation of a trend reversal, and the main confirmation would come after the price makes a higher low and higher high above the 5.65 zone.
🎲 The main resistance levels above this area are the 0.5, 0.618, and 0.786 Fibonacci levels. Another key resistance is the 7.70 zone.
📝 Final Thoughts
This analysis reflects our opinions and is not financial advice.
Share your thoughts in the comments, and don’t forget to share this analysis with your friends! ❤️

BITCOIN WEEKLY ANALYSIS - April 18th, 2025BTC/USD is currently hovering just below a major descending trendline and key horizontal resistance near the 91,500 level. 🧱
🔍 What We’re Watching:
- Price has tested the downtrend line multiple times — the structure is weakening.
- A breakout above 87,500 could trigger a strong bullish move.
- Until then, "Wait for the Breakout" remains the strategy. No confirmed long entries yet.
📉 Current Price: $84,500
📈 Breakout Confirmation: Clean close above resistance zone + volume spike = 🔥🔥 potential rally.
🧠 Pro Tip: False breakouts are common. Watch for confirmation — not just a wick!
Stay sharp, stay patient. Breakouts give the best reward-risk trades! 💹

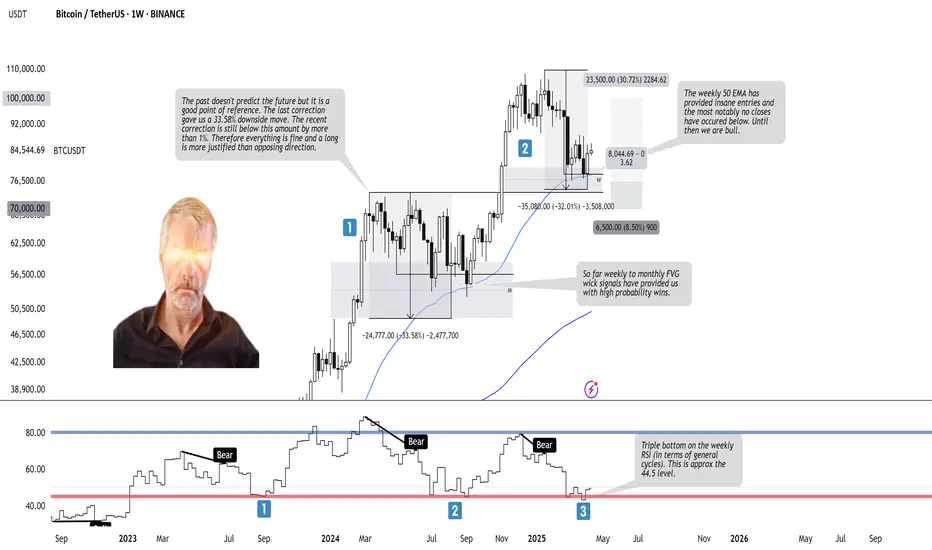
BTCUSDT - Trade Log BTCUSDT – Weekly Bullish Outlook
Weekly Context: Price has held the weekly Fair Value Gap and bounced off the 50 EMA, with clean wick rejections signaling strong buyer demand. The recent pullback (~32% from ATH) remains within historical correction bounds, and the tiny current retrace (<1%) suggests low downside risk. A triple bottom on the weekly RSI cycle around 40 further supports a bullish reversal.
Trade Plan (Long):
– Entry: Add longs near the weekly FVG / 50 EMA (around 75–87k).
– Stop: Place just below the FVG low (≈70k), risking ~5% of account.
– Target: First at 100k (psychological level), then previous ATH region for a 1:3+ RRR.
Bullish Catalysts:
• Weekly 50 EMA has only closed below twice—support intact.
• Weekly FVG wick signals have historically delivered high-probability bounces.
• Triple bottom on weekly RSI signals major capitulation is complete.
• Macro backdrop (equities & gold) remains positive for BTC.
Stay alert for any decisive weekly close below the EMA—until then, the bulls remain in control. 🚀
2018 Cycle Repeat? Bullish Bitcoin Until End of YearSee my DXY analysis for my full view on the performance on bitcoin (and other risk assets as well)
-Summary- bullish like 2018 until end of year.
-This chart pointing out time frames of past cycles, the over all market structure of bitcoins price, and the transformation of a bullish trend into the parabolic. (where I think we are now)

FET Correction Bottom Confirmed —Buy OpportunityThe next All-Time High for FETUSDT in late 2025 or early 2026 can reach between $5.42 or $8.56, giving us more than 1,600% profits potential from the current price. This is taking $8.56 as the next All-Time High. Let's get that part out of the way because I want to show you the end of the current correction. I am using the linear scale so it won't let me show you higher targets on the chart.
There was a resistance level in April 2022 as the bear market developed. This resistance was confirmed again in February 2023. It took 270 days, or 9 months, before this resistance level was conquered (broken). As soon as it broke, it was tested as support (Feb. 2024) and then a major rise. This major rise completed a long-term bullish cycle and after a bullish cycle a correction always develops.
How far down can the correction reach?
How low can prices go?
The correction started in March 2024 and is active until this present day. Obviously, the strongest resistance price range in the history of FETUSDT will need to be tested again but as support.
Now, FETUSDT bottomed last week and this bottom happened at the same level where the April 2022 and February 2023 resistance was found. As the action approached this level, volume started to go up. The next week, this week, we have a bullish candle and this is very likely the end of the correction; the bottom is in.
I just wanted to let you know that this level will hold because it was a strong resistance in the past. A resistance level once conquered turns into support.
As prices are now, it is the best possible time to enter; buy, go LONG.
This is a friendly reminder. I am wishing you tons of success and huge profits in this bull market that is just about to develop. It will be a bull market that will change the world. The world is already changing, but this bull market will close the deal. By the time it is over, Cryptocurrency will have taken over the world.
New money. The rich nouveau.
Namaste.

IQ Token Surges Over 48% as Volume Soars Amid Market OptimismThe IQ token saw a sharp 48.51% price increase in the last 24 hours, pushing its value to $0.005791. The market cap now stands at $123.02 million, reflecting renewed investor interest. Trading volume also surged by 1,409.49% within the same period, reaching $229 million. This rapid uptick in activity suggests a strong return of liquidity and momentum in the market.
IQ powers the Agent Tokenization Platform (ATP), an ecosystem designed for developers building autonomous and self-governing AI agents. These agents can hold and control digital or physical assets, including cryptocurrencies, DeFi protocols, and even robotics systems. ATP positions IQ as the core utility token that governs these decentralized agents and facilitates interactions across platforms.
The recent market movement appears tied to growing awareness of the platform’s utility and potential, especially in sectors combining AI and blockchain. As demand for verifiably autonomous systems rises, IQ's underlying use case could be gaining traction among forward-looking investors and developers.
Technical Analysis
On the IQ/USDT daily chart, the token recently bounced from long-standing horizontal support around $0.0038 after marking a low of $0.0032. A key resistance lies near $0.0058, the current market level, which has been previously tested multiple times. The price now hovers around the zone, where a breakout, retest and confirmation as support could lead to further upward continuation.
For now, IQ shows signs of strength, but sustained momentum will depend on market conditions and follow-through buying pressure. If bullish momentum gets rejected at the current level, a potential drop to around $0.3839 could be possible.

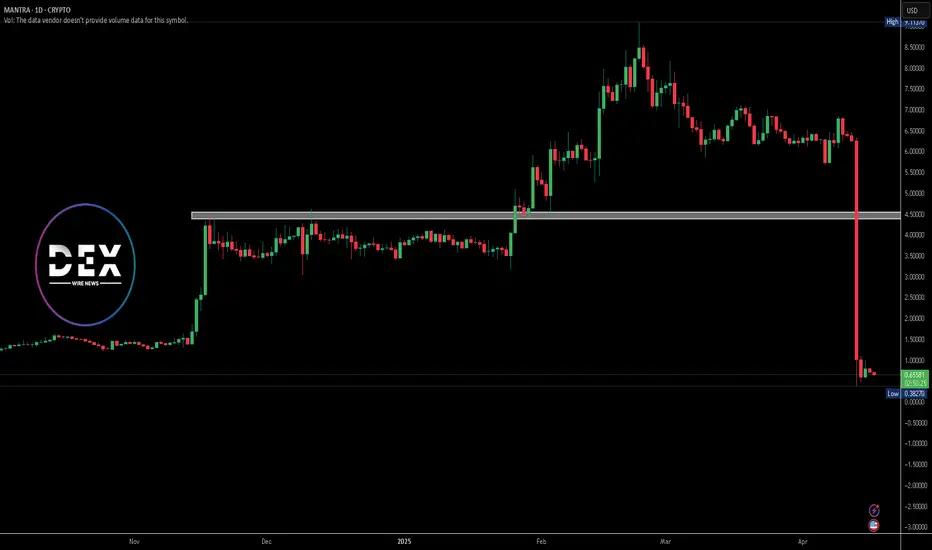
OM Token Plunges 92% as MANTRA Initiates InvestigationOn April 13, MANTRA’s native token, OM, experienced a dramatic 92% drop in price, plummeting from over $7 to just $0.66. The sharp fall occurred around 18:28 UTC during a period of low market activity. This sudden crash erased most of OM’s recent gains, bringing the weekly loss to -89.73%. As of now, OM trades at $0.6591 with a daily decline of 9.68%. The token holds a market capitalization of $634.76 million, with 24-hour trading volume at $387.43 million, reflecting a 42.99% drop.
MANTRA’s CEO, John Patrick Mullin, addressed the incident, clarifying that the collapse did not stem from any internal activity. He blamed the crash on “reckless forced closures” by centralized exchanges. Although no exchange was named, Mullin expressed concerns over the influence and decision-making power of these platforms, particularly during low liquidity windows such as Sunday evenings.
In response to the unexpected decline, MANTRA launched an internal investigation to identify the root causes and verify the token’s current circulating supply. To restore investor confidence, the project also announced a token buyback and burn program. These actions aim to support holders and reinforce OM’s long-term stability.
Technical Analysis
The OM/USDT chart reveals aggressive selling pressure signaling panic selling. After peaking near $9.11, the price sharply reversed, erasing months of gains. The absence of any meaningful volume during the crash suggests that liquidity dried up rapidly, leading to cascading liquidations. The price now hovers around a potential psychological support zone, but sustained recovery will depend on renewed demand and market confidence.
OP/USDT Secondary trend. Wedge. Pivot zones. 27 07 2024OP/USDT Secondary trend. Wedge. Pivot zones. 27 07 2024
Logarithm. Time frame 3 days. A descending wedge is forming. The price is near the dynamic Gann support (reaction from it), but still in the range of the descending wedge pattern. The reaction in this resistance zone will determine the trend for the near future.
On the chart, I have specifically shown the minimum percentages of the two key reversal zones for the trend to local resistance levels, for the potential of option A and B.
Major trend.
OP/USDT Major trend. 07 2024 Time frame 1 week.

Elliott Wave Update – Structure OverviewBINANCE:SOLUSDT
We may have found a potential local bottom at yellow Wave A, and are now tracking a move towards yellow Wave B.
This yellow Wave B appears to be unfolding as a 1-2-3-4-5 structure:
Waves 1-2-3 are likely completed.
Waves 4 and 5 could still be ahead.
This full impulse may form part of a larger A-B-C correction, completing the final yellow Wave B.
In the black wave count, the 1-2-3 move is finished.
Within Wave 3, we saw a clean internal 1-2-3-4-5, confirming the completion of that wave.
Currently, I’m tracking the move from black Wave 3 to black Wave 4 as a developing A-B-C correction:
Wave A is potentially in.
We are now in the resistance zone of Wave B, which could lead to the final drop into Wave C.
After completing Wave 4, I expect an upward move into black Wave 5, starting with an initial A-wave.
This should then form another A-B-C structure, leading to the completion of the final yellow Wave B.

LTC/USDT:BUYHello friends
Due to the good price growth, we see that the price has hit a lower ceiling and has fallen, which we can buy in stages during the price decline, within the specified ranges and move with it to the specified targets.
Observe capital and risk management.
*Trade safely with us*

APT/USDT:BUYHello friends
Given the good price growth, we see that the price is in an ascending channel and has fallen, we can buy in a stepwise manner in the price decline within the specified ranges and move with it to the specified targets.
Observe capital and risk management.
*Trade safely with us*

AVAX/USDT:BUYHello friends
Given the good price growth, we see that the price has not managed to reach a higher ceiling and has fallen, so we can buy in stages during the price decline within the specified ranges and move with it to the specified targets.
Observe capital and risk management.
*Trade safely with us*

XRPThe liquidity has been drained
ITS GO TIME !!
LOCK in, your future self depends on it.
GENERATIONAL WEALTH IS COMING

Trading opportunity for SOLUSDTBased on technical factors there is a Sell position in :
📊 SOLUSDT
🔴 Sell Now
🪫Stop loss 151.00
🔋Target 97.00
📏 R/R 2
💸RISK : 1%
We hope it is profitable for you ❤️
Please support our activity with your likes👍 and comments📝
