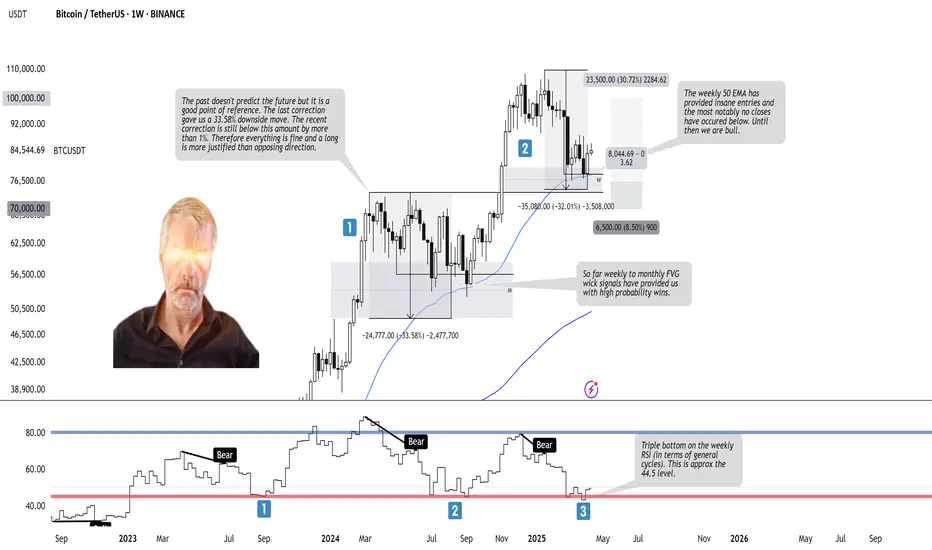
BTCUSDT - Trade Log BTCUSDT – Weekly Bullish Outlook
Weekly Context: Price has held the weekly Fair Value Gap and bounced off the 50 EMA, with clean wick rejections signaling strong buyer demand. The recent pullback (~32% from ATH) remains within historical correction bounds, and the tiny current retrace (<1%) suggests low downside risk. A triple bottom on the weekly RSI cycle around 40 further supports a bullish reversal.
Trade Plan (Long):
– Entry: Add longs near the weekly FVG / 50 EMA (around 75–87k).
– Stop: Place just below the FVG low (≈70k), risking ~5% of account.
– Target: First at 100k (psychological level), then previous ATH region for a 1:3+ RRR.
Bullish Catalysts:
• Weekly 50 EMA has only closed below twice—support intact.
• Weekly FVG wick signals have historically delivered high-probability bounces.
• Triple bottom on weekly RSI signals major capitulation is complete.
• Macro backdrop (equities & gold) remains positive for BTC.
Stay alert for any decisive weekly close below the EMA—until then, the bulls remain in control. 🚀
Cryptomarket
2018 Cycle Repeat? Bullish Bitcoin Until End of YearSee my DXY analysis for my full view on the performance on bitcoin (and other risk assets as well)
-Summary- bullish like 2018 until end of year.
-This chart pointing out time frames of past cycles, the over all market structure of bitcoins price, and the transformation of a bullish trend into the parabolic. (where I think we are now)

FET Correction Bottom Confirmed —Buy OpportunityThe next All-Time High for FETUSDT in late 2025 or early 2026 can reach between $5.42 or $8.56, giving us more than 1,600% profits potential from the current price. This is taking $8.56 as the next All-Time High. Let's get that part out of the way because I want to show you the end of the current correction. I am using the linear scale so it won't let me show you higher targets on the chart.
There was a resistance level in April 2022 as the bear market developed. This resistance was confirmed again in February 2023. It took 270 days, or 9 months, before this resistance level was conquered (broken). As soon as it broke, it was tested as support (Feb. 2024) and then a major rise. This major rise completed a long-term bullish cycle and after a bullish cycle a correction always develops.
How far down can the correction reach?
How low can prices go?
The correction started in March 2024 and is active until this present day. Obviously, the strongest resistance price range in the history of FETUSDT will need to be tested again but as support.
Now, FETUSDT bottomed last week and this bottom happened at the same level where the April 2022 and February 2023 resistance was found. As the action approached this level, volume started to go up. The next week, this week, we have a bullish candle and this is very likely the end of the correction; the bottom is in.
I just wanted to let you know that this level will hold because it was a strong resistance in the past. A resistance level once conquered turns into support.
As prices are now, it is the best possible time to enter; buy, go LONG.
This is a friendly reminder. I am wishing you tons of success and huge profits in this bull market that is just about to develop. It will be a bull market that will change the world. The world is already changing, but this bull market will close the deal. By the time it is over, Cryptocurrency will have taken over the world.
New money. The rich nouveau.
Namaste.

IQ Token Surges Over 48% as Volume Soars Amid Market OptimismThe IQ token saw a sharp 48.51% price increase in the last 24 hours, pushing its value to $0.005791. The market cap now stands at $123.02 million, reflecting renewed investor interest. Trading volume also surged by 1,409.49% within the same period, reaching $229 million. This rapid uptick in activity suggests a strong return of liquidity and momentum in the market.
IQ powers the Agent Tokenization Platform (ATP), an ecosystem designed for developers building autonomous and self-governing AI agents. These agents can hold and control digital or physical assets, including cryptocurrencies, DeFi protocols, and even robotics systems. ATP positions IQ as the core utility token that governs these decentralized agents and facilitates interactions across platforms.
The recent market movement appears tied to growing awareness of the platform’s utility and potential, especially in sectors combining AI and blockchain. As demand for verifiably autonomous systems rises, IQ's underlying use case could be gaining traction among forward-looking investors and developers.
Technical Analysis
On the IQ/USDT daily chart, the token recently bounced from long-standing horizontal support around $0.0038 after marking a low of $0.0032. A key resistance lies near $0.0058, the current market level, which has been previously tested multiple times. The price now hovers around the zone, where a breakout, retest and confirmation as support could lead to further upward continuation.
For now, IQ shows signs of strength, but sustained momentum will depend on market conditions and follow-through buying pressure. If bullish momentum gets rejected at the current level, a potential drop to around $0.3839 could be possible.

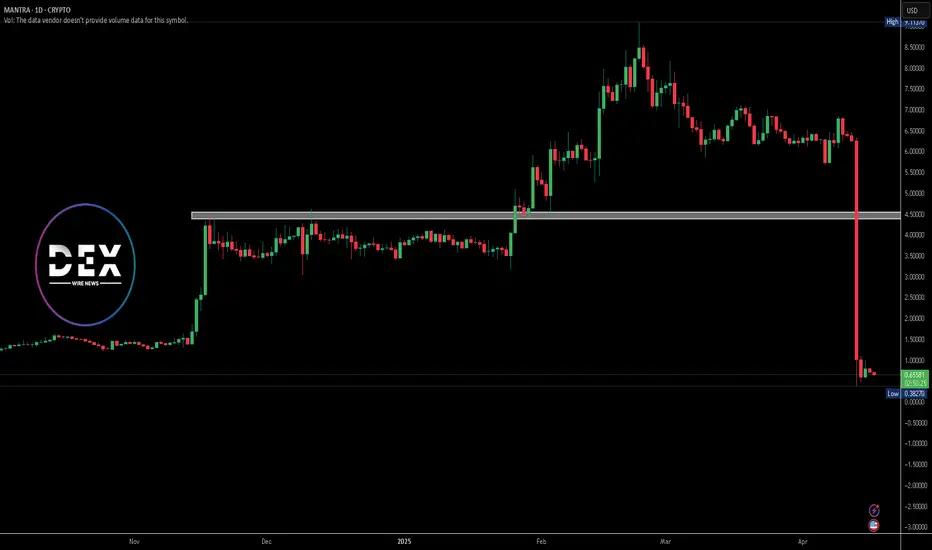
OM Token Plunges 92% as MANTRA Initiates InvestigationOn April 13, MANTRA’s native token, OM, experienced a dramatic 92% drop in price, plummeting from over $7 to just $0.66. The sharp fall occurred around 18:28 UTC during a period of low market activity. This sudden crash erased most of OM’s recent gains, bringing the weekly loss to -89.73%. As of now, OM trades at $0.6591 with a daily decline of 9.68%. The token holds a market capitalization of $634.76 million, with 24-hour trading volume at $387.43 million, reflecting a 42.99% drop.
MANTRA’s CEO, John Patrick Mullin, addressed the incident, clarifying that the collapse did not stem from any internal activity. He blamed the crash on “reckless forced closures” by centralized exchanges. Although no exchange was named, Mullin expressed concerns over the influence and decision-making power of these platforms, particularly during low liquidity windows such as Sunday evenings.
In response to the unexpected decline, MANTRA launched an internal investigation to identify the root causes and verify the token’s current circulating supply. To restore investor confidence, the project also announced a token buyback and burn program. These actions aim to support holders and reinforce OM’s long-term stability.
Technical Analysis
The OM/USDT chart reveals aggressive selling pressure signaling panic selling. After peaking near $9.11, the price sharply reversed, erasing months of gains. The absence of any meaningful volume during the crash suggests that liquidity dried up rapidly, leading to cascading liquidations. The price now hovers around a potential psychological support zone, but sustained recovery will depend on renewed demand and market confidence.
OP/USDT Secondary trend. Wedge. Pivot zones. 27 07 2024OP/USDT Secondary trend. Wedge. Pivot zones. 27 07 2024
Logarithm. Time frame 3 days. A descending wedge is forming. The price is near the dynamic Gann support (reaction from it), but still in the range of the descending wedge pattern. The reaction in this resistance zone will determine the trend for the near future.
On the chart, I have specifically shown the minimum percentages of the two key reversal zones for the trend to local resistance levels, for the potential of option A and B.
Major trend.
OP/USDT Major trend. 07 2024 Time frame 1 week.

Elliott Wave Update – Structure OverviewBINANCE:SOLUSDT
We may have found a potential local bottom at yellow Wave A, and are now tracking a move towards yellow Wave B.
This yellow Wave B appears to be unfolding as a 1-2-3-4-5 structure:
Waves 1-2-3 are likely completed.
Waves 4 and 5 could still be ahead.
This full impulse may form part of a larger A-B-C correction, completing the final yellow Wave B.
In the black wave count, the 1-2-3 move is finished.
Within Wave 3, we saw a clean internal 1-2-3-4-5, confirming the completion of that wave.
Currently, I’m tracking the move from black Wave 3 to black Wave 4 as a developing A-B-C correction:
Wave A is potentially in.
We are now in the resistance zone of Wave B, which could lead to the final drop into Wave C.
After completing Wave 4, I expect an upward move into black Wave 5, starting with an initial A-wave.
This should then form another A-B-C structure, leading to the completion of the final yellow Wave B.

LTC/USDT:BUYHello friends
Due to the good price growth, we see that the price has hit a lower ceiling and has fallen, which we can buy in stages during the price decline, within the specified ranges and move with it to the specified targets.
Observe capital and risk management.
*Trade safely with us*

APT/USDT:BUYHello friends
Given the good price growth, we see that the price is in an ascending channel and has fallen, we can buy in a stepwise manner in the price decline within the specified ranges and move with it to the specified targets.
Observe capital and risk management.
*Trade safely with us*

AVAX/USDT:BUYHello friends
Given the good price growth, we see that the price has not managed to reach a higher ceiling and has fallen, so we can buy in stages during the price decline within the specified ranges and move with it to the specified targets.
Observe capital and risk management.
*Trade safely with us*

XRPThe liquidity has been drained
ITS GO TIME !!
LOCK in, your future self depends on it.
GENERATIONAL WEALTH IS COMING

Trading opportunity for SOLUSDTBased on technical factors there is a Sell position in :
📊 SOLUSDT
🔴 Sell Now
🪫Stop loss 151.00
🔋Target 97.00
📏 R/R 2
💸RISK : 1%
We hope it is profitable for you ❤️
Please support our activity with your likes👍 and comments📝

TradeCityPro | Bitcoin Daily Analysis #64👋 Welcome to TradeCity Pro!
Let’s move on to the analysis of Bitcoin and key crypto indices. As usual, in this analysis I want to review the futures session triggers for New York.
⏳ 1-Hour Time Frame
Yesterday, the market continued to range within the same box and didn’t make any significant moves, but today we still have triggers and can open positions.
🔄 Yesterday I told you that after the fake breakout of the box top, strong bearish momentum could enter, increasing the likelihood of the box bottom breaking, and that we could enter a short position upon its break.
✔️ That’s exactly how it seemed—there was strong bearish momentum and the price tested the 83233 zone once. But it couldn’t break that area, and after a strong bearish candle, market volume dropped significantly, and the market became range-bound again, which still continues.
📈 Our key resistance remains the 85482 zone, and breaking this level could initiate the next bullish wave. So, we can enter a long position if this level breaks.
🔽 For a short position, the 83233 zone is still valid. As I mentioned, the price tested this level again yesterday, reinforcing its importance—so make sure to have a short position ready if this zone breaks.
👑 BTC.D Analysis
Let’s check Bitcoin Dominance. Today, dominance is in a corrective phase and has returned to the 63.87 zone and is retesting it.
💫 If this zone breaks and dominance continues its correction, we can consider dominance as bearish for now. But if dominance finds support here, it can continue its upward move and form a higher high.
📅 Total2 Analysis
Yesterday, the Total2 index had a fake breakout at the 932 zone, re-entered its box, and with the momentum that entered the market, moved upward. It has now broken the 947 zone and is retesting it.
🔍 If the price pulls back to this zone and is supported, it could start an uptrend and move toward 980.
💥 But if the price fails to stabilize above 947 and drops below it, we can confirm a bearish trend in Total2 with a break of 932 and open short positions on altcoins.
📅 USDT.D Analysis
Now for Tether Dominance: a small box has formed above the 5.39 zone, with the box bottom at 5.49 and the top at 5.59.
🎲 If the 5.49 zone breaks, we can confirm a bearish move in dominance down to 5.39. The main trigger for a bearish shift in dominance is the break of the 5.39 zone.
✨ For a bullish move in dominance, the 5.59 level is very important, and breaking it could begin a new upward trend for dominance.
❌ Disclaimer ❌
Trading futures is highly risky and dangerous. If you're not an expert, these triggers may not be suitable for you. You should first learn risk and capital management. You can also use the educational content from this channel.
Finally, these triggers reflect my personal opinions on price action, and the market may move completely against this analysis. So, do your own research before opening any position.

TradeCityPro | INJ: Key Triggers Amid Downtrend and Volume Shift👋 Welcome to TradeCity Pro!
In this analysis, I want to review the INJ coin for you—one of the attractive crypto networks, which with a market cap of $783 million, is ranked 73rd on CoinMarketCap.
📅 Daily Time Frame
In the daily time frame, as you can see, we have a downtrend that started after the price was rejected from the 25.43 top, and after breaking 16.04, the main bearish leg of the price began and dropped down to the 6.94 zone.
🔽 This bearish move has followed a trendline that we can also observe in most altcoins. Currently, market volume is decreasing, and it can be said that the price is diverging from the volume—and if this divergence is activated, the price will reverse trend.
✔️ The first trigger for a trend reversal is the break of the trendline. Given the volume divergence, if this happens and the trendline breaks, we can consider the break of the 8.96 trigger as the main reversal confirmation.
📈 If the price stabilizes above the 8.96 zone, it can move upward and start an uptrend. The next resistance for the price would be 16.04. However, for a spot buy, the 25.43 trigger is the most important one, which the price is still far from.
💥 On the other hand, if the 6.94 zone is broken, the price will move downward and may start another bearish leg. But an important point is that there’s a very strong support at the 5.65 zone, and if the price moves downward, it may be supported by this area—so it's better to confirm the next bearish leg with a break of 5.65.
⏳ 4-Hour Time Frame
Let’s move on to the 4-hour time frame to examine suitable triggers for futures positions.
🧩 As you can see in the 4-hour time frame, there’s a descending channel in which the price is moving, and it is currently near the top of the channel.
🔼 For a long position, if the channel top is broken, we can enter a position with the activation of the 8.51 trigger. If the price tests this zone multiple times, the position can become much more reliable, and the possibility of a sharp bullish move increases.
📊 The important point is that buying volume should increase as the price moves toward 8.51, because for a trend reversal, volume must converge with price.
📉 For a short position, the first trigger is the break of the 7.61 zone, which is a good trigger because the price is being rejected from the channel top, and there is a possibility that the price moves toward the midline or bottom of the channel.
🎲 The main trigger for the short position is the break of 6.94, which is a very important low, and breaking this zone can lead to a sharp move down to the 5.65 zone.
📝 Final Thoughts
This analysis reflects our opinions and is not financial advice.
Share your thoughts in the comments, and don’t forget to share this analysis with your friends! ❤️

BTC Falling Wedge .Displaying a Falling Wedge pattern, there will be some downside to come, but after that, we will see a push-up to the north.
SUPPORT AT $73,805
$111K TP

XRP/USDT Breakout Pattern (15.04.2025)The XRP/USDT Pair on the M30 timeframe presents a Potential Selling Opportunity due to a recent Formation of a Breakout Pattern. This suggests a shift in momentum towards the downside in the coming hours.
Possible Short Trade:
Entry: Consider Entering A Short Position around Trendline Of The Pattern.
Target Levels:
1st Support – 2.0158
2nd Support – 1.9362
🎁 Please hit the like button and
🎁 Leave a comment to support for My Post !
Your likes and comments are incredibly motivating and will encourage me to share more analysis with you.
Best Regards, KABHI_TA_TRADING
Thank you.

Will This Descending Wedge Push HYPE to 22.5?If we take a closer look at the price structure, the orange and blue arrows show that BITGET:HYPEUSDT is in an overall uptrend. Meanwhile, the white arrow represents a minor pullback—just a ripple within the bigger trend.
When we connect the orange to the white, and then the white to the blue arrow, we can spot a descending broadening wedge formation. Given the current bullish structure, this pattern is more likely acting as a continuation rather than a reversal.
After the pattern is completed, the key level to watch is the resistance around 16.62, which comes from the white arrow's high. This level will decide whether price can break through and continue its bullish momentum toward the target zone at 20.52 – 22.55, or if sellers will step in and cause a rejection.
In case of a rejection, we might see some sideways movement as the market consolidates before making the next move.

AERGO Crashes 61% After Binance Futures Listing Aergo (AERGO) saw a dramatic price crash on April 16, falling by 61.32% within 24 hours to $0.1590, despite high trading activity. The sharp drop followed Binance’s launch of the AERGOUSDT Perpetual Futures Contract, which allows trading with up to 15x leverage. The contract went live at 11:00 UTC.
Before this event, Aergo had reached a recent all-time high close to $0.76, marking strong bullish momentum. However, the futures launch triggered heightened volatility, leading to a swift decline in market price shortly after trading opened.
Currently, Aergo’s market capitalization stands at $75.95 million, while its fully diluted valuation (FDV) is $79.61 million. The 24-hour trading volume has skyrocketed to $1.56 billion, reflecting a 204.66% increase, with a volume-to-market cap ratio of 2060.24% — signaling extremely high turnover. The token’s circulating supply is 477.49 million AERGO, with a total and max supply capped at 500 million AERGO. Holders of the asset currently number 7.65K.
Aergo is a hybrid enterprise blockchain platform built by Blocko, a Samsung-backed South Korean firm. The platform enables SQL-compatible smart contracts and supports both public and private blockchain systems. It has seen adoption by major institutions such as Hyundai Motors and the Korea Exchange.
Following its high, near $0.76, Aergo's price broke down sharply. It currently hovers around $0.1596. With the RSI close to oversold territory, traders may look for stabilization before any potential bounce.

SUPERUSDT – Dual Timeframe Long Signal (1D & 3D)📅 April 13, 2025
So, we have another long system entry — but this one is a bit special.
✅ The long signal is confirmed on both the 1D and 3D timeframes, which adds confidence to the setup.
✅ MLR > SMA > BB Center – strong technical confluence
✅ Price > PSAR – trend shift confirmed on both timeframes
However, risk context matters:
⚠️ On the 3D, price is still below the 50 MA
⚠️ On the 1D, price is still below the 200 MA
That means momentum is building, but we’re not in full bullish structure yet.
📌 My advice:
- Don’t use leverage on this entry
- Spot only, partial size
- Don’t go all-in — system says “yes,” but structure says “wait and scale”
Discipline protects you. Emotions don’t.

ETHUSD Market Analysis – Short SetupI'm going short on ETHUSD based on current market structure and key resistance levels.
📉 Trade Details:
Entry Price: $1,649.43
Stop Loss: $1,656.60
Take Profit: $1,564.97
🧭 Reason for the Trade:
ETHUSD recently tapped a resistance zone near $1,650, which has acted as a supply area multiple times in the past. After a weak bullish push with low momentum, price started to stall showing signs of rejection with long upper wicks on the H4 candles.
This hints that sellers are stepping in and bulls are losing steam.
🔥 Why I’m Short:
Price rejected the $1,650 zone
Weak bullish candles near resistance
H4 shows bearish structure forming
Risk/reward ratio is solid
📍Risk Management:
I’m keeping things tight with my Stop Loss at $1,656.60 — just above the resistance zone. If price breaks above this, it means sellers are likely out of the game.
Take Profit is set at $1,564.97, right above a demand area and previous support. This gives the trade room to breathe while locking in profit before price bounces.

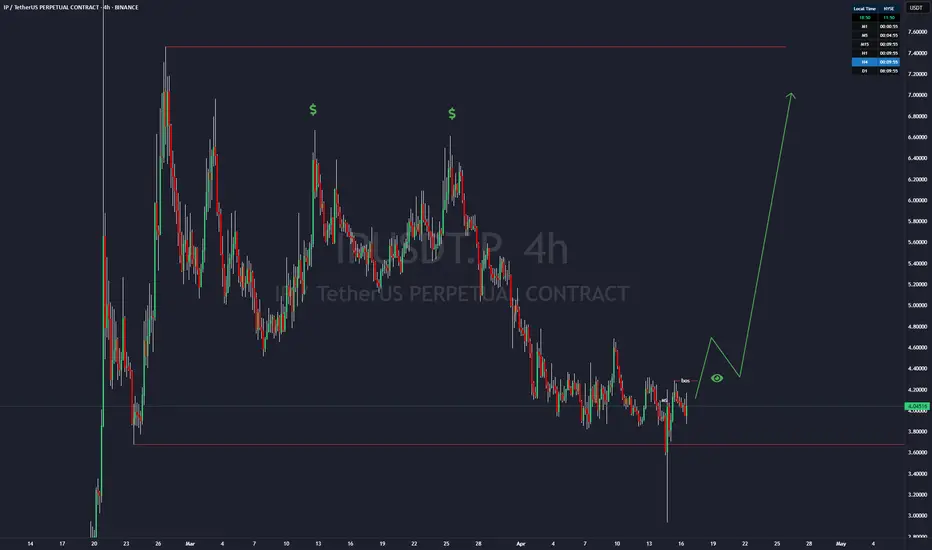
Is crypto dead? NO! IP might save the day!Price Action Analysis
NYSE:IP recently declined to the $3.67 level, effectively sweeping external liquidity by triggering stop-loss orders below key support. This move was followed by a strong recovery, with price fully absorbing the bearish momentum and closing within the global trading range. This price action resulted in a Market Structure Shift (Change of Character, or ChoCH), indicating a potential reversal from bearish to bullish sentiment. The ChoCH suggests institutional buying interest, as the market rejected further downside and reestablished bullish structure.
However, caution is warranted. Bitcoin ( CRYPTOCAP:BTC ), a key market driver, may experience a corrective move lower, potentially influencing NYSE:IP ’s price action. As such, immediate entries are premature without further confirmation of bullish momentum.
Key Levels and Trade Setup
Break of Structure (BoS) at $4.28
The $4.28 level on the daily timeframe is pivotal, representing a potential Break of Structure (BoS). A decisive close above this level would confirm bullish continuation, signaling the start of a significant upward move. Should this occur, NYSE:IP is likely to target the following resistance zones:
$6.61: Initial target, likely aligning with prior swing highs or liquidity pools.
$6.98: Secondary target, potentially coinciding with a Fair Value Gap (FVG) or institutional sell-side liquidity.
$7.46: Final target, representing a high-probability zone for profit-taking.
Entry Confirmation
To ensure a high-probability trade, the following conditions must be met:
Daily BoS Confirmation: A clean break and close above $4.28 on the daily chart, supported by elevated trading volume.
4-Hour Timeframe Validation: A breakout above $4.28 on the 4-hour (4H) or higher timeframe, ideally accompanied by a bullish Fair Value Gap (FVG). An FVG forming on the 4H chart post-breakout would serve as an optimal entry zone, minimizing risk by aligning with institutional order flow.
Pullback to FVG: Post-breakout, a retracement to a 4H bullish FVG (e.g., $4.20–$4.25) that holds as support would confirm the setup for a long position.
Trade Execution
Set Alerts: Configure price alerts at $4.28 to monitor for a daily or 4H breakout. Ensure alerts trigger on a candle close above this level to confirm BoS.
Risk Management: Risk no more than 1–2% of trading capital per trade. Position size should be calculated based on a stop-loss placed below the FVG or recent swing low (e.g., $4.00–$4.10), targeting a minimum risk-reward ratio of 5:1.
Exit Strategy: Take partial profits at $6.61 (50–70% of position) and trail stops for the remaining position toward $6.98 and $7.46, monitoring for signs of rejection or bearish structure at these levels.
Bitcoin Correlation
Given CRYPTOCAP:BTC ’s influence on altcoin price action, monitor its key levels closely. A potential corrective move in CRYPTOCAP:BTC could lead NYSE:IP to retest lower supports (e.g., $3.85 or $3.67). Set a secondary alert at $3.85 to watch for a bounce in case of a broader market pullback. Conversely, a stabilization or bullish breakout in CRYPTOCAP:BTC would enhance the likelihood of NYSE:IP ’s bullish setup materializing.
Conclusion
NYSE:IP presents a compelling technical setup, with a ChoCH at $3.67 signaling a potential bullish reversal and $4.28 as the critical level for BoS confirmation. Traders should set alerts at $4.28, await a clean 4H or daily breakout with FVG formation, and execute entries with disciplined risk management. Monitoring CRYPTOCAP:BTC ’s price action is essential to avoid adverse market-wide corrections. This setup offers a high-probability opportunity for significant upside, provided the outlined conditions are met.
TradeCityPro | Bitcoin Daily Analysis #63👋 Welcome to TradeCity Pro!
Let’s move on to the analysis of Bitcoin and key crypto indices. As usual, in this analysis I want to review the futures session triggers for New York.
⏳ 1-Hour Time Frame
Yesterday, a short position could have been opened that might have already brought you good profit.
🔄 In yesterday’s analysis, I told you that if the price pulls back to the 85482 zone, gives a confirmation candle, and buying volume increases, you could open a long position. That didn’t happen—there was no confirmation candle, and the zone turned out to be a fake breakout.
👀 For a short position, I also mentioned that if the price fakes the breakout of this zone, you could enter a short position on lower time frames after the break of a short-term trigger, targeting 83233. This scenario played out exactly, and the price gave a trigger on lower time frames and dropped to 83233.
📉 But today we also have a trigger for opening a position, so don’t worry too much—you haven’t missed a lot. Yesterday’s position was opened in a risky context, and if you followed proper risk management, you shouldn’t have taken much risk on that position, and naturally, wouldn’t have made a large profit either.
🔑 A fake breakout of a box top indicates strong seller momentum, so currently, bearish momentum is stronger than bullish, and the price leans more toward decline. On the other hand, the 83233 zone is very significant, and the price has reacted to it several times, making it an important support zone.
📚 So, with that in mind, if the 83233 zone breaks, you can enter a short position. If, before breaking this zone, the price creates a lower high compared to 85482, we’ll have even more confirmation—because based on Dow Theory, when price fails to reach its previous high, it shows that buyers are weakening. So breaking the low, which overlaps with the 83233 support, gives us a very solid position.
💫 But an important point to consider is that the price formed several bullish legs before creating this box, so overall, the current market momentum is still more bullish, and all short positions carry more risk than long positions.
📈 For a long position, the 85482 zone remains a valid trigger, and if the price stabilizes above it, we might see the next bullish leg. Personally, I prefer that the price tests the 85482 zone once more so we can get a more accurate level, and then break it on a subsequent attempt, which would make opening a position easier.
✔️ Of course, even if the zone is broken on the first try, I’ll open a long position, but if it's broken on the second or third attempt, we can enter with more confidence and take more risk.
📊 After the range box was broken, market volume has been declining, and only a few candles have significant volume—these are considered outliers and can be ignored. So the most important thing is that if a trigger is activated, the volume should align with that direction and support the price move, showing convergence.
👑 BTC.D Analysis
Let’s take a look at Bitcoin dominance. It’s still bullish and, after breaking above 63.87, has continued its new bullish leg.
🧩 As a reminder, as long as BTC Dominance hasn’t changed trend or turned bearish on higher time frames like the daily or weekly chart, buying any altcoin isn’t logical. We need to wait for a trend change. For now, we see dominance as bullish, so long positions on Bitcoin and short positions on altcoins are suitable choices.
📅 Total2 Analysis
Now for Total2 analysis: yesterday, both short triggers I gave were activated, and the price moved downward.
🧲 Currently, a low has formed around the 932 zone, and if this zone breaks, the price could continue its downtrend. On the other hand, if the 947 zone breaks and the price moves back above it, we can consider opening a short-term long position in lower time frames.
📅 USDT.D Analysis
Let’s look at Tether dominance. Yesterday, I mentioned that dominance was interacting with the 5.39 zone and that if it breaks, the market could move upward.
🚀 But that didn’t happen—instead, the price moved upward and even broke above the 5.53 ceiling. Currently, it’s returning to its range box again and may head back toward the 5.39 level. If that zone breaks, we can still take it as a confirmation of a bearish shift in dominance.
❌ Disclaimer ❌
Trading futures is highly risky and dangerous. If you're not an expert, these triggers may not be suitable for you. You should first learn risk and capital management. You can also use the educational content from this channel.
Finally, these triggers reflect my personal opinions on price action, and the market may move completely against this analysis. So, do your own research before opening any position.

