2 options but both are bullish!CRYPTOCAP:BTC is consolidating but wants to make a next leg next week. Or we break out out of the falling wedge or after some more consolidation in the ascending wedge.
either way bullish!!!
Cryptomarket

Chainlink Trend update on 06/May/2025Chainlink market update on 06/May/2025. Currently, it break 13.8$ and keep our eye to see whether it touch 12.8$ zone and reverse or not.
#Chainlink #Defi

Bitcoin Daily Bullish CUP pattern but with resistance coming in
Please excuse the number of lines here but this is my working chart and I am short of time but I wanted to share this.
Bitcoin Daily has printed a Bullish CUP and is back on the Rim but we have still to reach the edge of the Cup, which is expected around 15th May, 10 days. When PA entered thhis Cuo, it also ranged sideways for a while.....
Something that PA has to face in the near future is that red 236 fib circle. And PA may be already reacting to that.
Look to the left and see what happened last time we hit a red 236 fib circle.
I think we are in a stronger position this time though but a Drop to the Long term rising trend line is a very real possibility
That is around 92K - > 87K -Not a Major drop and it would actually play into the Bulls hands by resetting the Daily MACD that is already beginning to turn slightly Bearish
This is NOT a reason to PANIC or Sell but is more an opportunity, maybe the last one, to Buy BTC at around this price.
I think a drop back down to the 2.272 Fib extension at 77K is highly unlikely but we should have a plan should this happen.
We do have the DXY support group, sorry, THE FED announcing the Next decision of Rates on 7th and it is very likely that PA will Drop till then, slowly hopefully, resetting the MACD as previously mentioned, and then push through that 236 Fib circle after the continued Freeze on Rates is announced.
We have to wait and see......

TradeCityPro | Bitcoin Daily Analysis #81👋 Welcome to TradeCity Pro!
Let’s get into the analysis of Bitcoin and the key crypto indices. As usual, I’ll review the futures triggers for the New York session.
⏳ 1-Hour Timeframe
As you can see, Bitcoin has continued its correction down to the 95370 level and is currently testing this zone.
✔️ If the price breaks below this level and moves further down, we will start to see signs of a trend reversal. However, for short positions, I personally prefer to wait for a confirmed trend reversal.
📈 For long positions today, if the price pulls back to the 95370 zone, you can consider entering. Confirmation of the pullback can be taken from lower timeframes through candlestick signals or structural breaks.
📊 Market volume increased during the last corrective leg, which could raise the probability of a break below 95370.
👑 BTC.D Analysis
Moving on to Bitcoin dominance — the range between 64.77 and 64.91 still holds, with price fluctuating within.
⚡️ A breakout above 64.91 would confirm the continuation of the uptrend. A break below 64.77 could suggest a deeper correction.
📅 Total2 Analysis
Looking at Total2, the 1.03 support has broken and price is now moving downward. If this trend continues, it could drop to lower support levels.
⭐ However, if the break below 1.03 turns out to be a fakeout, price could rebound and head back toward 1.05.
📅 USDT.D Analysis
Finally, USDT dominance has closed above 5.10 today and may be starting its bullish leg.
💥 If this upward move continues, the market could experience a broader sell-off. Should Bitcoin triggers activate, this would be a good context to consider short positions.
❌ Disclaimer ❌
Trading futures is highly risky and dangerous. If you're not an expert, these triggers may not be suitable for you. You should first learn risk and capital management. You can also use the educational content from this channel.
Finally, these triggers reflect my personal opinions on price action, and the market may move completely against this analysis. So, do your own research before opening any position.

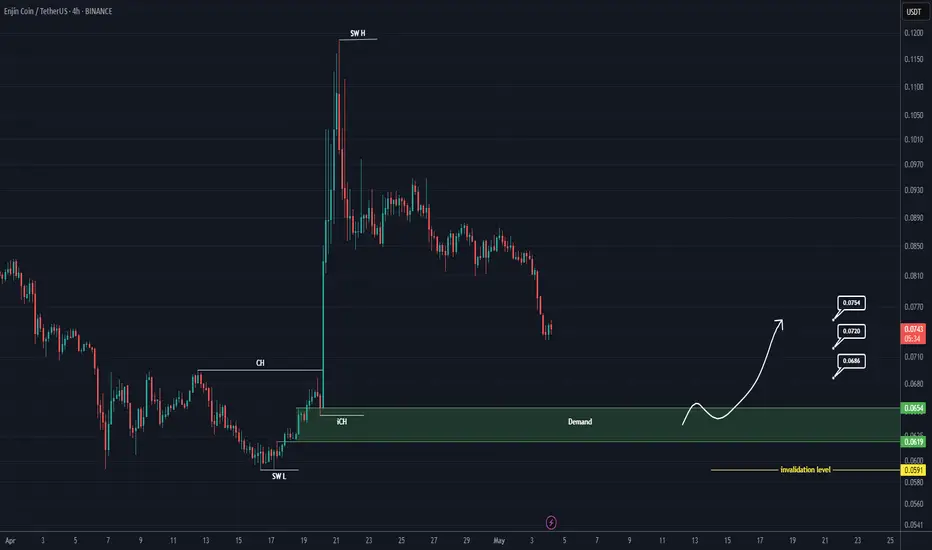
ENJ Buy/Long Setup (8H)After a bullish move and the formation of a strong change of character (CH), followed by a FOMO-driven ENJ rally, the price is now approaching support zones. In areas where strong buyers were previously active, we can look for a buy/long position.
The origin of this move is expected to hold, and price is likely to move toward higher zones.
We are looking for a buy/long position around the demand zone.
Targets are marked on the chart.
A daily candle close below the invalidation level will invalidate this analysis.
For risk management, please don't forget stop loss and capital management
When we reach the first target, save some profit and then change the stop to entry
Comment if you have any questions
Thank You
NOT SELLHello friends
Due to the sharp drop in price, we can open a trade in the direction of the trend, of course with capital and risk management.
*Trade safely with us*

Bitcoin MAsAfter a good rally bitcoin had 2 weeks age, now still managing and staying above 20MA for weekly, which is really bullish to me

TRB SELLHello friends
Due to the sharp drop in price, we can open a trade in the direction of the trend, of course with capital and risk management.
*Trade safely with us*

Bitcoin (BTC) Analysis – Will the Rally Continue or Is a CorrectBitcoin is currently trading at $94,500 💰, but statistical studies and mathematical models indicate a potential downward movement 📉 that could push the price toward $93,800, with a strong likelihood of testing the $89,900 zone.
🛡️ Critical Support at $89,000
To maintain the long-term bullish trend, it is crucial that Bitcoin holds above the $89,000 support level. If the price closes below this level for an entire week, it would be a clear negative signal ❌ and could suggest a trend reversal to the downside for a longer period before any renewed upward movement.
✅ When Does the Correction End?
According to statistical studies and mathematical models, the clearest signal that the current correction has ended would be a break above $97,650 followed by three consecutive daily closes above this level 📈.
If this scenario plays out, we could see a strong and rapid surge toward the following targets:
🎯 Target 1: $104,900
🎯 Target 2: $112,900
💡 Investor Advice
If the breakout occurs, it is advisable to take profits 💸 at the mentioned targets and avoid entering new positions until further notice. The market could experience dramatic and swift movements ⚡, so caution is essential.
📢 The analysis will be updated upon reaching these levels to provide a clearer outlook based on price behavior at that time.
Would you like this version formatted for social media, blog post, or perhaps exported as a PDF or presentation slide?

Ethereum Rebounds from Key Confluence Zone$ETH/USDT Weekly Chart Analysis
Ethereum is holding a major long-term uptrend as the price bounces off the ascending trendline support. This level also aligns with a strong historical resistance-turned-support zone, adding more confluence to the current bounce.
As long as ETH stays above this structure, it suggests a potential macro bullish continuation, with eyes on the upper resistance line near $3,200–$3,500.
A strong defense at this zone reinforces long-term bullish sentiment.

LINKUSDT.P LONG SIGNSL 1hHello dear traders,
LINK is showing a bullish structure on the 1-hour timeframe, and it has the potential to move toward the liquidity zone around 13.290.
The trade setup is shown on the chart.
Please make sure to manage your risk properly.

FORM/USDT Analysis: ATH Incoming
This token has just tested its all-time high on Binance.
During the price increase, we spotted a strong volume zone between $2.48–$2.42, where the market is currently trading.
We are considering a long position targeting a new ATH.
This publication is not financial advice.

Bitcoin Stabilizes at $94,000 — What's Next?Following a strong rally in early 2025, Bitcoin is now showing signs of stabilization, hovering around the $94,000 mark. For a notoriously volatile asset, this steady price movement might seem unusual. However, this calm may be the calm before the storm—either a breakout or a pullback. So, what’s behind this current phase of Bitcoin’s price?
Firstly, all eyes are on the U.S. Federal Reserve. Investors are nervously anticipating its next interest rate decision. As always, monetary policy acts as a major catalyst for risk assets. A rate cut could boost inflows into the crypto market, while a hike might lead to capital outflows and dampen sentiment.
Secondly, retail investor activity appears to be cooling. Trading volumes have declined compared to the high levels seen in February and March, when the market was filled with euphoria. Now, we are witnessing a period of cautious waiting. The "Fear and Greed Index" reflects this, hovering around neutral territory, indicating market indecision.
From a technical standpoint, analysts identify two key levels: strong resistance near $100,000 and a support zone around $90,000. As long as Bitcoin remains within this range, short-term traders are operating in a sideways market while longer-term investors remain on standby.
Beyond macroeconomic factors, crypto-specific developments will also influence BTC’s price. Important upcoming events—such as Ethereum’s upgrade, potential regulatory changes in the UK and Japan, and global crypto conferences—could all act as catalysts.
Institutional investors are another major factor. Companies like MicroStrategy continue to accumulate Bitcoin, adding confidence to the asset’s long-term outlook. If more institutions follow suit, Bitcoin could see increased demand and stronger bullish momentum.
In the near term, market participants are advised to stay cautious. Bitcoin may continue consolidating until a clear macro or market-specific catalyst emerges.
All in all, $94,000 is more than just a number. It represents a temporary equilibrium of forces—bullish and bearish. The question is not whether Bitcoin will move again, but when and in which direction.

KASPER - THE GHOAST OF KASPA (TA + TRADE PLAN) BY BLAŽ FABJANTechnical Analysis for KASPER (KASPER/USDT) by Blaž Fabjan
Trend Analysis:
The chart indicates a rising wedge pattern on the horizon, a bearish reversal signal, which suggests a potential downward price movement after the completion of the pattern.
The price is currently in a consolidation phase, with a series of lower highs and higher lows within the wedge structure.
Support and Resistance Levels:
Resistance: The price has approached a resistance zone around the Wick High level, which indicates selling pressure in this area. A breakout above this resistance level could lead to a continuation of the upward trend.
Support: The Strong Low zone is acting as the lower support for the current price action, with buyers attempting to defend this level.
Indicators:
RSI (Relative Strength Index): Currently at 82.43, which is in the overbought territory, indicating that the asset may be overextended and susceptible to a pullback or correction.
MFI (Money Flow Index): The current MFI reading suggests an inflow of capital into the asset, indicating that the buying pressure is strong. However, if the price hits the overbought region, it could signal a reversal.
Stochastic: The stochastic oscillator is at 96.19, indicating that the price is in an overbought condition and might be due for a pullback or consolidation in the short term.
VMC Cipher B Divergences: The indicator is showing bullish divergence at the recent lows, suggesting that buying pressure could continue, but it needs to be validated by a breakout above resistance.
Volume:
The volume is gradually increasing, which is a positive sign for the continuation of the trend. However, volume spikes during a breakout are crucial to confirm the trend's strength.
Trading Plan for KASPER (KASPER/USDT)
Key Entry Levels:
Breakout Entry: If the price breaks above the resistance zone near 0.00001000, consider entering a long position. Set the take profit target at around 0.00001500 (strong bullish continuation level) for a potential 50% price increase.
Reversal Entry: If the price fails to break the resistance and starts falling towards the Strong Low support level near 0.00000500, consider entering a short position. A move below the Strong Low could signal a reversal of the current uptrend.
Stop-Loss and Risk Management:
Long Position Stop-Loss: Set a stop-loss just below the Strong Low (around 0.00000450) to protect from a sudden price drop. The stop should be tight as this asset is volatile.
Short Position Stop-Loss: If entering a short position, place the stop-loss above the resistance level at 0.00001050 to minimize losses in case of a breakout.
Target Levels:
Short-Term Target (Bullish): If the breakout occurs, consider targeting a price of 0.00001500 based on the rising wedge pattern's projected price target.
Short-Term Target (Bearish): If the asset fails to hold above the support zone and breaks lower, target the 0.00000350 level as the next potential support area.
Trading Psychology:
Patience: This is a volatile asset, and it's important to wait for clear confirmation of a breakout or breakdown before entering the trade.
Risk-Reward Ratio: Aim for a 1:3 risk-reward ratio, which ensures you are risking less compared to the potential reward on each trade.
Monitor Indicators: Regularly monitor the RSI, Stochastic, and MFI for overbought or oversold signals. Additionally, follow volume patterns closely to gauge market momentum.
Exit Strategy:
Exit the position once price targets are reached or if indicators show signs of an exhaustion or trend reversal (e.g., RSI turning downward from overbought levels, stochastic crossing down).
Given the current chart formation and technical indicators, KASPER could be poised for a breakout to the upside, but there is a high risk of a correction given the overbought conditions.
Caution is recommended: monitor price action closely and adjust your strategy accordingly to avoid entering too early in a rising wedge or an overbought market.

One Last Drop Before Take Off?Price is still in a pullback phase, and the next potential target zone is around 0.07488 – 0.07334.
We might see one last dip before BINANCE:STPTUSDT resumes its uptrend.
If the price reaches this pullback zone with a bullish divergence, that would be a strong confirmation for a possible reversal.
But even without divergence, we can still rely on candlestick patterns to signal a potential reversal at that level.
What do you think — will BINANCE:STPTUSDT bounce from this zone or break lower?

BTC on high time frame
"Hello, focusing on BTC on high time frames, the price has pulled back to a significant zone around $75,000 and is currently showing bullish momentum. The next target appears to be the 4-hour order block located at $98,000."
If you need further assistance or have any specific questions, feel free to ask!

formed a bearish head and shouldersXVS has formed a bearish head and shoulders pattern and has already broken below the blue neckline. This breakdown suggests a potential move down to the green line level.
📈 Technical Overview:
Pattern: Bearish Head and Shoulders
Neckline: Blue level, already broken.
🎯 Target: Green line level upon confirmation of the breakdown.

OG Strong Chart Will Yield 888% Profits Within 6 MonthsI had to choose between this one and Milan's fan token. I went with this one because the chart is different. Milan (ACMUSDT) has the same chart as Atlético de Madrid (ATMUSDT). So you know what to look for there and you can also know now that ACMUSDT too is also bullish and coming out of major market bottom and low.
OG's chart is much more different though, the bottom was hit in May 2022 with a long-term higher low in August 2024 and another higher low on the 3rd of February 2025. This is a strong pair based on TA and guess what? It is ready now for a new wave of growth.
"Higher lows lead to higher highs," is a saying that I like to repeat over and over because it sounds nice. It doesn't necessarily have to be true but it will be true this time.
Most of the Altcoins produced a lower low in April compared to February or March, the fact that OGUSDT produced a higher low in April is a signal strength. This is enough to support a bullish wave.
The four weeks of bullish consolidation (prices moving slowly higher and the sessions closing green) supports the higher low signal.
Low volume in this instance —context is always needed for a signal to be interpreted correctly—means that the real action is yet to start. Not that the "growth is weak" but rather that there is no growth yet. So this is a positive signal. The fact that the market isn't dropping and is slowly growing and consolidating will lead to a strong bullish jump.
Ok. The technical analysis and signals are in place.
Now that we are done with the technological jargon we can move to the part we like most, take profits targets (TP for short).
Spoiler alert! I use the fibonacci tool to extract my targets against all other methods because this has been proven the most accurate over the years. Period.
» The purple target at ~$43 can yield 888% profits.
» The red target at $32 can yield 634% profits.
» The blue target at $21 can give an easy 380% profits if you were to buy at the current price and sell when this target hits.
Will these target hit or will they miss?
Just wait and see.
I can assure you that the market will turn green. That's all that matters to me.
It matters to me to give you a great entry price and great timing.
You are the one that should focus on securing your profits, it is a win-win-win.
Abundance, love, wealth, health and peace.
Thanks for being with me.
When I am gone, you will miss me.
Namaste.

BITCOIN 3 x Double Top, Dip, Range, Bounce since Jan 2023
The Chart says it all really.
The 3 times PA has gone sideways, it can be seen as a Double Top, Dip and Range.
The Accumulation / Distributions was similar on Both previous occasions ( 2023, 2024 ) and, so far, are also very similar on this occasion in 2025.
But there are some major differences.......
IF these were to be seem as forms of WYCKOFF Ranges, then the longer the Range period, the stronger the move higher after and I find it very clear, that the move higher after the 2023 range was a lot higher than the move higher after the 2024 Range
2023 Range was approx 189 days ( marked on a Weekly chart so up to 7 days inaccuracy )
2024 Range was approx 168 days.
Currently, we are on 147 days. ( I mark this as a significant date as there was a 20 day difference between 2023 ane 2024 and the 147 is 20 days short of the 2024)
However, this is slightly different this time as we Dropped out of original Range box and have Just pushed back higher into original range Box, so, even though we have had a good few weeks, we are still in Range, the Original Range Box
On the original Chart, the dotted line just below PA is the approx line of the 50 Week SMA and we bounced off that Twice in 2024 to push higher and we just bounced off that again to return to original range box.
But as you can see, that was only a Wick down. It may not have been a Full on bounce to take us out of the upper range box and I see Momentum slowing for a while now
This also happened on previous occasions but on a smaller scale.
This can be seen better on the Daily chart, that includes the SMA's
SMA's 50 Red, 100 Blue, 128 Green & 200 Yellow
The first thing to note is how the 200 is about to cross the 100
This is NOT a thing to panic about as the recent push higher will not be reflected in these Averages for a while but it does show the Depth of the Dip we just came out of.
What IS important is how PA is ABOVE the Averages..
But the Candle size are small and we are cooling off on a Daily MACD
We are NOT overbought on this MACD yet and so we could see a turn higher but Longer term, so long as we remain in the upper Range Box, it would be good if this cooled off to Neutral again
For me, I am hoping for a GREEN MAY candle Close and that could very well happen but the candle may not be Large, which leaves PA still in this Range by month end, but maybe in the upper edges of it....around 110K
This would then allow for the possible Small RED June, that would take PA back to lower range. as we saw in 2020 - .THEN we have a nice cooled PA
OR we could just go for it NOW and see what happens as we did in 2017
it is impossible to predict this but we can be ready ..
BUY BOTCOIN - HOLD BITCOIN

BABY Looks Bullish (4H)Note: Given the corrective nature of the market, only consider entering this symbol within the green zone. Move to break-even at the first target.
According to the Baby structure, this symbol appears to be aiming to remain bullish.
From the point where we placed the (A) on the chart, expansion waves have started on this symbol.
As long as the green zone is maintained, the price can move toward the targets.
A daily candle closing below the invalidation level will invalidate this analysis.
For risk management, please don't forget stop loss and capital management
Comment if you have any questions
Thank You

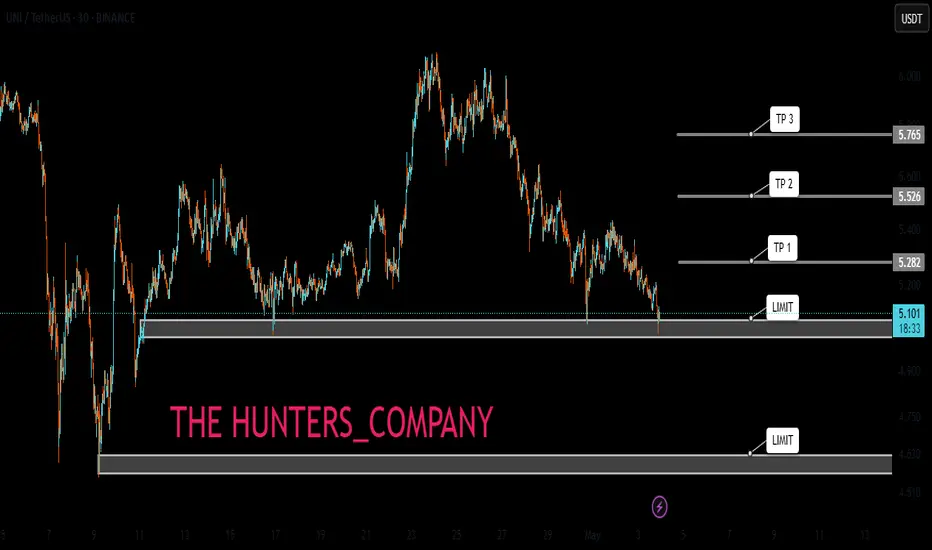
UNI:LIMIT FOR BUY(FREE)Hello friends
Due to the price drop, we can buy on the drop within the specified limits and move with it to the specified targets, of course with capital and risk management.
*Trade safely with us*
CHZ LIMIT FOR BUY(FREE)Hello friends
Due to the price drop, we can buy on the drop within the specified limits and move with it to the specified targets, of course with capital and risk management.
*Trade safely with us*

SEI LIMIT FOR BUYHello friends
Due to the price drop, we can buy on the drop within the specified limits and move with it to the specified targets, of course with capital and risk management.
*Trade safely with us*
