Trading opportunity for Ravencoin RVNUSDTBased on technical factors there is a Buy position in :
📊 RVNUSDT
🔵 Buy Now
🪫Stop loss 0.01040
🔋Target 0.01820
📏 R/R 2,2
💸RISK : 1%
We hope it is profitable for you ❤️
Please support our activity with your likes👍 and comments📝
Cryptomarket

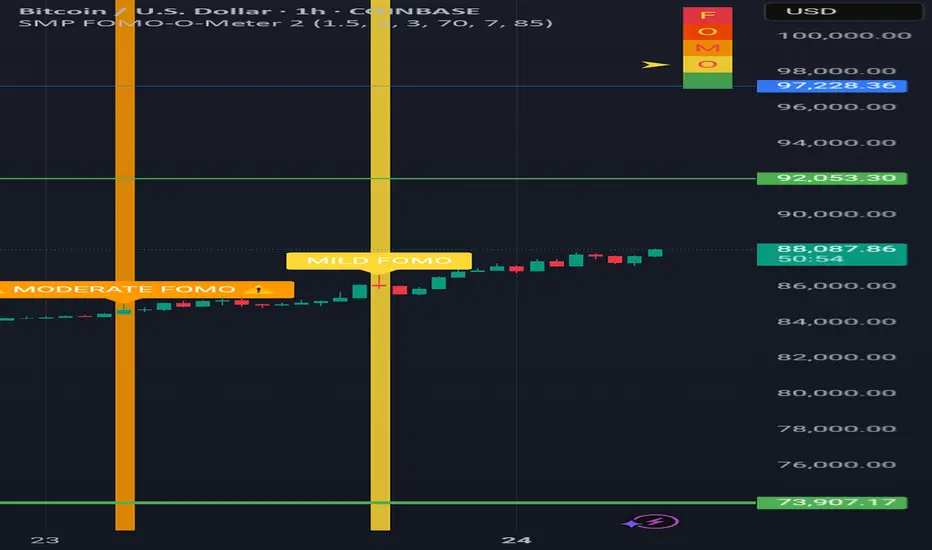
BTC Making a Comeback?Bitcoin www.tradingview.com is making a strong recovery, pushing higher with steady momentum. Despite the rally, the FOMO-O-Meter 2 shows no extreme greed—meaning the market isn’t overheating just yet.
With no signs of irrational exuberance, BTC could have room to run. Technicals point to a GETTEX:92K target, and as long as sentiment remains measured, this move might have legs.
Are we in for a grind higher, or is this the calm before the real FOMO storm? Let me know your thoughts!
BTCUSDT - it's breakout ? What's next??#BTCUSDT.. market just broke our resistance and going to close above that.
Keep close that because 85100 is now our supporting area and if market holds that then further bounce expected.
Note: keep in mind that below 85100 we will cut n reverse on confirmation .
Good luck
Trade wisely

Market overview
WHAT HAPPENED?
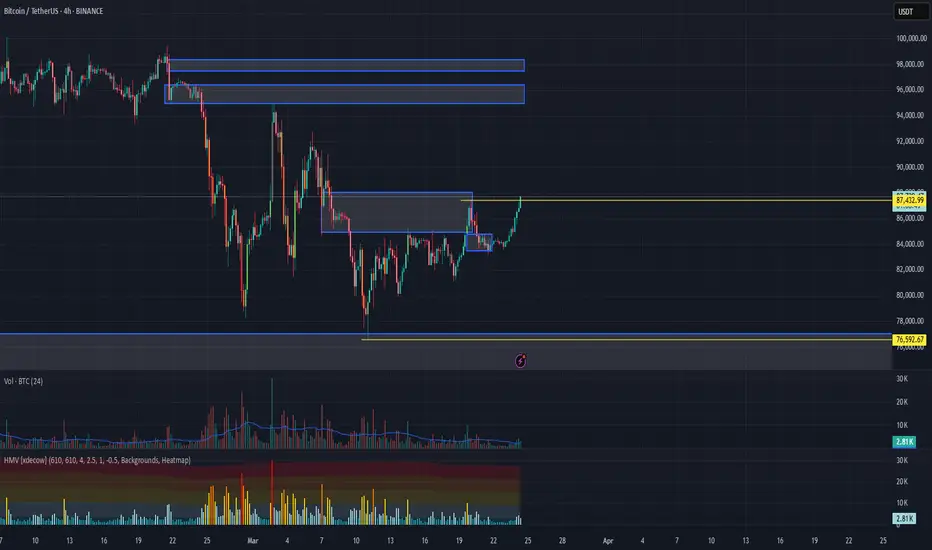
Last week, bitcoin tested the key zone of $85,000-$88,000 (volume zone). After receiving the seller's reaction, we formed a local structure that questioned the global decline.
In the daily analysis on TradingView on Friday, a support zone of $84,800-$83,500 (pushing volumes) was noted. After the test, we received a reaction and confirmed the buyers' intentions to move the quote to higher levels.
WHAT WILL HAPPEN: OR NOT?
At the moment, longs are a priority. The confirmation of this scenario will be overcoming the $87,500 level. The target for the movement is the $95,000 mark, and there is no significant resistance before it.
Despite the fact that we’re in an uptrend, there are no volume zones of the buyer up to the minimum mark of $76,000. Therefore, with strong market activity of the seller at the current level, it’s possible to resume the decline to the lows.
Sell Zones:
$95,000–$96,700 (accumulated volumes)
$97,500–$98,400 (pushing volumes)
$107,000–$109,000 (volume anomalies)
Buy Zones:
$77,000–$73,000 (volume anomalies, pushing volumes)
IMPORTANT DATES
About the macroeconomic news this week:
• Monday, March 24, 13:45 (UTC) — publication of the index of business activity in the manufacturing sector and the index of business activity in the US services sector for March;
• Tuesday, March 25, 14:00 (UTC) — publication of the U.S. consumer confidence index for March and data on new home sales in the United States for February;
• Wednesday, March 26, 7:00 (UTC) — publication of the UK consumer price index compared to February 2024;
Wednesday, March 26, 10:00 (UTC) — publication of the UK spring budget forecast;
• Thursday, March 27, 12:30 (UTC) — publication of US GDP for the 4th quarter of 2024, as well as the number of initial applications for US unemployment benefits;
• Friday, March 28, 7:00 (UTC) — publication of UK GDP for the 4th quarter of 2024;
• Friday, March 28, 12:30 (UTC) — publication of the basic price index of US personal consumption expenditures for February, as well as in comparison with February 2023.
*This post is not a financial recommendation. Make decisions based on your own experience.
#analytics
Is ALT season coming ? There is a chance we are about to see it The OTHERS Market Cap chart - Showing the MArket Cap of the TOP 125 coins MINUS the top 10 by Dominance.
So, this will show us the Mid Cap ALT coins
And as the chart shows you, there is a chance we could repeat a pattern and if so, could bring some relief to many MANY Alt Coins holders who have had a nightmare time so far this cycle.
So, Left hand arrow shows you the Dip after the 2017 High. See the trend line that comes off that, rejected PA in 2018 and 2020
Now look at the Right Arrow. Very similar situation.
and not only that but PA is on the lower trend line, Support..But also that Dashed Long Term Support line.
This is make or break for ALTS and given the change of Heart in the Markets, about acceptance of Crypto, there is no reason this shold not go through the roof - Providing the Liquidity is there.
THAT IS THE CRUNCH
So, we wait to see but ina positive mind set.
Things can turn around Quickly.

TradeCityPro | Bitcoin Daily Analysis #43👋 Welcome to TradeCity Pro!
Let's dive into the analysis of Bitcoin and other key crypto indices. As usual, I want to discuss the futures triggers for the New York session.
⏳ 1-Hour Timeframe
In the 1-hour timeframe, as you can see, Bitcoin finally moved, activating our trigger, and it reached its target. Now, let's analyze today's triggers.
🔄 Yesterday, the breakout of the 84734 range box was activated, and the price made an upward move.
✔️ Currently, the price has reached 86876 and has been rejected from this area but is still above it. If it can stabilize above this area, the next price leg could start.
💥 The RSI oscillator has significant resistance at 78.58, and breaking this area could introduce a lot of momentum into the market, potentially starting a robust upward leg.
⚡️ Additionally, this oscillator has important support at 70, and if it can maintain above this area, the likelihood of breaking 86876 increases.
🔽 For short positions, we need to wait for the price momentum to turn bearish before entering in line with the trend direction.
🧩 If the price does not stabilize above 86876 and moves downward, with confirmation from Dow Theory or the activation of a fake breakout trigger, you can enter a short position.
👑 BTC.D Analysis
Let's move on to the analysis of Bitcoin dominance. Yesterday, dominance was supported at 61.35 and moved up to 61.80, which helped Bitcoin rise more than altcoins.
🧲 Currently, dominance has been rejected from 61.80 and is moving downwards. I believe a range has formed between 61.35 and 61.80, and breaking this box in either direction could determine the next leg of dominance.
📅 Total2 Analysis
Moving on to Total2, yesterday the price broke the 1.05 area and moved upwards, even surpassing 1.07. Currently, I have moved the 1.05 area to 1.06 because it is more accurate, and the price has moved away from it.
⭐ The next resistance for the price is at 1.09, and it seems that Total2 could move up to this area.
📅 USDT.D Analysis
Finally, let's look at the Tether dominance analysis. Yesterday, the 5.25 trigger in dominance was activated, and we observed a clean pullback in dominance that brought it down to 5.13.
✨ The next support for dominance is at 5.08, and we need to see if it can stabilize below this area or not.
❌ Disclaimer ❌
Trading futures is highly risky and dangerous. If you're not an expert, these triggers may not be suitable for you. You should first learn risk and capital management. You can also use the educational content from this channel.
Finally, these triggers reflect my personal opinions on price action, and the market may move completely against this analysis. So, do your own research before opening any position.

Bitcoin (BTC/USD) Analysis – Daily Timeframe
Trend Overview
Bitcoin (BTC/USD) remains in an uptrend, with price holding above the ascending trendline support. The long-term bullish structure remains intact, characterized by a series of higher highs and higher lows since 2023.
Key Support and Resistance Levels
Primary Support:
$80,000 - $85,000 (Trendline support zone)
$75,000 (Psychological and historical support)
Primary Resistance:
$90,000 - $95,000 (Recent local highs)
$100,000 (Major psychological level)
Technical Indicators
Stochastic RSI is in the overbought zone, suggesting potential short-term consolidation or a pullback before resuming the trend.
MACD shows a bullish crossover, indicating positive momentum remains strong.
Volume analysis suggests buying pressure is still present but needs to increase to sustain further upside.
Market Outlook
Bitcoin continues to respect its long-term uptrend. As long as price remains above the trendline, the bullish outlook remains valid. However, a confirmed break below $80,000 could signal a deeper correction. If Bitcoin breaks above $90,000, the next major resistance is around $100,000.

Bounce from 200 EMA – Is XRP Ready to Fly?XRP is currently showing bullish momentum as it pushes toward the strong resistance zone after bouncing off the 200 EMA, which is acting as dynamic support. This move follows a consolidation phase above the strong support zone, indicating accumulation.
If the price breaks and sustains above the resistance zone, it could trigger a strong upward move.
DYOR, NFA

Market Shift Incoming! USDT Dominance Nears Critical Turning PoiThe USDT Dominance (USDT.D) chart is currently testing a strong resistance zone, where price action is showing signs of exhaustion. A bearish RSI divergence has formed, indicating potential weakness and a possible correction. The rising support line has provided multiple bounces, but a breakdown from this structure could trigger a larger downside move.
If USDT dominance falls, liquidity will likely shift into altcoins, potentially fueling a bullish rally in the altcoin market. Conversely, if USDT dominance continues to rise, it could signal increased market fear, leading to further weakness in altcoins.

Trading opportunity for RONUSDTBased on technical factors there is a Buy position in :
📊 RONUSDT
🔵 Buy Now
🪫Stop loss 0.6950
🔋Target 0.9900
📏 R/R 1,8
💸RISK : 1%
We hope it is profitable for you ❤️
Please support our activity with your likes👍 and comments📝

BITCOIN BASED ON WYCKOFF THEORY 73K PROGRAMMED FOR NEXT LEG DOWNBased on analysis from multiple perspectives, not just Wyckoff theory, the chart strongly suggests that this is merely a pullback before continuing downward.

TONCOIN BUY !!!hello friends
Considering the heavy fall that we had, the price was able to maintain itself and with the specified support, we are going for the specified goals, of course, with risk and capital management...
*Trade safely with us*

SCRUSDT BullishSCRUSDT buy signal on daily Timeframe. 0.3 is the lowest price on this crypto, now bulls are ready to move higher. Potential TP is 28%

Short $BTC BINANCE:BTCUSDT failed to maintain above 100k after reached ATH few weeks ago .
Big boys took their profit and expecting the price could go lower around 69-71k range prices before continuing its uptrend movement
2 scenarios that i expect will be in play in this coming week
1. White arrow , price will move to the high liquidity area around 93k range price before dumping to 70k range price
2. Yellow arrow , price will dump straight to 70k price range before bouncing back at RBS area and continue its uptrend movement
-ZoroAsteron-
23/5 59/5

ZK Ready for next move up!TP 0.0881
SL 0.0694
Indicators are indicated that ZK is preparing for next impulse move!

BITCOIN HAS TO BREAK LONG TERM TREND by DEC - SQUEEZE APEX DECI have posted this before and I post it again now, just months away from a CRUCIAL point for Bitcoin PA
As with any time scale trading chart, An Apex is a point of reaction. PA usualy reacts BEFORE the Apex is met.
This Giant Apex is in DEC 2025
Every single ATH in the life span of Bitcoin has been rejected by the Arc of Resistance that is overhead.
We can also see how from the ATH in 2011, a trend line was formed that has acted as Support ever since 2012. PA has never dropped below this line.
So, as you can see, PA has been in a diminishing "Sandwich" and Now, we are coming to the Crunch
We can see how the ATH's have been a reducing % Rise ever since this point also.
And you will notice how this number on the chart reduces each time, even though the real value is increasing.
Low to ATH A ( ATH 2011) - 3,465,178%
Low to ATH B ( ATH 2013) - 49,670 %
Low to ATH C ( ATH 2017) - 9,865 %
Low to ATH D ( ATH 2021) - 2,148 %
E is not over yet but coing on current ATH we have
Low to ATH E ( ATH 2025) - 575 %
So, you see the reduction of % rise, held back all along by the ARC Of RESISTANCE
What is interesting, is that since PA has been in the chanel formed in 2011, when comapred to each other, we have been seeing a rise of 20% of the previous rise ( on average )
This closer chart shows you this in more detail
I will ignoew the A - B as thia is out of channel
C-B = 19.6 %
D-C = 21.77 %
Currently E-D = 26.7 %
As you can see, we are currently OVER that average % Rise.
And we are also heading into a tight APEX in Dec.
The expected 200K ATH this cycle will take us out of the pattern, out of the Apex and out of the 20 % average rise of previousl
This really is CRUNCH TIME for Bitcoin
The REALLY interesting thing is, What would be Next ?
This would break the Cycle routine.
We may already have broken that as described in previous charts of mine from years ago
But what IS Certain is that something HAS to happen.
This Cycle ATH will reveal a HUGE amount but we have yto Wait and see what will happen

TradeCityPro | Bitcoin Daily Analysis #42👋 Welcome to TradeCity Pro!
Let's delve into the analysis of Bitcoin and other key crypto indices. As usual, I will review the futures triggers for the New York session for you.
⏳ 1-Hour Timeframe
In the 1-hour timeframe, as you can see, the price still maintains a range box between 83808 and 84734, and the market volume has decreased even more from yesterday.
📊 The less the volume, the closer we are to a price movement, so again, keep an eye on the market to ensure you don't miss any active triggers.
⚡️ For a short position, you can enter with a break of 83808, and for a long position, with a break of 84734.
👑 BTC.D Analysis
Let's move to the analysis of Bitcoin dominance. Yesterday, the support at 61.43 was broken, and it's moving towards 61.08.
✔️ Currently, I don’t have any specific triggers for confirmation in dominance, but as long as the dominance stays below 61.43, I see it continuing its downward trend.
📅 Total2 Analysis
On to the analysis of Total2, the trigger at 1.05 is about to be activated, and the price could move towards 1.07 with a break of this area.
🔽 The short trigger remains at 1.04 for now.
📅 USDT.D Analysis
Finally, looking at the Tether dominance, this index is still ranging between 5.25 and 5.34.
💫 A break of either of these areas could determine the next leg of the price movement.
❌ Disclaimer ❌
Trading futures is highly risky and dangerous. If you're not an expert, these triggers may not be suitable for you. You should first learn risk and capital management. You can also use the educational content from this channel.
Finally, these triggers reflect my personal opinions on price action, and the market may move completely against this analysis. So, do your own research before opening any position.

Potenial inverse head and shoulders pattern for Bitcoin This is the scenario I’m believing in for the near term for BINANCE:BTCUSD .
One more leg down to confirm the neckline around 78,300 USD.
Quick reversal price action to retest the 92,300 USD (ish) level.
If the breakout takes place to the upside, then I think we will retest the previous highs, with a higher probability of going much higher. Although I believe the tariffs will have a big impact on the USD (DXY index), which I believe will have a strong effect on BTC for the near term, around the coming 6 months. So, I believe the new high will most likely come in Q4 this year, making this cycle different from the historic crypto cycles. Although, there is still a chance that other countries will start to adopt more crypto-friendly policies for crypto or Bitcoin, making this thesis more uncertain. If the policies come out as positive, then I think there are good chances of reaching new highs earlier than Q4, 2025.

Pi Network Bounce... The Pi Network's price has been experiencing significant fluctuations recently. After a sharp drop of over 20%, the price fell below $0.90, with resistance levels identified at $1.20 and $1.50-$1.80. If the price breaks below $0.80, it could decline further to $0.60.
However , some experts suggest that the Pi Network could rally back to $3, citing factors like potential exchange listings, merchant partnerships, and ecosystem advancements. The introduction of Pi-based domains and growing adoption might also contribute to its recovery.
The market sentiment remains mixed, with concerns about delays in the mainnet launch and exchange listings. If you're following Pi Network closely, it might be worth keeping an eye on these developments.
And one more thing, If Pi network will enter the ETF market...
If Pi Network were to enter the ETF market, it could potentially boost its price and credibility significantly. Analysts suggest that an ETF approval by the SEC could lead to increased inflows and validate Pi Network as a legitimate cryptocurrency. This move might also quell concerns about its legitimacy, as ETFs often attract institutional investors.
Pi Network's large market cap and liquidity make it a strong candidate for ETF consideration. However, no application for a Pi ETF has been made yet. If approved, it could lead to a surge in Pi's price, with some predictions suggesting it might even reach $100 in the long term.

BANANA/USDT with a 61.77% potential
BANANA/USDT (6H timeframe)
Current Price: 24.82 USDT
Recent High: 28.19 USDT
Resistance Level Highlighted: 34.28 USDT
Projected Target: Around 34.28 USDT (with a 61.77% potential increase of 13.08 points from current price)
+FVG (Fair Value Gaps):
Two bullish FVG zones are marked, indicating potential areas of interest where price may return for liquidity or support.
Expected Price Movement (Blue Line Path):
A slight retracement is anticipated toward the lower FVG zone (around 20–22 USDT).
After that, a bounce is expected, targeting the major resistance zone around 34.28 USDT.
A heart symbol marks this target area, possibly indicating strong bullish sentiment or a key zone to take profit.
Visual Markers:
Orange box at 34.28: Price target zone.
Vertical purple line: Measures the potential gain (13.08 points or 61.77% rise).

SHIBUSDT ShortSHIB consolidation on H4 chart. Now price at the resistance level and starts downtrend to retest support level.

From Rejection to Explosion: PI Breaks FreeThe price of PI/USDT has been moving within a well-defined falling channel, consistently facing rejection from the upper trendline and finding support at the lower boundary. Notably, the price has bounced multiple times from the falling support line, indicating it as a significant dynamic zone.
Recently, the price broke out of this descending channel with strong momentum, suggesting a potential trend reversal. The breakout candle is accompanied by high volatility, signaling bullish strength.
Additionally, the previous support zone, which turned into resistance, has now been reclaimed. This flip adds further bullish confirmation.

POPCAT ideaGreetings, fellow traders!
My analysis suggests a developing potential for a bullish move in POPCAT/USDT. I'm observing a possible breakout scenario, and I'll outline a potential long trade setup.
Entry Rationale:
A long entry is suggested above the $0.2135 level, contingent upon a confirmed breakout from the currently established neutral-bullish channel. This breakout would serve as confirmation of increasing bullish momentum.
Trade Setup:
Entry: Above $0.2135 (post-breakout confirmation)
Target 1: $0.2435
Target 2: $0.2650
Stop-Loss: $0.1910 (This provides a risk management level below a recent swing low, it's just an idea.)
Risk Management:
A stop-loss order placed around $0.1910 is recommended to mitigate potential losses should the trade move against the anticipated direction.
Disclaimer and Call to Action:
I welcome your constructive feedback and alternative perspectives on this analysis. Please conduct your own independent research and due diligence, including thorough risk assessment, before making any trading decisions. This analysis is for informational purposes only and does not constitute financial advice.
