short opportunity total market cap cryptosee chart for specific trade setup annotated with play and rationale
Cryptomarket

Bitcoin’s Final Surge? One Month Before the Post-Halving Drop!Bitcoin Halving Cycles: What History Tells Us About 2025
The Bitcoin halving is a highly anticipated event that occurs approximately every four years, reducing the block reward by 50% ⛏️. This supply shock has historically been a major catalyst for price movements. By analyzing previous cycles, we can attempt to forecast what might happen in the upcoming halving cycle of 2025.
Historical Performance of Bitcoin Halving Cycles
First Halving (2012)
365 Days Before Halving: 📈 +385%
365 Days After Halving: 🚀 +8069%
Peak-to-Trough Decline After Peak: 🔻 -76.98%
Second Halving (2016)
365 Days Before Halving: 📈 +142%
365 Days After Halving: 🚀 +284%
Peak-to-Trough Decline After Peak: 🔻 -82.88%
Third Halving (2020)
365 Days Before Halving: 📈 +17%
365 Days After Halving: 🚀 +559%
Peak-to-Trough Decline After Peak: 🔻 -75.64%
Current Cycle and 2025 Halving Expectations
- Last Halving Date: 📅 April 15, 2024
- 365 Days Before Halving: Bitcoin gained 📈 +130% from $28,827 (April 2023) to around $65,000.
- Projected 365 Days After Halving (April 2025): If history rhymes, we could see a price increase of around 📊 +72%, with a potential closure at the current Peak of $110,000.
- Post-Peak Decline Estimate: Previous post-halving peaks saw declines of 📉 75%–82%. With Bitcoin's all-time high around $110,000, a 🔻 75% drawdown would target a bottom of ~$30,000 before the next recovery cycle.
Key Takeaways
Bitcoin's price tends to rally leading up to the halving, but the largest gains historically occur in the year following the halving. 📊
Post-bull run drawdowns are severe with past declines ranging from 🔻 -75% to -82%.
While the Pre and Post-Halving theory suggests that the decline starts around 365 days after the halving, the full bear market typically unfolds between ⏳ 486 to 510 days post-halving. This aligns with the ⛓️ 70,000-block mark post-halving, as Bitcoin halvings occur approximately every 210,000 blocks. This means that while the peak may occur within a year after the halving, the deep bearish phase historically becomes evident around 1.3 to 1.4 years after the halving, reinforcing the long-term cyclical nature of Bitcoin’s market trends 🔄.
Final Thoughts
Bitcoin halving events are pivotal moments in the crypto market cycle 🔥. The data suggests that 2025 could see significant gains, but we should also be prepared for the inevitable correction that follows 📉.
What are your thoughts on the upcoming cycle? Share your insights in the comments!
Disclaimer
This article is for informational and educational purposes only and does not constitute financial, investment, or trading advice. The historical performance of Bitcoin halving cycles does not guarantee future results, and past trends may not necessarily repeat. Cryptocurrency markets are highly volatile, and investing in Bitcoin or any other asset carries risks, including the potential loss of capital.
Readers should conduct their own research, assess their risk tolerance, and consult with a licensed financial advisor before making any investment decisions. The information provided is based on publicly available data and historical observations, which may be subject to change.
Sources:
Nakamoto, S. (2008). Bitcoin: A Peer-to-Peer Electronic Cash System.
Bitcoin block time and halving data: Blockchain.com
Historical Bitcoin price data: CoinMarketCap
Bitcoin halving cycles and trends: Messari
Market performance metrics: Glassnode
By reading this article, you acknowledge that you are solely responsible for your own financial decisions and that the author assumes no liability for any losses incurred from trading or investing. 🚀

Bitcoin 50 SMA time snaps and Low to ATH since 2014 - UPDATEIn a similar vein to the chart posted earlier today about the patterns between the 50 and 100 SMA, this post is using the 50 SMA ( RED) and the time spent above and below PA.
Alongside this, we have the day counts for PA LOW to PA ATH since 2014
After 2013 ATH and once the 50 SMA dropped below PA, it spent 399 days below PA
After 2017 ATH and once the 50 SMA dropped below PA, it spent 329 days below PA
After 2021 ATH and once the 50 SMA dropped below PA, it spent 420 days below PA - This is an impressive stat as it includes the Deep Bear that we experienced after the Luna, 3 Arrows & FTX crashes, includes the raising of interest rates and the utter presecution by Banks and SEX in the USa.
The fact that the drop below PA was only extended by 35 days ( average) Max shows a strength in Bitcoin sentiment. It could NOT be broken
In 2015, once the 50 SMA has risen above PA, it remained there for 938 days
In 2019, once the 50 SMA has risen above PA, it remained there for 1001 days
In 2023, once the 50 SMA has risen above PA, we have been above for 756 days of an expected average projection of 966 days
This projects that PA will Drop Below the 50 SMA in about October 2015, After the ATH as previously.
This points towards an ATH in Q4 - this has some confluence with the previous post though open to suggestion.
Next is the simple PA LOW to ATH and Back to LOW day counts
2013 ATH to Cycle Low was 665 days then 847 days to Cycle ATH
2017 ATH to Cycle Low was 350 days then 1064 days to Cycle ATH
2021 ATH to Cycle Low was 378 days then, using the average of the two previous day Count from Low to ATH, gives us 952 days to Cycle ATH
This puts an ATH in JUNE 2025 !
I do not think this is realistic in anyway however, Anything is possible currently.
I do however think that June is about when PA could seriously begin to make Moves higher, with intent to reach a Cycle ATH.
The reason being, the weekly MACD will have reached Neutral by then ( if not in mid May )
So while this chart offers some confluence to other ideas, it also offers another ATH date that is way earlier than any previous cycle ATH - While I feel this is unlikely to happen, we Must keep open minds.. the adoption of BTC by main stream now may well accelerate the PA cycle.
We shall wait and find out.
Be prepared for ALL occasions....including the arrival of an early Bear. - THAT will be in another post, at some point soon
Stay safe

TON Go to $4.5?Durov was finally released, he returned to Dubai, and #TON perked up by +16% in a day.
That's it, now people will love the CRYPTOCAP:TON Ecosystem again, a bunch of new tapals will come out.
The key resistance level will be at $4.5
We can also go to $2.7
The break of the global triangle upwards may be in Seb-Oct
Correction time The TON Ecosystem was used wisely, they identified weak points, protected their market from Competitors with protectionism, mini apps in Telegram should only use TON, now Liquidity will accumulate more inside Telegram, and not go to Solana.
The game starts again)) and we are ready for it.

MAV/USDTHello friends
After a heavy fall, now with the trend line broken and the ceiling and floor hit higher, it is expected to move to the resistance area.
You can enter the capital with capital management.
*Trade safely with us*

TRB...Hello friends
According to the formation of a trading range, if the price manages to break through the price, the specified ranges can be a good support.
*Trade safely with us*

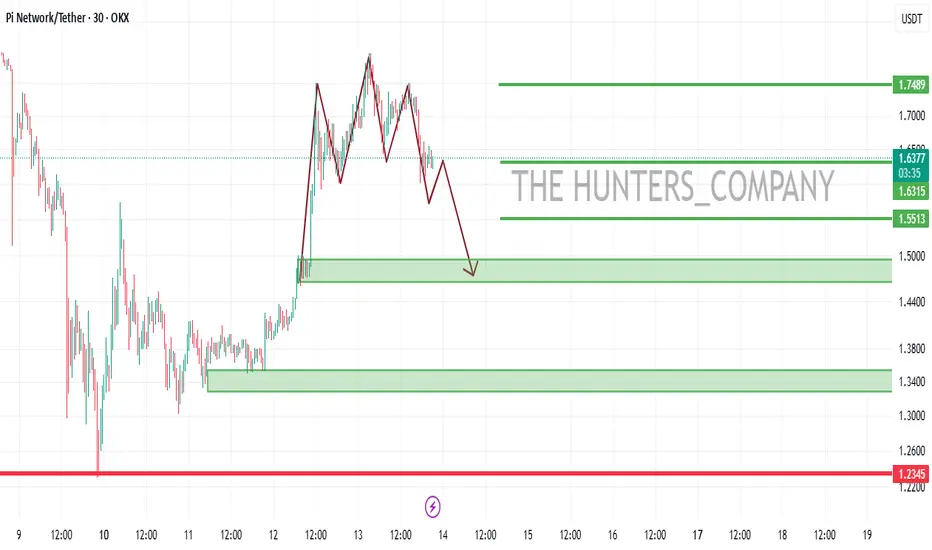
PI...Hello friends
Given the good growth we had, we now have the opportunity to buy in the pullback...
You can buy in steps within the limits we have specified for you with capital management...
*Trade safely with us*
Trading opportunity for WUSDTBased on technical factors there is a Buy position in :
📊 WUSDT
🔵 Buy Now
🪫Stop loss 0.0820
🔋Target 0.1090
📏 R/R 2,5
💸RISK : 1%
We hope it is profitable for you ❤️
Please support our activity with your likes👍 and comments📝

TradeCityPro | Bitcoin Daily Analysis #34👋 Welcome to TradeCityPro!
Let's dive into the analysis of Bitcoin and other important crypto indices. As usual, I want to review the New York session's futures triggers for you.
⚡️ Yesterday, one of our triggers was activated, which I will mention in this analysis.
⏳ 1-Hour Timeframe
As you can see in the 1-hour timeframe, yesterday's trigger at 83979 was activated, and the candle closed above this level. However, it seems like the upward momentum ended there, and the price gradually started to move downward.
💫 The decline was due to the falling dominance of Bitcoin, which failed to continue its upward movement as dominance dropped.
✨ Currently, the price has returned below the 83979 level, which appears to be a fake-out. If the price stabilizes below this level, there is an increased likelihood that it will retest the 80105 support. The primary support is still at 77598.
🔽 For a short position, with the activation of the fake-out trigger of 83979 in lower timeframes, you can enter a position. Other triggers like breaking 80105 may not occur today since it's Saturday and the market doesn't have enough volume to make significant moves.
📈 For long positions, keep in mind that there is a resistance area from 83979 to 84817. The price must break out of this range, so until a new structure is formed to give a precise resistance figure, the long trigger will be 84817.
👑 BTC.D Analysis
Let's move on to the analysis of Bitcoin dominance. As observed, dominance corrected to the 62 area yesterday and is now moving downward again.
🎲 Currently, the 61.53 zone is critical, and breaking this could lead Bitcoin's price towards 61.08.
✔️ I currently see the momentum of dominance as bearish, so if the market is giving long positions, I prefer to open them on altcoins.
📅 Total2 Analysis
Moving on to the Total2 analysis, yesterday's trigger at 1.01 was activated simultaneously with the break of 83979 in Bitcoin. Given the drop in Bitcoin dominance, altcoins moved higher and offered better positions.
📊 For today, the long trigger for Total2 is at the 1.04 area. As for short positions, since I see the Bitcoin dominance as declining, I prefer to open shorts on Bitcoin. However, you can also open short positions on altcoins with the Bitcoin trigger.
📅 USDT.D Analysis
Let's look at the USDT.D analysis. Yesterday's upward move in dominance was a fake-out, and it returned below 5.49 with a bearish momentum that broke the floor at 5.33 and stopped at 5.28.
⭐ Currently, a very small range box has formed from 5.28 to 5.33, and breaking any of these areas could define the next leg of dominance and its short-term trend.
❌ Disclaimer ❌
Trading futures is highly risky and dangerous. If you're not an expert, these triggers may not be suitable for you. You should first learn risk and capital management. You can also use the educational content from this channel.
Finally, these triggers reflect my personal opinions on price action, and the market may move completely against this analysis. So, do your own research before opening any position.

CAKE/USD: Ready for a Massive Breakout?Chart Analysis:
1. Timeframe and Price Context
Timeframe: Daily chart (each candlestick represents 1 day of trading).
Price Levels:
The current price is $15.486779, as indicated on the chart.
The price range on the chart spans from near $0 (early 2021) to a peak of approximately $47.862159 (late 2024), followed by a sharp correction to the current level.
Trend Overview:
2021-2023: CAKE starts near $0 and experiences a strong uptrend, likely driven by the growth of the Binance Smart Chain (BSC) and DeFi adoption, peaking around $40-$50 in 2021-2022, with some consolidation.
Late 2024: A significant rally pushes the price to $47.862159, followed by a sharp correction.
Early 2025: The price has stabilized around $15.486779, within the annotated "Buying Zone."
2. Key Patterns and Annotations
Post-Rally Correction:
After reaching a peak of $47.862159, CAKE experienced a steep decline (approximately 68% drop to $1.5486779), indicating a strong correction phase.
This correction likely reflects profit-taking or broader market pressure after the rally.
Buying Zone:
The chart labels a "Buying Zone" around the current price level of $15.486779, suggesting this is a perceived support area where accumulation by traders or whales might occur.
This zone aligns with a horizontal support level where the price has consolidated after the correction.
Breakout Prediction:
An upward arrow with the annotation "TG 4BS" suggests a bullish target, which I interpret as $48 (given the price scale and the prior peak of $47.862159). This would represent a ~210% increase from the current price of $1.5486779.
The target aligns with the prior all-time high, indicating a potential retest or breakout to new highs.
3. Support and Resistance Levels
Support:
The "Buying Zone" at $1.5486779 appears to be a strong support level, where the price has stabilized post-correction.
If this support breaks, the next significant level could be around $10-$12 (a psychological and historical support from 2023).
Resistance:
The immediate resistance is likely around $20-$25, a prior consolidation zone during the uptrend.
The $47.862159 level (recent high) is a major resistance, and the $48 target (as annotated) is the next key level to watch.
4. Volume and Momentum (Not Visible but Inferred)
Volume bars are not clearly visible, but typical behavior suggests:
Volume likely spiked during the rally to $47.862159 and decreased during the correction as selling pressure eased.
A breakout would require a volume surge to confirm, especially if the price moves toward $48.
Momentum indicators (e.g., RSI or MACD) could indicate whether CAKE is oversold or showing bullish divergence, supporting a reversal.
5. Potential Scenarios
Bullish Breakout:
If CAKE breaks above the $20-$25 resistance with strong volume, it could confirm a bullish trend, targeting the $48 level.
The "Buying Zone" at $1.5486779 suggests accumulation, which could fuel a rally if buying pressure increases. This would align with a ~210% move, consistent with prior bullish cycles in DeFi tokens.
Bearish Breakdown:
If the price fails to hold the $1.5486779 support and breaks below, it could signal further downside.
The next support at $10-$12 could be tested, potentially leading to a deeper correction.
Consolidation:
If the price remains within the "Buying Zone" (around $15-$18), it might continue to consolidate until a catalyst (e.g., BSC ecosystem growth, market rally) triggers a move.
6. Market Context
DeFi and BSC Influence: CAKE, as the governance token of PancakeSwap (a leading DEX on BSC), is influenced by DeFi adoption, BSC network activity, and broader crypto market trends (e.g., Bitcoin and Ethereum performance from your previous charts).
Whale Activity: The "Buying Zone" annotation suggests whales or smart money might be accumulating at this level, similar to your earlier analyses of Ethereum, UNISWAP, Bitcoin, and Dogecoin. This could set the stage for a breakout.
Timing: On a daily timeframe, a breakout could occur within weeks to months, depending on market conditions and catalysts.

Falling wedge found on Daily TimeframeYou're absolutely right, the falling wedge pattern often suggests a potential breakout to the upside, but it's important to be cautious. That "bleed off" to around 70k could still be part of a larger consolidation before a big move. If we break down out of the wedge, it would definitely signal more bearish market sentiment, especially considering the broader macro risks you're highlighting like geopolitical instability, health crises, and climate concerns.
It's a bit of a nerve-wracking but exciting situation, especially with the unpredictable nature of markets these days. How are you thinking of positioning yourself in this scenario? Holding out for the breakout, or preparing for the downside risk as well?

TradeCityPro | NEAR: Breaking Boundaries in Layer 1 AI Crypto👋 Welcome to TradeCityPro!
Today's analysis will focus on NEAR, a Layer 1 and AI crypto project with a market cap of $3.17 billion, ranking 31st on CoinMarketCap.
📅 Weekly Timeframe
In the weekly timeframe, as you can see, following an upward leg from $0.993 to $8.298, a range box formed over a year from $3.615 to $8.298. Recently, with the market's downturn, the price finally broke below this box's floor at $3.615.
✅ Currently, the price has pulled back to this area after breaking $3.615 and has dropped to $2.574, where it's currently forming a supportive green candle.
⚡️ The $2.574 area is robust, showing positive price response, and it remains to be seen what happens next. If this support breaks, the price could move towards lower areas like $1.830 and $0.993.
🔑 Conversely, if the price can sustain this support and move above $3.615, a significant upward momentum could enter the market, potentially driving the price at least up to $8.298. A break above $8.298 could see the next target at $16.839.
📊 Market volume has increased following the range break, which is natural as the price has finally moved out of a range, and increased volume has entered. Continuation of this volume increase could heighten the likelihood of breaking $2.574.
📅 Daily Timeframe
In the daily timeframe, we can observe more detailed price movements.
💫 As seen, the main support at $3.615 has broken, and subsequently, a price box formed between $2.804 and $3.615. Coinciding with an RSI divergence, the floor at $2.804 broke, and the price dropped to $2.161.
🎲 Currently, the price is correcting back towards the $2.804 area. Market volume is rising, and the RSI divergence trigger has not yet been activated, indicating ongoing bearish momentum.
💥 If the RSI breaks the 50 area, the divergence could impact the market and eliminate the bearish momentum. This would be the first sign of a trend change, but the main ceiling at $3.615 must be broken to confirm a trend reversal.
📉 For short positions, breaking the $2.161 area is suitable, and if this area breaks, the price could drop to $1.682. For long positions, breaking $2.804 is a risky trigger, with the main trigger at $3.615 for a more solid position.
📝 Final Thoughts
This analysis reflects our opinions and is not financial advice.
Share your thoughts in the comments, and don’t forget to share this analysis with your friends! ❤️

SOLANA; Heikin Ashi Trade IdeaBINANCE:SOLUSD
In this video, I’ll be sharing my analysis of SOLUSD, using my unique Heikin Ashi strategy. I’ll walk you through the reasoning behind my trade setup and highlight key areas where I’m anticipating potential opportunities.
I’m always happy to receive any feedback.
Like, share and comment! ❤️
Thank you for watching my videos! 🙏

DEBRIDGE Breaks Trendline – Is a Major Move Coming?BYBIT:DBRUSDT 12H chart shows a breakout above the descending trendline, indicating a potential shift in market structure. The price is currently facing the nearest resistance zone, which has acted as a key level in previous price actions.
A short-term correction from this level is likely before another major move upward. The major resistance zone above could act as the next target if the price successfully holds above this breakout level
DYOR, NFA

The bulls have left the building—time for the bears to party.PENDLE currently at strong support zone on weekly timeframe.
Break of this support could trigger a massive fall downwards. Chart is self explanatory.
Note: This is not Buy/Sell Recommendation. DYOR always & always.

My take on XRP for Vecino Peache.XRP is currently testing the 50 EMA on the daily time frame, a strong resistance level. Throughout February, it made multiple attempts to break above but failed. This suggests a possible correction. A confirmed break below the 200 EMA on the daily chart would further validate this bearish outlook.
My take; I have an OTZ (Optimal Trade Zone) on the 4-hour time frame, which acts as a strong support level. If price breaks below this zone, it signals a potential shift in market direction. As long as XRP respects this support, I will trade it conservatively.
Let me know what are your thoughts on my take.

BTCUSD, Are we going to face 35% Correction ?!If we take a look at previous 2 notable cycles we easily notice similarities.
From these 2, 2022-2024 looks more similar to 2016-2017, as long as we had -
Breakout of downtrend line. ✅
Reaccumulation zone. ✅
Testing major bear market impulse (Which in all cases became strong resistance). ✅
What we didn't experience is correction after these 3 moves.
In 2016 it was around 40% (Tested reaccumulation zone)
In 2019 it was around 53% (Tested major support / resistance zone).
As long as current market structure somewhat repeats 2016 move, have possibility to retest top of after trend line breakout reaccumulation zone, which sits around 33-32k.
Percentage wise it's around 35% from ETF top and 23% from current price.
What you think ?

Tether Dominance, Weekly OutlookAs we see USDT.D Bounced from long formed Support / Resistance zone, while tested it with long wicks several times.
- RSI Divergence
- Bounced From Support
- Below 21 Week EMA

XLMUSDT - JUST ANOTHER IDEA OKAY!Crypto trends been down for awhile after all those uptrend euphoria failed badly..
The more you see those influencers on youtube hyping some coins, of course it crashed at some points, after all that is what those big power institutes wanted to suck all the money inflow, and especially they killed off people who wanna get rich quick who went for high leverage trades.. even with just 2X you will get liquidized with 50% drop for altcoins..
So enough said, if another crash is expected, probably it s going to be the bottom,.. so we can expect great recovery.. I am not an expert, but as XLM being down beautifully as it seems like a flag pattern, so we can expect rebound for XLM some where @0.191.. and expecting higher-high at bigger time frame..
How high? for now no body knows..
So, trade wisely and don't forget your stoploss..
Have a nice day & Happy trading guys!~

$2000 is now a critical zone for Ethereum$2000 is now a critical zone for Ethereum.
The market has been bearish and still bearish.
These are the areas.
$1600 and ascending trendline are the resistance zone I am looking
$1600, $1400 and $886 are some key support zone to watch out for is this bleeding continues
NOTE:
The market has presented a great opportunity for investors who have the capacity to hold for long. If you are one, keep accummulating.

Bitcoin is ABSOLUTELY under Pressure - It MUST react before DECI have been looking at this in detail for some time and have decided to change how I calculate things and here is the result.
There are 2 things of Massive importance to see here.
First is that Curve that PA has been under since 2010
The Lower Dashed Line is the Trend line formed in 2011. It is Strong and it is Valid and PA is currently running along it.
Here is a closer image to show you where we are in relation to it right now. Directly below PA currently, we hit that line around 67K
The Apex of this "Triangle" is December THIS YEAR
PA Has to break Above that Arc, the same Arc that has Rejected PA EVERY TIME since 2011
BUT THIS TIME IS DIFFERENT - IT HAS TO BE and here is why
I am not going to explain the % increase each Cycle Low to ATH, it is in the chart but I do want to show you this,
The first real push of Bitcoin was a massive % rise that created the ATH that formed the 1st point of the Lower Trend line of the New channel. This is A on the chart
The Next push was to B. This push was 1.433% of the Original push A - smaller by a long way in % terms.
These 2 moves created the channel that PA has remained in ever since. ( see dashed upper trend line)
From this point on, we can see that each cycle push , while in channel, has been approx 20% of the previous rise. Or around 1/5 of the size in % terms
Or to put is another way, Each Rise has been a diminishing % rise from previous.
Look at that curve. It has pushed PA down each cycle ATH
This cycle, we are currently at 26.7% of the previous push ( to 2021 ATH ) and it has created a cycle ATH currently.
But is the cycle Over ? - Hopefully NOT
Because if it is NOT over, we need to break through that Curve of resistance by December.
The Much expected 200K ATH is way over that curve and would result in a 55% of previous push rise. That would break the "trend"
This is VERY Different. But Absolutely required.
So, the question that should be on Everyone's lips is "Which is stronger ? The line or the Arc ?"
My expectation is that we will break through. That Arc has been a Major part of the formative years of Bitcoin PA but now, it could prove detrimental. Because, if we do not break through it, It will push Peice DOWN, through that line of Long term support.
We do not want that
SO, Maybe THIS is why the Bulls are waiting for the Weekly MACD to reset to Neutral...PA Needs the strength to break through.
So, Go Buy your Local BULL a Beer ( or white wine lol ) and Lets get on.
Watch this Close. It really is more important that Trumps Reserve, Saylors Love nest or Bezos after burners.................

ETH/USDT – Is Momentum Heating Up?I’m spotting a bullish structure on the ETH/USDT 15-minute chart, with the price moving within an ascending channel near the $1,900 support zone. If the bullish momentum holds, I’m looking at a potential target around $2,050–$2,100, with a reasonable risk–reward ratio.
What are your thoughts? Are we headed to the moon, or do you foresee another pullback before further upside? Feel free to share your alternative scenarios and the rationale behind them. Good luck and happy trading!

XRP Approaches Critical Support at $2.00Key Technical Level:
XRP is testing the strong $2.00 support level, which has consistently acted as a key price floor since December.
Descending Triangle Formation:
The price action is forming a descending triangle, where decreasing volatility suggests an imminent breakout. This pattern emerges as XRP approaches the intersection of descending resistance and horizontal support.
Bullish or Bearish?
A confirmed breakout above resistance could trigger a strong rally.
A sustained drop below $2.00 would invalidate the bullish outlook, potentially leading to a retracement toward $1.60-$1.80.
Market Perspective:
XRP’s rally from $0.60 to over $3.40 since November suggests that the current correction is likely a phase of profit-taking rather than a full trend reversal. However, traders should remain cautious and watch for confirmation of direction.
Stay alert—XRP is at a decisive moment! 🚀📉
#XRP #Crypto #MarketAnalysis #Trading #TechnicalAnalysis #Cryptocurrency #Bullish #SupportLevel
