RNDR Trade Setup – Double Bottom & Support ReclaimRender (RNDR) has shown strong resilience by forming a double bottom and reclaiming the key $4 level, signaling potential strength. We’re now watching for a sweep into downside liquidity (sub-$4 wick), with a daily close still holding above $4—this would confirm a strong long opportunity.
🔹 Entry Zone:
$3.50 to $4.00
🎯 Take Profit Targets:
🥇 $5.64
🥈 $6.70
🛑 Stop Loss:
Daily close below $3.00
Cryptomarket

Pullback's Almost Over — Get In Before It RunsThe best time to enter in a bull market is during a pullback — when price temporarily retraces before continuing its upward trend.
In the case of BINANCE:SUPERUSDT , price is currently pulling back into a demand zone between 0.7178 – 0.7109. The overall structure remains bullish, with the blue arrows showing a series of higher lows and the red arrows indicating higher highs.
We expect the price to bounce from this demand zone and potentially break the previous high, continuing the bullish trend.
To confirm the pullback is ending and a reversal is underway, we’ll watch for candlestick patterns. Here are two possible bullish confirmation scenarios:
Price breaks and closes above the high of the last red candle — a bullish engulfing setup.
Price dips deeper into the demand zone, then forms a bullish pattern such as:
Bullish Engulfing
Bullish Harami
Other reversal signals, like a close above the high of the previous two candles.
These are the scenarios I’m watching for on $SUPERUSDT.
Let me know your thoughts!

Buying XRP Ripple long XRPUSDt Bias Trade! The Breakdown inside!Again we have a 🟢SeekingPips🟢 plan where ⏳️ TIME was the MAIN factor in the SUCCESSFUL OUTCOME of our TRADE PLAN.🚀
If you've been following 🟢SeekingPips🟢 for sometime already you will know that we ALWAYS FAVOUR 🕝TIME🕖 OVER PRICE.
🔥I would even go as far and say that PRICE comes a DISTANT 3rd place when compared to TIME & VOLUME.🤔
BUT WHY❓️
That is a Vvveeerrryyyy LONG STORY that will require it's very own very long CHAPTER when 🟢SeekingPips🟢 Finally gets around to the eagerly awaited super blog so stay tuned....
Having seen that the GREY ZONE identified as 🟢 SeekingPips 🟢 Bull & Bear Bias level worked very well, you can also see that the first level of resistance identified came in at the orange level at 2.3615 whilst the printed high up until now came in at 2.3630 (Accuracy👌)
48hrs was also our minimum time window for the grey zone to present some kind of trade opportunity which it did perfectly. ( It's MATH not MAGIC honestly😉)
Note the 🔵 BLUE ARROW LOW 🔵 significant swing point created before 🌍SeekingPips trade analysis signal and just below our GREY BIAS ZONE remained unvisited👌.
Wether or not you entered a bullish trade at MARKET PRICE at time of post ( I always suggest you use your own entry signal ) OR waited for a LIQUIDITY SWEEP at those local lows for the BUYERS to easily pair with at the 🟢GREEN ARROW🟢 you would have enjoyed anything from a 3.2 - 5.2 REWARD TO RISK TRADE by the time our FIRST HIGHLIGHTED zone of RESISTANCE was hit which came into play at the
2.3615 level 🔴RED ARROW🔴.
The 🟣PURPLE/MAGENTA🟣 arrow added CONFLUENCE to the BULLISH BIAS TOO .
🚥Stay tunned for MORE TRADE ANALYSIS as the week progresses.🚥

BUY PEPE ...Hello friends✌
As you can see in the picture, we have specified a purchase range for you to buy in stages, of course with capital and risk management.
🙏If you like it, support it with a ✔like✔ and ✔comment✔.
*Trade safely with us*

XRP ETF ...Hello friends✌
As you can see in the picture, we have specified a purchase range for you to buy in stages, of course with capital and risk management.
🙏If you like it, support it with a ✔like✔ and ✔comment✔.
*Trade safely with us*

BITCOIN BUY !!!Hello friends✌
As you can see in the picture, we have specified a purchase range for you to buy in stages, of course with capital and risk management.
🙏If you like it, support it with a ✔like✔ and ✔comment✔.
*Trade safely with us*

TradeCityPro | Bitcoin Daily Analysis #76👋 Welcome to TradeCity Pro!
Let’s dive into the Bitcoin analysis and key crypto indices. As usual, in this analysis I’ll review the futures triggers for the New York session.
⚡️ Not much has changed since yesterday, so without reviewing the previous analysis, let’s get into today’s setup to see what positions we can open.
⏳ 1-Hour Timeframe
As you can see on the 1-hour timeframe, the price is still within its range box. Even though yesterday it tested the lower range once and we expected a breakout to the upside, that didn’t happen, and the price was rejected from the 95370 resistance and continued to range.
✔️ After the rejection from this level, volume began to decline, which is a good sign. The lower the volume gets, the sharper the breakout move from the box is likely to be.
💥 If 95370 is broken, I definitely recommend having an open position, as the risk of hitting the stop loss is worth the potential gain. The target in case of a breakout will be the 98828 resistance.
⭐ The SMA99 is also providing good support and is currently sitting below the candles, which adds to the positive bias for this scenario.
🎲 If the price gets rejected from the resistance again, we’ll likely see more range-bound action today. But due to the strong bullish momentum, I don’t think the price will lose its support levels, and it’s likely to test 95370 again.
💫 That said, if I observe structural changes and see support levels like 91945 breaking, I’ll also be ready to take short positions.
🔽 However, for shorting, I think we should wait for more structure to form. Once the price shows more reaction to the 93626–95370 range box, and if 93626 breaks, we can enter a short. But right now, I’d personally wait for a break of 91945 before going short.
👑 BTC.D Analysis
Moving on to Bitcoin dominance, the range box is still intact, and price is above the 64.22 level. If Bitcoin breaks the 95370 resistance and BTC.D continues to rise without breaking below 64.22, then Bitcoin will outperform altcoins. If 64.41 is broken, we can expect a sharp bullish move in Bitcoin.
📊 To enter positions on altcoins, the best confirmation remains the break of the 64.22 level on BTC.D.
📅 Total2 Analysis
As for Total2, the 1.05 resistance still hasn’t been broken. To confirm the beginning of a bullish move in altcoins, we need a breakout of this level. The first target of this move would be the 1.07 resistance.
📉 To turn bearish, the first trigger is at 1.03. We’ll need to wait for the price to test it, so we can determine the precise level and react accordingly in future retests and breakouts.
📅 USDT.D Analysis
USDT.D behaves slightly differently from Bitcoin and Total2. While Bitcoin and Total2 are both near resistance and poised for a breakout, USDT.D is still some distance from the 4.99 support.
☘️ The probability of this support break coinciding exactly with Bitcoin and altcoin triggers is low. However, I believe this is a more significant trigger than Total2’s.
❌ Disclaimer ❌
Trading futures is highly risky and dangerous. If you're not an expert, these triggers may not be suitable for you. You should first learn risk and capital management. You can also use the educational content from this channel.
Finally, these triggers reflect my personal opinions on price action, and the market may move completely against this analysis. So, do your own research before opening any position.

LINK/USDT 1H Chart Update Chainlink is riding a strong Rising Channel!
Price action shows clear patternson LINKUSDT
▸ Bullish Doritos at $12.00 & $13.00, pushing the price higher.
▸ Reverse Doritos at $13.00 & $15.00, leading to pullbacks inside Rising Channel.
▸ Key levels to watch: $14.00 (support) and $17.00 (upper resistance).
✉️ As long as LINK stays in the channel, the bulls are in control! Will we see a breakout to $17.00 soon? Let’s discuss!

XRP Nears Triangle Apex: Breakout to $2.30 Incoming?XRPUSDT is heating up! Approaching apex of the Triangle!
Will we see a breakout to $2.30? Or possibly to $2.03!
Check the 1H chart & watch the breakout!

TradeCityPro | RENDER: AI Token at Breakout or Breakdown Point👋 Welcome to TradeCity Pro!
In this analysis, I want to review the RENDER coin for you. This project is one of the crypto AI projects that gained a lot of hype after AI projects started trending.
🔍 The coin of this project currently has a market cap of $2.36 billion and ranks 45th on CoinMarketCap. Let’s move on to the analysis to see the technical condition of this coin.
📅 Daily Timeframe
As you can see in the daily timeframe, after the drop shown in the chart, with the price falling to the 2.774 area, a ranging structure has formed, and the top of this box is at the 4.52 level.
⭐ Currently, the price has reached the top of the box and is interacting with this level. If the box top is broken, the main bullish trend can begin, and the price may move toward the 6.682 area.
🎲 If this happens, pay attention to the volume, because the volume should increase alongside the price movement and be in convergence. If a large buying volume enters the market, the probability of this scenario increases.
📈 So for spot buying or opening a long position, you can enter on the breakout of 4.520.
🔽 To confirm the market turning bearish, we need to confirm the end of the current bullish leg. If the price gets rejected from the box top or if a fake breakout happens, a break of 4.119 confirms the rejection, and in that case, the price can move back down to the box bottom.
💥 The support levels ahead for the price are 3.513 and 2.774, which can be used as targets for short positions.
📊 The main trigger for the beginning of the next bearish leg is the 2.774 area. If this level is broken, the price will likely make a sharp downward move.
📝 Final Thoughts
This analysis reflects our opinions and is not financial advice.
Share your thoughts in the comments, and don’t forget to share this analysis with your friends! ❤️

DOT/USDT 1H Chart UpdateDOTUSDT broke its Long-Term Resistance last week!
After consolidating in a Redistribution phase (similar to mid-April), Polkadot is now testing the $4.00 support zone.
▸ Bullish Target: If $4.00 holds, we could see a climb to $4.50 or higher!
▸ Bearish Risk: A breakdown below $4.00 might push the price to $3.90 or lower.
Eyes on $4.00 — will the bulls defend this level? Let’s talk!

BTCUSDTHello Traders! 👋
What are your thoughts on BITCOIN?
Bitcoin has reclaimed the $90K– GETTEX:92K zone after a sharp 32% correction from its all-time high, closing the week strongly above this critical area.
As long as price holds above $90,000, the primary bias remains bullish. The $90K– GETTEX:92K area now acts as a key support zone, ideal for pullback buying opportunities.
A breakout above $101,000 could trigger a strong acceleration toward the next major targets at $115K–$125K.
A weekly close below the green support zone would invalidate the bullish scenario and suggest caution.
What’s your outlook? Will Bitcoin maintain momentum and break $101K? Share your thoughts below!
Don’t forget to like and share your thoughts in the comments! ❤️

BTC/USDT Technical Analysis. Current Price: ~$94,600
BTC has cleanly broken above the descending trendline resistance, a structure that capped price since mid-February.
This breakout was accompanied by a surge in volume and momentum — a strong bullish sign.
Golden Cross Area
A key technical confluence occurred where the 50-day MA (red) and the 200-day MA (green) were tested simultaneously, marked by the blue circle.
Price moved sharply upward after reclaiming both MAs, suggesting increased buying confidence — a textbook golden cross behavior, even if not a perfect cross yet.
Support & Resistance Flip
Previous resistance at the GETTEX:92K —$93K zone (highlighted in yellow) has now become support.
As long as BTC holds this zone, it suggests healthy consolidation and potential for a continued move up.
Trend Indicators:
50-Day MA (Red): Now curving upward — short-term bullish momentum is building.
200-Day MA (Green): Flattening and starting to rise, showing early signs of a shift in long-term trend direction.
The price is currently above both MAs, which is a key bullish condition.
Key Levels to Watch:
Immediate Resistance: $96,000–$97,500
Major Psychological Barrier: $100,000
Support Zone: $91,500–$92,500
Stronger Support (if broken): $84,000–$85,000 near the MAs
If the price continues to hold above the breakout zone and consolidates well, the next upside target will be $ 100 K.
Failing to hold the GETTEX:92K zone could invite a pullback toward the MAs around $85K — a zone where bulls may step in again.
Final Thoughts:
BTC is showing signs of renewed bullish momentum after breaking key resistance and reclaiming critical MAs. However, confirmation through consolidation and volume is essential to sustain higher levels.
Structure remains bullish unless we see a breakdown below ~$85K with volume.
DYOR. NFA. Stay sharp.

Litecoin (LTC) - Long Setup📋 Context:
🔵 Open Interest stable or slightly increasing → healthy position building.
🔵 Top Traders Ratio strongly rebounding → top traders are re-accumulating long positions.
🔵 CVD Spot rising → real spot buying support is coming back.
🔵 CVD Futures rebounding → shorts being squeezed and absorbed.
🔵 Funding Rate neutral → no immediate risk of short squeeze against longs.
🔥 Liquidations:
🔵 95% of potential liquidations are shorts → strong imbalance to exploit.
🔵 Optical Map shows a wall of short liquidations just above the current price → objective is to grab them.
📈 Technical Structure:
🔵 Clean bullish structure on the 15-minute timeframe.
🔵 Stop Loss placed just below the recent swing low.
🎯 Trade Plan
Entry: Current price zone 85.7
Immediate Target (TP1): 87 $ → grabbing short liquidations.
Extension Target (TP2): 88 $ → if momentum remains strong.
Stop Loss (SL): Below 84 $ → invalidation if clean break of structure.

Aptos, Bottom Pattern: Growth Now Imminent —Alert!It does not matter the pattern shape or what name we give it; after it forms, we know the next thing that happens is growth. When a bottom pattern forms, it is followed by a period of growth. Some growth periods are bigger than others but it is always growth.
The last bottom pattern happened between mid- to late 2024 and it preceded a small sized bullish wave. The bottom pattern, accumulation zone or consolidation period, lasted some 90 days (3 months).
This time around is exactly the same. I am seeing drawings on the charts made by the candles that are exactly the same as 7 years ago. It is amazing. The exact same dynamics, always... It is so easy to spot a true bottom when the market is trading low.
Ok. Current bottom formation is some 85 days old. The same thing as before. The shape doesn't matter nor the name. There was a bullish wave that ended in the current situation, an accumulation zone or consolidation period, and this will be followed by a bull market. So this case is different to the previous one. 2024 was still part of the transition, 2025 is the bull market year.
The only reason we can know these things is because of experience and the charts.
Without experience, it is really hard to make sense of what is going and to understand the market.
Sometimes I detach for several months and I when I comeback I start from zero and wow, I understand why people become anxious when I am not publishing these charts. It is just hard to read, how to understand. If someone like me is doing this work daily, a bigger picture of the market develops, a broader perspective develops and you can grasp easily, understand what is happening and you can also hold easy long-term.
Just watch. I will show you by disappearing for a few days or weeks when the market shakes. Even though I've been sharing the bigger picture you'll see how your mind becomes clouded... It is just hard when we don't know what to look for. That will be a lesson for another day.
Today, I am revealing everything the market will do before it does it.
Thanks a lot for your continued support.
» Aptos is about to enter a strong bullish wave. 100% certainty level.
Thank you for reading.
Namaste.

Bitcoin surpasses Google: Why BTC rallied to $94,000In April 2025, Bitcoin once again captured the spotlight by breaking above $94,000, reaching a market capitalization of $1.86 trillion. This surge pushed BTC ahead of Alphabet (Google’s parent company), making it the fifth-largest asset in the world.
The impressive rally in Bitcoin this year has been fueled by a combination of macroeconomic factors and developments within the crypto space itself. New financial instruments, political shifts, and technological advancements have made Bitcoin more appealing and accessible to a wide range of investors.
5 key drivers behind Bitcoin’s growth in 2025:
1. Approval of spot Bitcoin ETFs in the U.S.: For the first time, the SEC greenlit spot Bitcoin ETFs, allowing major institutional players to gain exposure through regulated investment products. This triggered a significant inflow of capital into the crypto market.
2. Weakening dollar and stock market declines: As global economic growth slowed and the U.S. dollar lost ground, Bitcoin emerged as a hedge asset — often compared to gold — with investors seeking safer alternatives to traditional markets.
3. Pro-crypto political climate in the U.S.: The new U.S. administration has adopted a supportive stance on crypto, easing regulations and even announcing plans to build national crypto reserves. This strengthened investor confidence across the market.
4. Bitcoin’s growing role as ‘Digital Gold’: The perception of Bitcoin as a long-term store of value continues to rise. More large investors and corporations are now including BTC in their asset diversification strategies.
5. Technological advancements: The rollout of second-layer solutions like the Lightning Network has made Bitcoin transactions faster and cheaper. This has improved real-world usability and expanded the global user base.
In 2025, Bitcoin continues to gain momentum, breaking new records and cementing its role as one of the world’s most important financial assets. The combination of spot ETF approvals, political backing, macroeconomic shifts, and ongoing tech innovation has created fertile ground for its growth. With each passing day, BTC becomes increasingly attractive to both institutional and retail investors — setting the stage for further gains in the coming years.
Still, Bitcoin’s future will depend on how crypto regulations evolve, the pace of technological breakthroughs, and global economic conditions.

Bitcoin - All Time Highs Are Inevitable!Bitcoin ( CRYPTO:BTCUSD ) is still massively bullish:
Click chart above to see the detailed analysis👆🏻
Despite the correction of about -30% which we have been seeing lately, Bitcoin remains in a bullish market. Even if we see another drop of about -20%, this will still just turn into a textbook bullish break and retest and either way, new all time highs will follow on Bitcoin.
Levels to watch: $70.000, $400.000
Keep your long term vision,
Philip (BasicTrading)

Solana - Here Comes The Bullish Reversal!Solana ( CRYPTO:SOLUSD ) might head for new all time highs:
Click chart above to see the detailed analysis👆🏻
Just a couple of months ago, Solana perfectly retested the previous all time high and created an expected short term rejection. However, with the current major support area and a potential bullish reversal, Solana remains in a strong market, potentially heading for new all time highs.
Levels to watch: $120, $250
Keep your long term vision,
Philip (BasicTrading)

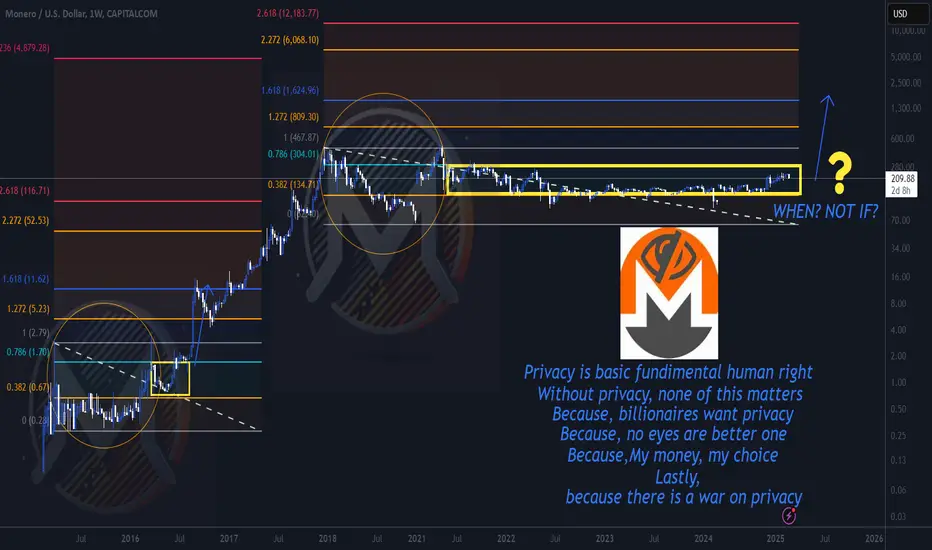
Privacy matters, and it will cost you in the futureGood day Investor and traders,
When the criminals run show, they definitely don't want you to know it.
Privacy is a double edged sword. However, just because criminals use it doesn't mean it should shunned upon. Criminals also wear clothes and use curtains. Both are fashion statement second, but serve as privacy first. Enough of my opinion, the chart speaks for its self.
Other than my additions, this is a naked chart of XRM on the weekly. It shows a very distinct patterns of how it moves.
XMR is another coin that was in my thesis from a couple years back in the bear market of 2022 that was the "lengthening or alternating" altcoin cycles. Another cycle that looks like it want to repeat, just much more drawn out. I do believe it will repeat, it might take 10-20 years or so to do so. The next big phase of privacy might have to have people getting a taste of CBDC or UBI, before they realize how much it will, or most likely could infringe upon their privacy. The chart shows early investors already knew this. Look at that move from 2016 to 2017 25 cents to $480 dollars. WOW, that rivaled XRP's big move!!! The key pattern here is the initial move then the big correction, the retest (double top) and how it moves with the fib levels. I have highlighted this in the chart with the Monero XMR logo and and a circle then with the yellow rectangle. Its the same pattern just waaaay drawn out. So, after this double top M then correction, marks the key before price explosion. IMO, I don't think it's and "IF" it happens, but "WHEN" it happens. These types patterns are what sparked my original thesis on these coins. IMO there is a reason other than just profits, early investor recognized the eventual use case, just like in Bitcoin.
Let me know what you think in the comments.
Kind regards,
WeAreSat0shi
SUI UPDATEHello friends✌
As you can see, after a price drop, buyers were able to break the downtrend and form an ascending channel, which, given the entry of buyers, we can buy in batches with capital and risk management to move towards the specified goals.
*Trade safely with us*

AR/USDT : FREE SIGNALHello friends✌
You see that after the price growth we had, we entered a correction, which provided us with a good opportunity to buy📈
We have identified the buying levels and targets for you to buy...
Don't forget capital management, friends.
*Trade safely with us*

BTC Breaks Out Above Key Resistance Bullish Momentum AcceleratesClassic Technical Breakout:
Bitcoin has surged past the critical $91,607 resistance level, which had capped its upside since February. This breakout marks a major shift in market momentum.
Broader Bullish Structure:
The move confirms a larger bullish structure, defined by a consistent pattern of higher lows and higher highs since the March lows, signaling strong market health.
Accumulation Zone Cleared:
Bitcoin’s breakout from the well-established $76,000–$92,000 accumulation zone further strengthens the bullish outlook, highlighting robust underlying demand.
Road to Six Figures:
Now trading above key psychological and technical levels, Bitcoin appears poised for a potential move toward six figures and a retest of all-time highs above $108,000 — as long as it holds above the breakout zone.
Conclusion:
Momentum is clearly favoring the bulls. Bitcoin’s breakout could mark the beginning of its next major rally phase. 🚀📈
#Bitcoin #BTC #Crypto #Breakout #TechnicalAnalysis #Bullish #Resistance #CryptoMarket #MarketUpdate

Visa-Ripple Partnership Could Spark a Significan from Trenovia GThe financial world is undergoing a period of active transformation, and one of the most talked-about developments is the potential partnership between Visa and Ripple. According to a new analytical report by Trenovia Group, such a strategic collaboration could act as a catalyst for a substantial rise in Visa's stock value in the coming months.
Key Growth Drivers
Trenovia Group analysts emphasize that integrating Ripple’s technologies into Visa’s ecosystem would dramatically enhance the speed and reduce the cost of international transactions. RippleNet, built on blockchain technology, offers unique advantages: near-instant settlements, greater transparency, and lower fees compared to traditional interbank systems.
Partnering with Ripple would provide Visa with a powerful technological upgrade, reinforcing its dominance in the payment solutions market, particularly in cross-border transfers.
Expected Market Reaction
According to Trenovia Group, even the announcement of such a partnership could trigger a strong positive reaction from investors. In an increasingly competitive payments landscape, adopting blockchain innovations would be seen as a forward-looking move, enhancing Visa’s market appeal.
Technical analysis also points to favorable conditions: Visa shares are maintaining solid support around $260, and the formation of a "bullish flag" pattern suggests the potential for a breakout following positive news.
Strategic Importance of the Alliance
Trenovia Group highlights the long-term strategic benefits of this union. As digital currencies and decentralized payment systems gain traction, the integration of blockchain-based solutions would ensure Visa’s adaptability to evolving market and regulatory demands.
Meanwhile, Ripple would gain access to Visa’s vast global client network, boosting its position as a leader in the corporate cross-border payments sector.
Conclusion
According to Trenovia Group’s forecast, the Visa-Ripple partnership could provide a powerful boost to Visa’s stock. Upon successful integration of RippleNet technologies, analysts project a 15–25% rise in Visa's share price within the first six months after the announcement.
For investors, this could represent a rare opportunity to invest in the expansion of the world’s leading payment platform during a crucial phase of digital transformation.
