Total 3#TOTAL3 is proving us right once again. #TheCryptoCity analysis is just perfect. See how beautifully green candles reached the level of 454b, The rally you are currently watching in #ALTS is because of TOTAL3.
Flipping 454b and now trying to retest it makes TOTAL3 even stronger. We are hoping it will stay above this level and ALTS will keep on going crazy.
We will share some ALTS analysis soon, stay connected and Always trust TheCryptoCity
Cryptos

Cryptographic Truth Part 2 (Chainlink)Part 1
The bar pattern continues to play out like clockwork, but for how long? There comes a time when every bar pattern decouples and fails to mirror. One of the most amazing bar patterns I followed was in 2022, where a distribution bear market fractal from 2018 started forming at all-time highs for Bitcoin.
For the next 218 days, this bar pattern mirrored 2018. It was mind-blowing, also the easiest trading year by far. The TA below was published at the start of 2022, so we knew how the whole year would play out with incredible accuracy.
The key to finding out where the top will be is within Bitcoin; almost every big move Chainlink has made last cycle has been followed by a large Bitcoin move as well.
So if we go back to the very first time Chainlink broke a massive range, we can see Bitcoin had a massive move up in 2019.
This right here is the only move where Chainlink moved up without Bitcoin, and it only managed half its impulse wave before Bitcoin moved up.
It's the only time in history so far.
The next and last range break was again followed by a Bitcoin move, and the final push to Chainlink's all-time high to blow off top was followed by Bitcoin moves.
So once the range breaks, Chainlink has a very distinct pattern, as you can see in the chart below; it's always the same:
One impulse up
One Pullback
One impulse up
That's it; then the move is over. It happens very quickly. You can see there the two times it's happened outside of a bull market. It took 40-50 days. 2021 took double, most likely because we were in a bull market. We are definitely not in a bull market, so expect the move to last around 50 days.
Let's take a look at what happened in the Bull market. Chainlink already made a run from 10 dollars up to 53 dollars; we are at 10 dollars right now.
2021
Bitcoin - 23,500
Chainlink - 10 dollars
2023
Bitcoin - $30,600
Chainlink - 10 dollars
The difference is massive from 2021 to 2023, but regardless, both assets ended up hitting the golden pocket at the same time in 52 days! Amazing stuff really; both are much more in sync than I ever expected!
So if we take the bar pattern (BTC) of the cycle low in 2015 and overlay it on today's price action, we get the following.
Pretty close mirror, especially the first cycle bottom in June 2022. So if we look at what fib level that was in 2015, we can see Bitcoin topped out just under the golden pocket.
Now, if we go back to the comparison chart of BTC and LINK, we can see that if Bitcoin did, in fact, top out under the golden pocket, that would then put LINK at $25.
So if we take a look at the macro and range Fib retracements, we can see that the 4.236 range retracement for LINK comes in at $25.
Everything you've seen in this TA is how I arrived at the most probable outcome for Chainlink this year for . This TA can change very quickly depending on what level Bitcoin is at, so it's basically near impossible to predict where it will top. As new data comes in, we will change targets, so don't take this to the bank. One thing is for sure, the bar pattern will guide the way.
The main thing we need to focus on here is the first pullback in this zigzag fractal. Where it pulls back will give us a massive clue on where it tops.
Now I want to finish off by adding a crazy outcome for LINK. This has a low chance of playing out, in my opinion, but anything is possible. So instead of LINK topping out at $200 in October 2025, it tops out at $750. This would basically be a mirror move from 2019 in terms of fib levels. Highly unlikely, heck if we made a 100% retracement by mid-November, it would be possible.

It's Time , Chainlink RallyStart here:
At the bottom of the comments of the TA above links to the next in the chain.
We have been 518 days in this range; you have had 518 days to buy Chainlink under 8 dollars.
I have been following this range for a very long time, and now I believe it's time we finally break it to the upside. The bar pattern keeps on playing out perfectly, so the next step of the fractal is a test of the top of the range with a break this time.
If you looked at the TA I linked above, you should know that we have been following a very specific bar pattern.
Chainlink had a small pullback at the top of the range back in 2019, which is very similar to what's happened right now. In 2019 there was a pulled back to the 0.618 Fib before making the big move out of the range and now we have a pullback to the 0.5Fib very similar moves.
According to the bar pattern, we will break the range in the next 7 to 10 days. Once that happens, the chances are there will be a multi-month rally, which is not to be confused with a bull market rally because the bull market does not start until the end of 2024.
If you've been procrastinating about buying Chainlink, your time is up. We looked at Chainlink's history; we know that after a break in the range, we could get a very aggressive move. There won't be time.
I think I have covered everything in the last few TAs on Chainlink. The time is now; the trade is simple:
2XL leveraged Chainlink tokens on Bybit, and we hold till December 2023. Whatever the price—20, 35, or 50—that trade will be closed based on time and the bar pattern fractal.
So to conclude:
1. First bullish monthly cross on Chainlink's history MACD
2. Bullish bar pattern fractal mirror
3. Lower high candle structure the weekly
4. Break of downtrend resistance on the LINK/BTC
5. 518 days of accumulation

ETH Roadmap (50k 2028)It is very much possible to see a 50k ETH by November 2028 if this channel stays intact; the path is clear.
I believe ETH is right now on the verge of bottoming on the ETH/BTC chart. We have been in a massive symmetrical triangle since 2017 and have now fallen to a very important level where ETH tends to bounce more often than not. Out of the seven different times ETH has come near this level, only twice did we have red candles (2W chart).
We also just printed a Heikin Ashi reversal candle on the monthly chart, looking very promising.
The ETH projections are calculated based on the Bitcoin cyclical cycles:
- Blue Line: Bull Market starts
- Red Line: Cycle Top
- Green Line: Cycle Bottom
My reversal indicator has confirmed a weekly reversal based on the last weekly candle close. This signal has fired off just four times within the entire ETH history; it's not a lagging indicator—it works in real-time.
If history repeats, ETH hits 16k this cycle sometime in May 2025.

BAL / USDT - BullishShow some strong signs:
1: Fake breakout at 3.620 level
2: Fake breakout at last high 3.496
3: wait for VWAP breakout
If VWAP breakout and hold
Target
1. 200 MA
2. high at 4.187

XRPUSD: Start accumulating. Big move incoming.XRPUSD is neutral on the 1D technical outlook (RSI = 51.497, MACD = 0.005, ADX = 27.267) as the price is consolidating on the 1D MA50, corresting October's rise. We are expecting a few more days of consolidation as the accumulation pattern appears to be similar with February's and early March. On both patterns the presence of a LH trendline serves as a bullish trigger signal once crossed. It is a Triangle formation just as the RSI is inside a Cup. Our target if the LH trendline breaks, will be the R1 level (TP = 0.9200).
See how our prior idea has worked:
## If you like our free content follow our profile to get more daily ideas. ##
## Comments and likes are greatly appreciated. ##

STXUSD: Start of a parabolic rally.Stacks is rising after forming a Golden Cross on the 1D timeframe and turning highly overbought (RSI = 81.130, MACD = 0.059, ADX = 31.757). This comes after a major bullish breakout yesterday as the price crossed over the LH trendline of the December 1st 2021 All Time High. This indicates that the token has officially entered its new Bull Cycle and the onyl pattern that is emerging so far is a Channel Up.
Initially we expect this wave to target the 0.786 Fibonacci level (1.8700) and after a pullback, we will aim at the +535% total rise (TP = 2.5000).
## If you like our free content follow our profile to get more daily ideas. ##
## Comments and likes are greatly appreciated. ##

BTCUSDTBTCUSDT daily chart, the price is currently near the 42190 resistance zone. If the price cannot break through, It is expected that there is a chance that the price will decrease. Consider selling in the red zone.
>>GooD Luck 😊
❤️ Like and subscribe to never miss a new idea!

Bitcoin Is Breaking HigherAs expected, Bitcoin with ticker BTCUSD is breaking higher and we can see strong rise now, with some sharp extensions to 40k level. Notice that we see price in fifth wave, about we talked in our past updates when we were tracking fourth wave consolidation. Well, bitcoin is now moving out of that fourth wave now, with a strong and sharp reaction, so fifth wave can be even looking for resumption up to 43k-44k area where bulls can slow down, after five subdivisions within the current fifth wave. So as long as the market is trading above short-term 38424 invalidation level trend is up. But keep in mind that after every five waves, the cycle can change, so it can be a bit too late for any potential longs in the short-term. But longer-term trend is up, and will likely resume, especially after higher degree retracement.

BTC dominanceBTC dominance plays a very important role in deciding the future of the crypto market. BTC dominance is making HH HL but we have mentioned a point where you can see the bearish move and this can give you a good chance to earn in #ALTS

INJUSD Has bottomed and is targeting 33.000Injective is on very stable technicals on the 1D timeframe (RSI = 61.927, MACD = 0.959, ADX = 21.734) as it resumed the rise, keeping clear of the 1D MA50, which remains the Support since since September 29th.
The 1D RSI shows that the market is replicating the early 2023 price action on a fractal which after reclaiming the 1D MA50, it rallied to the 1.5 Fibonacci extension. We therefore turn bullish again, aiming at the 1.5 Fib (TP = 33.000).
## If you like our free content follow our profile to get more daily ideas. ##
## Comments and likes are greatly appreciated. ##

BTCUSD: Right where it's supposed to be.Bitcoin is on the very healthy bullish technicals on the 1D timeframe (RSI = 60.823, MACD = 1089.300, ADX = 23.103) extending a controlled uptrend. The 1W timeframe remains overbought though (RSI = 74.426) as there has been no hard correction since mid August. Perhaps the relief in late weeks is an attempt of 1D to neutralize the overbought state on 1W without a strong correction.
Regardless of this, Bitcoin is right where it's supposed to be when compared to the previous Cycles. On this chart you see the harmonic structure of every bottom that leads to cyclinder pattern that ultimate paves the wave for the end of Cycle rally.
There has always been one extreme event' crash on every Cycle, after which the market bottomed and never looked back. It was COVID and Bitfinex before, this time we had FTX and now the market shouldn't break the 1W MA50 again before the next Bear Cycle starts. All that's left now to do is see how close the price will be to the 1W MA50 in the next Halving (April 2024) as from that point onwards the parabolic rally can start any moment.
See how our prior idea has worked:
## If you like our free content follow our profile to get more daily ideas. ##
## Comments and likes are greatly appreciated. ##

RSR / USDT - BullishShow some strong signs:
1: Fake breakout at 0.0022 level
2: VWAP breakout and hold
3: 200 Moving average breakout
there are 2 Scenarios
First: if level 0.002527 hold
Target
1. 0.0033
Second: if 0.002527 and 200 ma break down
Target
1. 0.002027

STG / USDT - BullishShow some strong signs:
1: Fake breakout at 0.5089 level
2: VWAP breakout wait for retest and hold
3: Bullish flag
Wait for breakout the flag
Target
1. 0.64
2. 0.74

ETHUSD: Golden Cross consolidation, before the rally to $2440.Ethereum is marginally bullish on the 1D technical outlook (RSI = 58.849, MACD = 64.500, ADX = 17.549) despite the despite the 19 day consolidation, suggesting strong underlying bullish bias. This shouldn't come as a surprise as the long term pattern has been a Channel Up in the last 12 months and on top of that, a Golden Cross was formed last week on the 1D timeframe.
The last time we had such a bullish formation was during the previous mid HH bullish leg consolidation on February 8th. After almost 2 months of ranged Rectangular trading, the price resumed the bullish trend and topped a little over Fibonacci 1.5. Being right now exactly on the middle of the Channel Up, we spread the risk by taking a buy position now, targeting the 1.5 Fibonacci level (TP = 2,440) near the top of the pattern.
See how our prior idea has worked:
## If you like our free content follow our profile to get more daily ideas. ##
## Comments and likes are greatly appreciated. ##

Ethereum Is Eyeing April Highs After A PullbackHello Crypto traders! In today’s article we want to update Ethereum chart with ticker ETHUSD. We already talked about a nice bullish turn from the support in the past updates, where we have been tracking a new five-wave bullish cycle.
As you can see today, ETH made nice and clean five-wave recovery, which indicates for more upside, at least towards the April highs and 2200 – 2300 area or maybe even higher. However, currently we can see it making a new corrective setback, so after a triangle corrective pattern or deeper A-B-C correction that can retest 1900 support, be aware of more gains. If ETH slips below 1870 level, then correction can go deeper and more complex with the next support around 1800 – 1750 area.
One of the main reasons why ETH can stay in uptrend is also because of the bullish ALTcoins in current ALTseason.

XRP ForecastKeep an eye out for XRP in its current area, if we see it test the the support line and not break it, then I would be in for a long term buy position. If it decides to start its bull run from its current position then I would also go in for a long term buy. Either way the future is looking bright for ripple and all of crypto with all this economic uncertainty.

KASUSD: The rally isn't over. Price can double.Kaspa is having one of the most aggressive rallies in the high capitalization category, positng the strongest weekly gains on the fifth straight green week. The 1D timeframe is obviously overbought (RSI = 86.789, MACD = 0.016, ADX = 53.378) but this rally can extend more based on the previous bullish sequence inside the annual Channel Up.
More specifically, the previous HH was made approximately on the 2.5 Fibonacci extension. In the meantime the 1W RSI peaked on a HH trendline. We have a similar pattern that is being followed currently so we expect KAS to reach again the 2.5 Fibonacci level and that's our target (TP = 0.28000) soon in order to form the new HH.
See how our prior idea has worked:
## If you like our free content follow our profile to get more daily ideas. ##
## Comments and likes are greatly appreciated. ##

The Last Time This Happened BTC Move From $9.5k to $63k.Bitcoin's weekly close above the Ichimoku Cloud is very significant. I wrote about this same event back in January 2020:
This is likely the beginning of the next expansion and bull phase.
If this scenario plays out, then a return to the ATH sometime around the last half of June 2024 and the first have of July 2024 is likely, with a new Top/ATH established somewhere between Nov 2024 and Feb 2025.

CHZ/USDT Secondary trendLogarithm. Time frame 3 days. Secondary trend. Downward channel.
After the rebound, the price is squeezed in a narrow 124-144 zone. The chart shows the percentages to the key support/resistance levels from this price squeeze zone.
Risk Management.
It is worth noting that the price of the coin is at a super profit, I have clearly shown this on the chart, which shows the entire main, long-term trend (the entire trading history). Consequently, when working on a coin, you need to keep this in mind and limit potential losses. Observe the risk management.
A local trend. The time frame is 1 day.
CHZ/USD Local trade. Pivot zone.
Main trend Time frame 1 week.

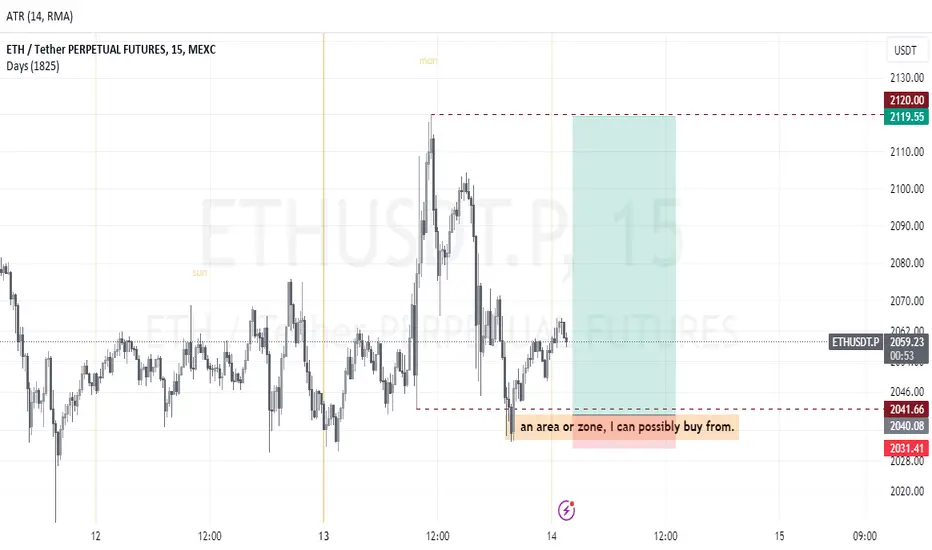
ETH Trade setup for 14th Nov 2023Eth has been bullish compared to BTC, so for me to trade this pair because it refused to make lower low but it also still took out some lows as an inducement to go short however, that's not the actually direction. It's direction is bullish to offset short traders. My possible scenario is for the market to trade into my zone at about 9:30am NY time today, then I can see what price is doing. If there be reasons to go long or short.
Ethereum Is Pointing Higher For Wave 5 or 3Ethereum is coming nicely higher as expected based on Elliott wave theory and it's now even extending the rally on the news that Blackrock Ethereum ETF plan is confirmed in the Nasdaq filing. On a daily chart, there's a chance it's trading in wave (5) of a potential leading diagonal formation or alternatively maybe even in wave (3) if we see a decisive break above upper leading diagonal line. However, in both cases there's still room at least up to 2200 - 2300 area to complete a five-wave bullish cycle in the 4-hour chart, so more gains can be seen, just be aware of short-term pullbacks.

AVAX/US DOLLAR These are levels that I'll be keeping an eye on when dealing with BINANCE:AVAXUSD , and I'll revise as price action progresses.
I adapt to the change in money flow.
Fundamentals:
Amazon Web Services (AWS) has partnered with Ava Labs in a bid to accelerate the adoption of blockchain technology by enterprises, institutions, and governments.
The move has sent the linked Avalanche AVAXUSD token soaring higher in recent days, outperforming even Bitcoin amid a major bull run in the biggest cryptocurrency. *OLD ARTICLE*
.....
Monthly:
1. P.A. broke a key low
2. Demand (untouched) below broken key low
3. Key S/R being revisited for 1st time
4. Key S/R rest within untouched demand
