XECUSDT Trade Signal Timeframe: 1H XECUSDT Trade Signal Timeframe: 1H
#Crypto #Cryptomarket #CryptoSignal #Forex #XECUSDT #TechnicalAnalysis #TradingOpportunity #Divergence #TradingSignal #TradingwithBelieve #NASDAQ #USTECH
Hey traders! 👋 Let's dive into a potential trading opportunity on the XECUSDT pair using technical analysis. 📊
📉 Previously Bullish Trend:
Firstly, on the 1H- timeframe, we've been witnessing a Bearish trend in the XECUSDT pair. 🐻
🔄 NO Divergence on HH (Higher High):
However, it's crucial to note that recently, we have started to observe a no divergence pattern on the HH (Higher High’s). This is an important signal that the Bearish momentum might be weakening. 📉🔄
📊 Trade Opportunity:
Currently, we are looking at a potential trade opportunity with a Bullish bias.
📈 Entry Price: 0.000002778
🎯 Stop Loss Level: 0.000002644
🚀TP1: 0.000002893
💰 Investment Advice:
Please remember that trading carries risks, and it's essential to have a well-defined trading plan, proper risk management, and stop-loss orders in place. This analysis is for educational and informational purposes only and should not be considered as financial advice. Make sure to do your research and consider your risk tolerance before entering any trade.
Happy trading, and may the pips be in your favour! 🚀📈💰 #HappyTrading #ProfitOpportunity #TradeSmart #CryptoSignal #StockSignal #TradingwithBelieve
Cryptos

POLYUSD Wait for a clear break out.POLYMATH is having a strong (1d) candle, crossing over both the MA50 and MA200 (1d).
This is not a bullish signal yet as the long term pattern remains a Channel Down, particularly bearish under the Falling Resistance.
Trading Plan:
1. Sell as long as the (1d) candles close under the Falling Resistance.
2. Buy if it closes over it.
Targets:
1. 0.1150 (Support 1).
2. 0.2100 (Fibonacci 0.5).
Tips:
1. The RSI (1d) is overbought. It favors short term selling.
Please like, follow and comment!!

BTCUSD This Resistance is the pivot point. Trade accordingly.Bitcoin is trading inside a Channel Up that led it straight to the Falling Resistance of July.
Even though it crossed over the MA200 (1d) and Resistance 1 (28175), it is currently struggling to close the candle over them.
Along with the MA100 (1w), which is a Resistance since May 7th 2022, those are your pivot points.
Trading Plan:
1. Sell as long as the (1d) candles close under the Falling Resistance.
2. Buy if it closes over the MA100 (1w).
Targets:
1. 27200 (Channel Up bottom).
2. 30800 (Resistance 2).
Tips:
1. The RSI (1d) is almost overbought near 70.00. This justifies a short term pull back before the break out.
Please like, follow and comment!!
Notes:
Past trading plan:

BTC 🌤️ 24-Hr & 1-Wk Outlook; Bullish Trend 🔛Sunny trading conditions with a few clouds lie ahead for the global crypto market, including Bitcoin and Ether in the next 24 hours and over a one-week horizon. 🌤️
This indicates that a slightly bullish market with upside potential is likely.
On the other hand, XRP and Binance ☁️ buck the trend, facing slightly bearish trading conditions.
Follow us for more crypto weather reports!

Filecoin lagging behind Bitcoin and rest of the cryptocurrenciesPer request, we want to take a look at Filecoin. This cryptocurrency has been around for a few years, and the first thing that stands out to us is that its value is down more than 98% since its peak in 2021. Another thing that caught our attention is the relatively lower daily volume since the start of summer compared to the period in the first six months of 2023. Currently, Filecoin trades near $3.40, with technical indicators like MACD, Stochastic, and RSI pointing to the upside on the daily time frame, with MACD attempting to enter a bullish zone above the midpoint. We saw similar developments shortly before the recent jump in the price of Bitcoin. Therefore, it might be worth watching out for a breakout in MACD as it can bolster a bullish case in the short term. However, we think that beyond the short term, Filecoin will be exposed to the pressure of growing Bitcoin’s dominance, likely putting a lid on its price.
Illustration 1.01
Illustration 1.01 shows the daily chart of Filecoin in USD and simple support/resistance levels.
Technical analysis gauge
Daily time frame = Slightly bullish
Weekly time frame = Neutral
*The gauge does not necessarily indicate where the market will head. Instead, it reflects the constellation of RSI, MACD, Stochastic, DM+-, ADX, and moving averages.
Please feel free to express your ideas and thoughts in the comment section.
DISCLAIMER: This analysis is not intended to encourage any buying or selling of any particular securities. Furthermore, it should not be a basis for taking any trade action by an individual investor. Therefore, your own due diligence is highly advised before entering a trade.

BTCUSD: The Huge Pivot Zone will decide its fate.Bitcoin has completed seven weeks of trading inside the 1W MA200 - 1W MA50 range. It is no surprise that the 1W technical outlook is neutral (RSI = 50.743, MACD = 460.600, ADX = 25.554) as while the 1W MA50 has been supporting, the 1W MA100 has been resisting. The latter hasn't closed a 1W candle over it since April 25th and is at the moment the top priority to break for Bitcoin.
On a greater scale though, the true Resistance to cross is 31,800 which is the top of what we call the "Huge Pivot Zone" (25,400 is the Support). The price hasn't closed any 1W candle outside of this Zone since it entered it on the week of March 13th 2023. In fact we can go as back as January 2021 and see the importance of this Pivot Zone. In 2022 there hasn't been any 1W candle closing under the top (31,800) of the Pivot Zone. Then in 2022 up until March 2023 this became a rejection level, closing all candles under it, while the Cycle bottom was being formed.
With the Bull Cycle HL trendline still supporting (along with the 1W MA50) and the price approaching the 1W MA100, we will soon have a strong breakout signal at hand. But if this is accompanied by a break over 31,800 then we have great chances of going into the April 2024 Halving with prices above $40,000. Likewise a crossing under the HL and the 25,400 Support can break the Bull Cycle blueprint and take us into uncharted (bearish) territory.
## If you like our free content follow our profile to get more daily ideas. ##
## Comments and likes are greatly appreciated. ##

SOLUSD Very close to a huge break outSolana is testing now the Falling Resistance from July's candle body top.
All two prior break outs over such Resistance in the past 12 months have ended with a new Higher High on our main Channel Up pattern.
Trading Plan:
1. Buy if the price breaks above the Falling Resistance.
Targets:
1. 33.000 (Fibonacci 2.0 extension as on previous break outs).
Tips:
1. The RSI (1d) will start flashing the first sell signs inside its Resistance Zone. Use it as an additional exit back up plan in case there is a sudden price reversal.
Please like, follow and comment!!

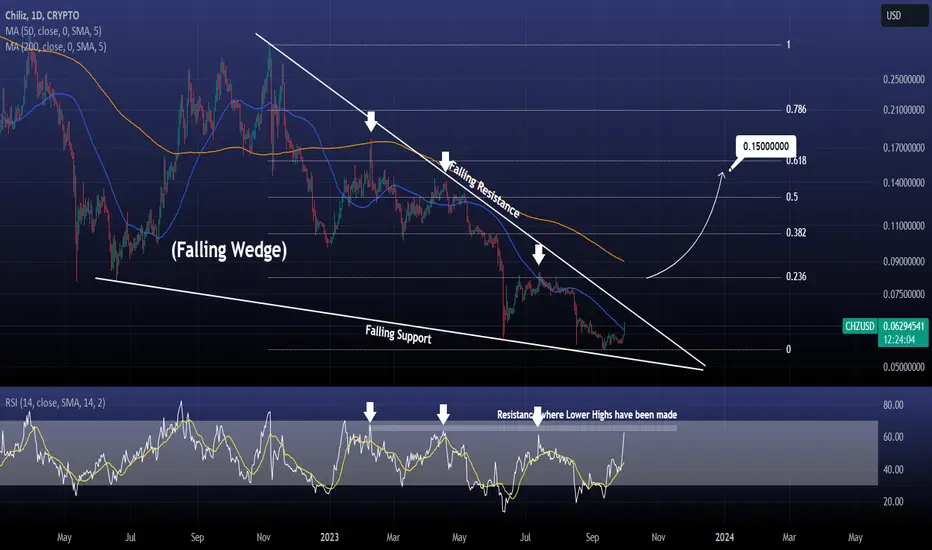
CHZUSD Giant Falling Wedge about to break upwards?Chiliz / CHZUSD crossed today over the 1day MA50 for the first time in 2 months.
Even though that is a significant bullish signal, it is still not as strong as a potential break over the top of the Falling Wedge pattern would be.
As a result, a break over the Falling Resistance would target the 0.236 Fibonacci level and 1day MA200.
Buy when a 1day candle closes over the 1day MA200 and target 0.15000 (a little under the 0.618 Fibonacci).
Note that the 1day RSI is on the Resistance level which has priced 3 Lower Highs on the Falling Wedge. This is why wee need to see a clear breakout.
Follow us, like the idea and leave a comment below!!
GALAUSD: Bullish divergence leading to the top of the ChannelGala is trading inside a Channel Down every since the market top early this January and today the 1D technical outlook turned neutral (RSI = 46.626, MACD = -0.001, ADX = 48.052) as it is trading on the strongest 1D green candle since March. The 1D RSI bullish divergence (HL) shows a short term momentum shift and the price can now target 1D MA100 and the top of the Channel Down. We estimate at least a +50.35% rise from the bottom (TP = 0.01900).
## If you like our free content follow our profile to get more daily ideas. ##
## Comments and likes are greatly appreciated. ##

LDOUSD About to break the MA50 (1d). Get ready to buy!LDOUSD is testing the MA50 (1d) as we speak. This Resistance level hasn't been broken since July 25th (2 months).
Despite trading inside a Channel Down, every MA50 (1d) bullish cross has completed uptrends of at least + 39.12%.
Trading Plan:
1. Buy on the slightest crossing over the MA50 (1d).
Targets:
1. 1.9350 (almost +39.12% aimed at the MA200 (1d)).
Tips:
1. The RSI (1d) is on a Rising Support while the price traded on a Falling Support, flashing a big bullish divergence. This can be the signal that breaks the Channel Down to the upside.
Please like, follow and comment!!

BICOUSD Massive pump but buy on the next pullbackBICOUSD is having a strong push that naturally turned the 1D technical outlook overbought (RSI = 75.371, MACD = 0.002, ADX = 39.812). By doing so it hit the 1D MA200 for the first time in almost five months. We are not buying into this pump yet as the 1W MA50 looms (rejected the April 8th high) as well as the Resistance Zone. The 1D MACD is below 0, suggesting that there is still high upside potential, so we will buy after a rejection near 0.2500 and target the top of the Falling Wedge (TP = 0.3500).
## If you like our free content follow our profile to get more daily ideas. ##
## Comments and likes are greatly appreciated. ##

COMPUSD Huge bullish divergence can take it to 130.COMPUSD is consolidating under the MA50 (1w) since mid August with the RSI neutral/ borderline bearish.
There is a Rising Support on the RSI (1w), which is filled before every rally.
The Support Zone has priced all 3 of those RSI bottoms.
Trading Plan:
1. Buy the next pull back on the Support Zone.
Targets:
1. 130.000 (Rising Resistance as well as slightly under Fibonacci 0.5).
Tips:
1. The RSI's (1w) Rising Support is a huge Bullish Divergence. Those are typically formed during long term market bottoms and usually an aggressive break out follows. The next rally can be even stronger than we expect.
2. The MA100 (1w) is the last Resistance standing and its crossing can potentially accelerate the rally we just talked about.
Please like, follow and comment!!

MKRUSD: Enormous upside potential, can hit 2,700.MKRUSD turned overbought (RSI = 71.689, MACD = 59.900, ADX = 32.319) as it extended the rally that basically started on August 25th. The wider pattern is a Channel Up and the current run carries similar characteristic with the first run of this Channel. The RSI patterns are identical and symmetry wise we have started the rise to the third peak of this sequence. We will first target the 3.0 Fibonacci extension (TP1 = 2,100) and on the next pullback, the top of the Channel Up on a +179% rise (TP2 = 2,700).
## If you like our free content follow our profile to get more daily ideas. ##
## Comments and likes are greatly appreciated. ##

KNCUSD Buy signal. Still room to rise inside this Rectangle.Kyber Network Crystal v2 / KNCUSD is posting a bullish fractal, common in the last 11 months.
The wide pattern is a Rectangle whose top has been hit on both prior bottom rallies.
Buy and target 0.96000.
Follow us, like the idea and leave a comment below!!

BONEUSD Don't rush on it yet. Buy in October, it's scripted!BONEUSD / Bone ShibaSwap is having a strong 2 day bullish streak and is near forming a 1day Death Cross.
We don't see this as a long term buy opportunity yet as not only is the price still under the Falling Resistance but hasn't yet hit the Rising Support of the long term Triangle.
In order to confirm the new bullish sequence, the price needs to cross over the Falling Resistance and typically close 1day over the 1day MA50.
Wait for a buy in the lower regions of the ellipse which can be timed after mid-October and target the top of the Triangle at 1.6000.
Using the sine waves you can see how consistent the timing of the tops are, it makes you even think that it's scripted.
Follow us, like the idea and leave a comment below!!

LOOMUSD: A scripted pump happened. Will it break the 2 year Res?LOOMUSD has seen in incredible rise during the last two weeks that just hit the LH trendline, basically the technical Resistance that is holding since November 2021. It is no surprise that the 1D timeframe is overbought but such parabolic rise turned even the 1W technicals overbought (RSI = 78.126, MACD = 0.007, ADX = 36.174). Keep in mind that this rise started after the token once again bottomed firmly on the S1 Zone, which has been the Bear Cycle's Support.
Our trading approach is simple. If LOOM closes a 1W candle over the LH trendline, it will be a technical long term bullish breakout. We will let the price then exhaust the rise and wait for a firm pullback to the 1D MA50, which will be the buy entry. Then our long term target for Q3 2024 will be near the ATH (TP = 0.24000).
## If you like our free content follow our profile to get more daily ideas. ##
## Comments and likes are greatly appreciated. ##

Crypto XRP/USDT (When moon?)
View On XRP/USDT (26 Sept 2023)
XRPUSD is in
* Neutral in short term (Intraweek)
* Neutral in Mid term (1 to 3 months)
* Slightly Bearish in Long term (3 months onward)
We may be in the early stage possible bullish trend for XRP.
Since it is not clear (or) too early, we can't be so sure about the bullishness.
The big stop huntting candle of 17 Aug seem to have formed the bottom.
I will be watching closely for a possible bullish mode.
It will become clearer if the price manage to clear above 0.5575
Let's see
DYODD, all the best and read the disclaimer too.
Feel Free to "Follow", press "LIKE" "Comment".
Thank You!
Legal Risk Disclosure:
Trading crypto, foreign exchange or CFD on margin carries a high level of risk, and may not be suitable for all investors.
The high degree of leverage can work against you as well as for you.
Before deciding to trade foreign exchange you should carefully consider your investment objectives, level of experience and risk appetite.
The possibility exists that you could sustain a loss of some or all of your initial investment and therefore you should not invest money that you cannot afford to lose. You should be aware of all the risks associated with foreign exchange trading, and seek advice from an independent financial advisor.

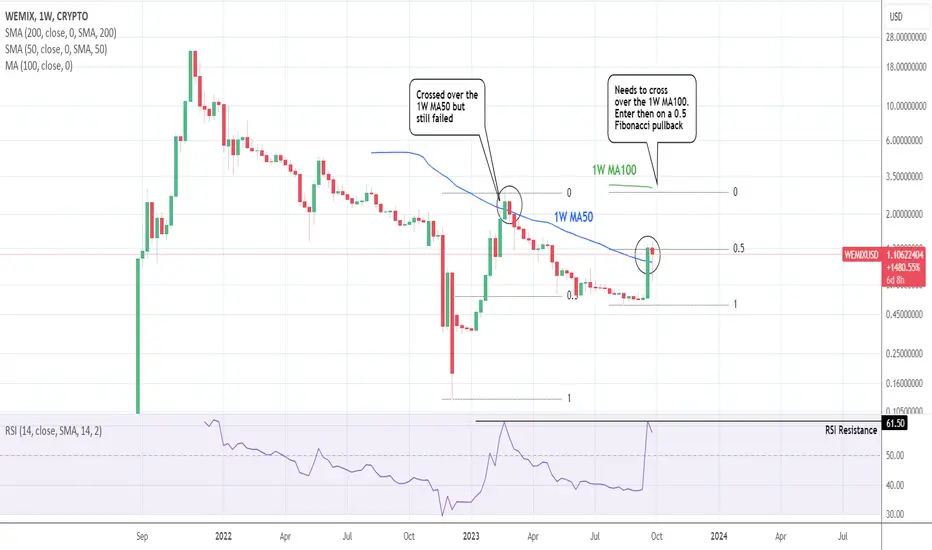
WEMIXUSD Bull Cycle still not confirmed.WEMIXUSD had the biggest 1W bullish candle last week in 2023 turning the 1W technical outlook bullish (RSI = 59.545, MACD = -0.041, ADX = 41.950) and the 1D RSI extremely overbought. A lot of traders will understandably rush to buy on this level especially since the price crossed over the 1W MA50, but that is not confirmed bullish region yet.
You can see that the 1W MA50 was crossed (and closed candle) on February 20th 2023 but still the price failed to sustain an uptrend and declined to the 0.5 Fibonacci level. Today the 1W RSI hit the 61.50 Resistance formed by the February top. Consequently we do not consider this breakout a reliable buy signal and instead we need to see the price crossing above the 1W MA100. If it does, we will turn into long term buyers on WEMIX, and will enter on the first 0.5 Fibonacci pullback from whatever the top price is.
## If you like our free content follow our profile to get more daily ideas. ##
## Comments and likes are greatly appreciated. ##
Long Privacy Coin Leader: Monero XMR, Follower Zcash ZECLazarus Group, an infamous hacking group of an unknown number of cyber criminals allegedly run by the government of North Korea, currently holds more than $47 million worth of crypto assets in their wallets. The blockchain analytics provider Dune Analytics, which gathers on-chain crypto data and makes it accessible to the blockchain community, revealed that stolen assets include Bitcoin, Ethereum, BNB, and Binance USD, among other stablecoins.
Still, the current amount of stolen funds has dropped by $39 million compared to the $86 million the Lazarus-linked wallets held on September 6. The figure was noticed a few days after the online gambling platform Stake became a victim of the group and lost $55 million in the incident.
coinmarketcap.com

ETHUSD Expect a huge rally to start soon.Ethereum / ETHUSD has entered the Rising Support Zone, which is the bottom Zone of the Ascending Triangle pattern started on the June 18th 2022 global bottom.
The Bullish Divergence on the 1day RSI (Rising Support) prompts to a Bottom pattern such as those on November 22nd 2022 and June 18th 2022.
This symmetry indicates that once the price crosses over the MA50 (1d) again, it will start a similar aggressive rally to the Ascending Triangle's top.
Buy now and target 2140 (Resistance A / pattern's top).
Follow us, like the idea and leave a comment below!!

LINKUSD: On the rise in the middle of this Channel.LINKUSD is trading inside the 0.5 - 0.618 Fibonacci range of the 18 month Channel Down pattern. The 1D technical outlook is slighly bullish (RSI = 58.592, MACD = 0.070, ADX = 30.217), which means that even though we are not at the start of this uptrend, there is still upside left.
The current rise was achieved after a Low on the 0.786 Fibonacci level. Inside this Channel, every time LINK held and rebounded on the 0.786 Fibonacci leve, it reached at least the 0.236 Fibonacci level. This indicates a sizeable upside profit to be made still. We are long, targeting the 0.236 Fibonacci level (TP = 8.12500).
## If you like our free content follow our profile to get more daily ideas. ##
## Comments and likes are greatly appreciated. ##

AAVEUSD In the middle of an aggressive rally. Still time to buy.AAVEUSD is testing the MA200 (1d) after a rebound on Support Zone (1).
If broken, this rally will most likely be extended to the Falling Resistance Zone, as the prior two did.
Trading Plan:
1. Buy either on a pull back to the MA50 (1d) or if the price crosses over the MA200 (1d) first.
Targets:
1. 83.000 (a little under the Falling Resistance Zone).
Tips:
1. The MACD (1d) reveals on what part of the previous rallies we are currently at. The symmetry is strong indicating that this is indeed a rally that has just started.
Please like, follow and comment!!

GMXUSD 1day MA50 based trading strategy.GMXUSD almost hit the 1day MA50 two days ago and has so far turned sideways.
This inability to cross over this Resistance level that has been holding since early August, is technically a bearish signal.
As long as it holds, sell and target 30.150 (Support A).
If broken though, we can have a June 30th type break out to the 1day MA100. Consequently be ready to close the sell and open a buy targeting 42.000 (top of the Channel Down and possible contact with the 1day MA100).
Follow us, like the idea and leave a comment below!!
