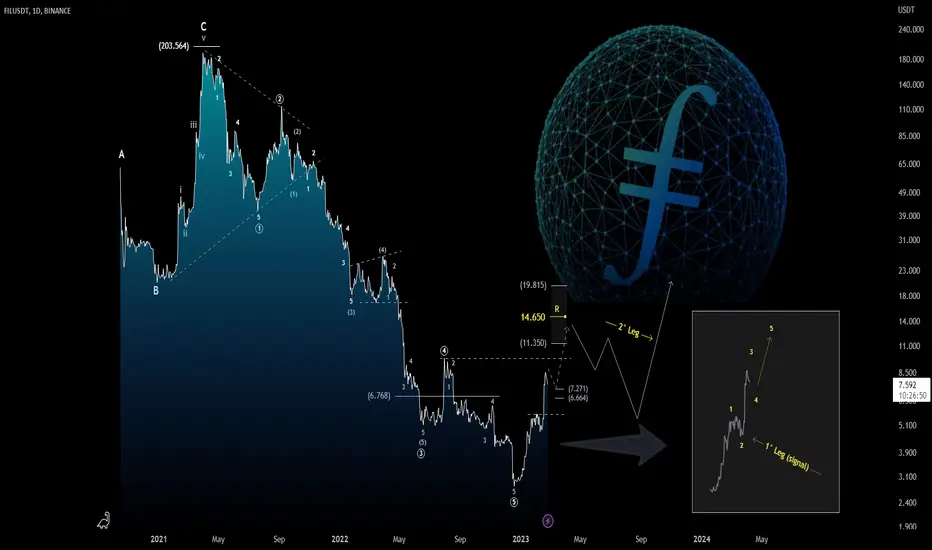
Filecoin ($FIL): Technical Analysis on Daily ChartHi everyone!
From a technical point of view, the trend on the daily chart is absolutely bearish, but at the same time, with the completion of the bearish impulsive structure (12345), I do not exclude the continuation of the corrective structure (bullish) in play. At the moment we do not have a confirmed bullish signal yet, but if in the short term we manage to trigger another bullish leg before the pullback, the trend could turn bullish again in the medium term. Technically speaking, in the short term, we have a support area around 7.26/6.66 and if $FIL is to turn bullish, it should be held.
Trade with care! 👍 ...and if you think that my analysis is useful, please..."Like, Share and Comment" ...thank you! 💖
Cheers!
N.B.: Updates will follow below
Cryptos
$QOMWETH Shiba Predator QOM is the Shiba Predator, it is a community token whose function is to flip the Shiba Market cap.
The live Shiba Predator price today is $1.02e-7 USD with a 24-hour trading volume of $4,162,720 USD. We update our QOM to USD price in real-time. Shiba Predator is up 30.55% in the last 24 hours. The current CoinMarketCap ranking is #381, with a live market cap of $61,291,329 USD. It has a circulating supply of 599,886,333,333,333 QOM coins and a max. supply of 1,000,000,000,000,000 QOM coins.

Bitcoin ($BTC): Price Action Analysis & Forecast in medium-termHi everybody!
In recent months my view on Bitcoin has not changed and only technical analysis will tell me "if and when" to change my mind. Well, as mentioned in our latest weekly analysis, the approach to the resistance area (Pivot + MA200) was expected, so we are not surprised by the rally triggered during yesterday's session. In support of this analysis, the Market Cap Index (TOTAL2) also seems to prove us right (see chart below), even if at the moment, on weekly chart, the trend is bearish, yet. Another interesting element is to see "how" $BTC triggered this bullish leg from 15,000 (that's why I don't use indicators or oscillators in my analysis). Today and in the next sessions, my supporters and I will continue to follow the dynamics on lower time frames (daily and intraday chart) in search of the next swing that should push the Price Action towards a consolidation. From a technical point of view, I think it is much more important to follow the opening of the next weekly bar than the closing of this candle....but this is just my opinion...
TOTAL MARKET CAP ANALYSIS
(Click & Play on Chart below)
BULLISH LEG from 15,000 AREA
(Click & Play on Chart below)
Trade with care! 👍 ...and if you think that my analysis is useful, please..."Like, Share and Comment" ...thank you! 💖
Cheers!
N.B.: Updates will follow below


Crypto analysis: Bitcoin struggles at $25K• Risk off in equity markets pose threat to positively correlating crypto prices
• Rising bond yields increase opportunity cost of holding zero-yielding assets
• Dollar strength weighs on nearly all dollar-denominated assets
Bitcoin has started to print bearish price action again after being unable to hold its breakout above the August high, around $25K. While it hasn’t quite sold off, the potential is there for a sizeable drop because of the renewed weakness we have seen across risk assets in recent days. What’s more, the strength in bond yields is continuing to increase the opportunity cost of holding zero-yielding assets like gold and Bitcoin.
Yields have been on the ascendency since the start of the month , when the Fed and ECB both appeared more hawkish than the markets had anticipated. Incoming data since those central bank meetings have been mostly better-than-expected, with US inflation and jobs data in particular supporting the view that more rate hikes are needed to cool the economy.
But will today’s FOMC minutes match the recent hawkish FedSpeak? If it does, then l reckon both the dollar and yields will rise further, an in turn hurt BTC/USD.
There’s been some talk that policymakers are looking to return to 50 basis point rate hikes again, but I highly doubt this is going to be the case as the Fed has already tightened its policy aggressively and will now go in with smaller increments so as to avoid an unwanted hard landing. Still, markets have realised that the Fed wants to keep its contractionary monetary policy in place longer than they had expected at the back end of last year and start of this year, owing to further improvement in US data and sticky inflation.
Tactically, the bears could step in more aggressively than we have seen if BTC/USD were to break below its most recent low at $23,840. If that happens, then price could follow the path we have created on the chart.
The bulls meanwhile will want to see a clean breakout above $25.2K to confirm the bullish reversal. That’s because the fake out above this level on Tuesday has raised doubts over the bulls’ conviction.
-- Written by Fawad Razaqzada, Market Analyst with FOREX.com
Follow Fawad on Twitter @Trader_F_R


Moonbeam ( GLMR) is "Buy A Dip"Moonbeam, known as GLMR, is turning bullish with clear five waves up from 2023 low, followed by a correction that is in progress now. It can be flat with subwave B hitting a resistance now, so be aware of lower C wave. Support is 0.42.

Bitcoin - Are we here⚫️dear BTC and Crypto Nation⁉️🚨🚀Bitcoin
Comparing the number of downward extremes at the Aroon Oscillator from Top to Bottom 2013-15 & 2017-18 🔵🟢🟡🔴...
... are we here⚫️dear BTC and Crypto Nation⁉️🚨🚀
Comment your thoughts💭
Likes🚀 & Follow🔗 appreciated🤗
Disclaimer:
Not financial advice
Do your own research before investing
The content shared is for educational purposes only and is my personal opinion


Bitcoin: Short-term Outlook Chart is pretty self explanatory, but as you can see, price broke above the downward trends resistance (red line), before reversing and using it as support. This is one of many signs of a reversal. We are currently testing new resistance (blue line), but given the momentum and breaking the downward terns, we should have enough buying to break above the current level being tested.

stg to $4 this year? i dunno but i'll enjoy watching it tryoh you thought it was doomed because THEY bought all the tokens? damn son.
I love me some fundamental cryptos, the future is multichain and STG has some real hype level utility. gonna enjoy watching this one

$O Childhoods End ✨ $O Childhoods End...Second Star to the right and straight on 'til morning✨
Freedom and Stability
The live Childhoods End price today is $0.000041 USD with a 24-hour trading volume of $972,251 USD. We update our O to USD price in real-time. Childhoods End is up 21.18% in the last 24 hours. The current CoinMarketCap ranking is #2807, with a live market cap of not available. The circulating supply is not available and the max. supply is not available.

LITECINE SellIt seems that due to the strength of the price drop and then the price correction, the market is preparing to continue the drop

BITCOIN:Building a new uptrendHey traders, in today's trading session we are monitoring BTCUSDT for a buying opportunity around 22800 zone, once we will receive any bullish confirmation the trade will be executed.
Trade safe, Joe.

Bitcoin is at Resistance, What Now?Bitcoin is at the $25,000 resistance. If the price breaks above this level, it will open the coin to further gains.
The Details: Bitcoin recently hit the $25,000 resistance level, which was identified in our last analysis. This resistance level was last tested in August 2022, and has proven to be a tough hurdle for Bitcoin to overcome. Let’s review Bitcoin's current state and what could happen next.
Next Resistances
If Bitcoin manages to break above the $25,000 resistance level, the next minor obstacle is at $28,000. This level briefly stopped the bear run in 2022 and could pose a challenge for Bitcoin this time around.
However, if Bitcoin manages to overcome this minor resistance, it will then face a major resistance at the $34,000 level. This level has caused a bounce in January 2022 and also in the summer of 2021, and would be a significant challenge for Bitcoin to overcome.
Bull Run Support
This bull run is supported by a few factors. For instance, the 100 simple moving average (SMA) acts as a mobile support and resistance. Bitcoin recently broke above the 100 SMA, which could potentially indicate that the price will hold up in the case of a reversal.
Additionally, another essential price point to keep in mind is the previous support at $21,500. Bitcoin already bounced off this level a few days ago, which indicates that it could hold as a support level in the future.
Bottom Line: Bitcoin has reached a resistance level of $25,000; if it manages to break above it, it will face the $28,000 minor resistance and then the $34,000 major resistance. There are a few indicators that will help support this bull run, including the 100 SMA acting as mobile support and resistance and the previous support level at $21,500.

$QOM Shiba Predator🥂🍾🎆QOM is the Shiba Predator, it is a community token whose function is to flip the Shiba Market cap.
The price of Shiba Predator (QOM) is $0.000000059116 today with a 24-hour trading volume of $1,065,853. This represents a 8.80% price increase in the last 24 hours and a 20.10% price increase in the past 7 days. With a circulating supply of 600 Trillion QOM, Shiba Predator is valued at a market cap of $35,347,787.

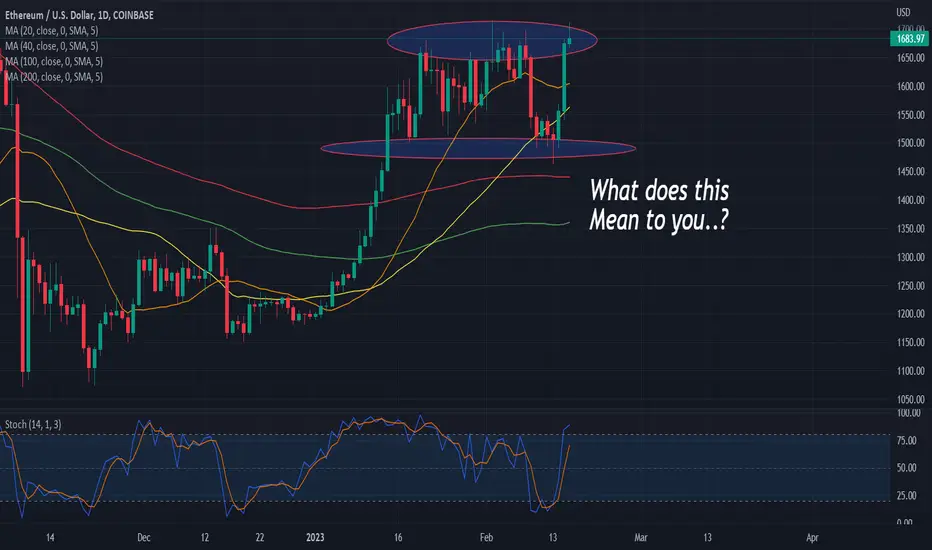
Crypto Decision Time..In every Traders lifetime there comes a time where Markets look like they are going to fly and fly. Markets push up quickly and they return to former levels seen along side former PA. The question arises... Will the level break and should I hold my longs against my will?....
And so the serotonin is released, the excitement begins and the FOMOer floods into the market AFTER the first move. The drop we saw recently rebounded on sustained market sentiment to the upside but you will notice the stall at very recent highs. The hype that arrives around crypto markets will often come around the time that the market mood looks more optimistic and other coins like BTC start to move.
But how should you handle it? Where do you buy? Where do you sell? Where do you exit? These are all things that are best known before markets move because if you are trading unnaturally (against the normal flow of the markets) then you are going to find things end badly, especially with such assets.
These are all questions Traders inherently face on such assets.
If you are a buyer and you want to get things right, naturally you'll have to buy on dips... And by dips we mean significant moves to comfortable areas of support with aligned risk. We are not house sellers looking to load into one move. We trade many dips and we exit many pushes up to key resistance for gains.
Selling HVA's gets dangerous as you can be roasted on hype moves. If you are selling you will also need to be a scalper with very, very light trading sizes. Your goal is to kill of moves up on gains and re-buy substantial dips.
Do not get caught in a rut and buy dips that are not far pushes. You will end up getting poor market value repeatedly and over time the worse deals stack up and losses begin to rise. Keep sizes small and smart and do not let your emotion push you to take trades you are not comfortable with.
It's advisable to have a MAXIMUM trade size and MAXIMUM Drawdown limit so you do not exceed what is comfortable for your capital. It is also wise to have separate ones for any crypto or indeed anything you are trading. The emotion aspect you will find is removed if you consistently take gains and have sufficient risk plans monitoring your overall risk constantly.
MATIC UPDATE #PolygonPolygon (formerly Matic Network) is a Layer 2 scaling solution backed by Binance and Coinbase. The project seeks to stimulate mass adoption of cryptocurrencies by resolving the problems of scalability on many blockchains

Ripple Is Pointing HigherXRPUSD is showing nice and clean bullish setup formation in the 4-hour chart that can send the price higher, at least up to 0.50 resistance area for wave (C) or maybe even higher within wave (3).
After an impulsive five-wave rally from the lows into first leg (A)/(1), it's actually now in a slow A-B-C corrective pullback within wave (B)/(2) that can find the support here around 0.37 - 0.35 area and from where we should be aware of a continuation higher, especially if the price jumps back above 0.41 region. Invalidation level is at 0.30.
Happy trading!

NEAR Coin : Technical Rebound in short-medium term?NearCoin's main trend is still bearish , but we do not rule out some interesting corrective moves in the near term. If our analysis is correct, it might be interesting to accumulate on corrective swing and let Long positions run to 3.00 area.
If this idea will be supported by your "Likes" we will continue to follow the crypto with updates below.
thanks for your attention and please... trade with care! 💖

BTCUSD good chance to rallyThe BITSTAMP:BTCUSD gives a buy signal today after breaking the 22450 level targeting two
1st target 24265
2nd target 28000
stop loss 22900

Buy the dip?"The Formation of a Bump and Run Reversal Pattern in Bitcoin!"
This is an incredibly bullish sign, with a 60% success rate of breaking to the upside, if the neckline is held. In the past, Bitcoin has exhibited this pattern multiple times. For example, in 2019, it formed a textbook bump and run after a 14.5% pullback following capitulation. Currently, Bitcoin has only pulled back 10%, if Bitcoin pulls back 14.5% it puts at 20500 level,which is a important level to remember. In 2015, another bump and run was formed after a similar pullback.
Taking a closer look at the daily RSI of Bitcoin, there is a noteworthy pattern to observe. Over the course of its 4500-day history, the 89 level on the RSI has only been hit 20 times. On January 14th, 2022, this level was hit, which is an uncommon occurrence. Every time this level is reached, it indicates that Bitcoin is either in a bull market, at a major top, or has just come out of a capitulation. The red dashed line represents cycle bottoms, and the green dashed line marks the first hit of the RSI level following a cycle low.
2011
2015
2019
2023 (Present day)
Examining each cycle in detail, we can see that every time there is a capitulation, Bitcoin experiences a massive move on the RSI, followed by a bump and run reversal. The main chart above shows the 20500 target. It is possible that there may be a quick dip to 20500 while keeping the bump and run reversal pattern intact.
The 20500 level is important due to the presence of a CME gap, which sits right on top of the 21 weekly moving average. This moving average is one of the most significant in Bitcoin's history and has been a key factor in preceding major rallies. Before each rally, Bitcoin tends to drop down to the 21 weekly, testing it as support, before starting its move, just as it did in 2020.
The Mayer multiple band is also at 20500.
In conclusion, for the pattern to remain valid, the price must hold 20500, close the CME gap, and hold the 21 weekly, which serves as the neckline of the bump and run reversal. If a weekly candle closes below 20500, it will render this technical analysis invalid.

CRYPTO MARKET UPDATE! POST CPI UPDATE! Hi Snipers,
Please refer to the recording for the next price levels and scenarios.
Thanks
MS
