SUI Looks Bearish (2H)From the point where we placed the red arrow on the chart, it appears that the correction in SUI has begun.
An expansionary wave structure is visible, which could potentially push SUI toward the green zone.
Targets are marked on the chart. As long as the supply zone holds, the price may move toward the targets and the green box.
A 4-hour candle closing above the invalidation level will invalidate this analysis.
For risk management, please don't forget stop loss and capital management
When we reach the first target, save some profit and then change the stop to entry
Comment if you have any questions
Thank You
Cryptosignals

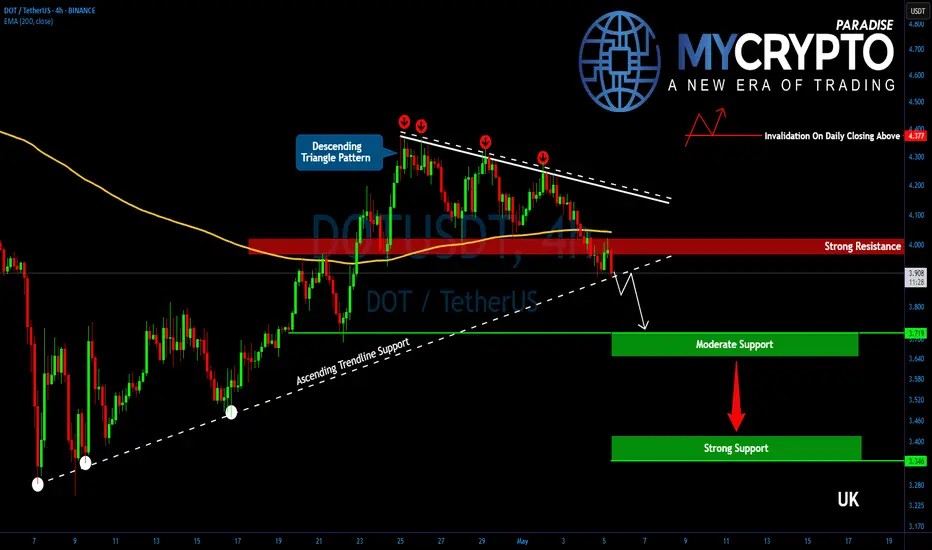
DOTUSDT Is Hanging by a Thread! Breakdown Ahead?Yello, Paradisers! Is #DOT about to hit new yearly lows? The structure is getting ugly again—don’t get caught off guard as this setup is starting to turn dangerous fast.
💎After a brief and weak corrective bounce, DOTUSDT is once again losing steam. The price has already broken down from a descending triangle—a bearish continuation pattern—and is now threatening to breach its key ascending support level. Momentum is shifting aggressively back in favor of the bears.
💎#DOTUSDT is now hanging to the critical $3.90 support level. A decisive breakdown below this zone would likely trigger another wave of selling pressure, opening the door for a drop toward the next moderate support range at $3.72 to $3.65. While this area could attract some short-term profit-taking, the broader trend remains clearly vulnerable, with bearish momentum continuing to dominate.
💎Should bearish pressure continue, and it’s highly likely at this stage that DOT could fall all the way toward the stronger support zone between $3.40 and $3.35. This region marks the 52-week low, and it's where bulls might step in to defend and attempt a meaningful rebound.
💎Additionally, the 2-hour EMA-200 has shown itself to be a strong trend guide. Every time DOT traded above it, bulls had a slight edge. But now that price has once again broken below this moving average, momentum is back with the bears.
Paradisers, strive for consistency, not quick profits. Treat the market as a businessman, not as a gambler.
MyCryptoParadise
iFeel the success🌴
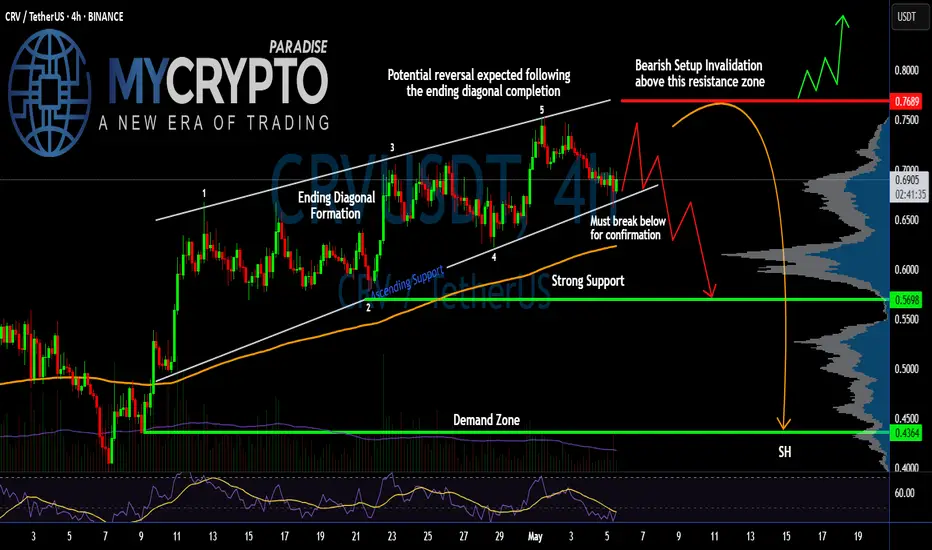
Is #CRV Ready for a Reversal or Not? Key Levels to Watch Yello Paradisers! Are we about to witness another brutal trap as #CRV finishes its final leg up and prepares to flush all late longs? Let’s break down the setup for #CurveDAOToken:
💎#CRVUSDT is currently trading around $0.6948, and what we’re seeing here is a classic Ending Diagonal Formation, a pattern well-known for luring in unsuspecting bulls before reversing violently. The structure has completed its five-wave sequence, and the price is now teetering just above key support.
💎The resistance zone near $0.7689 is where the whole game flips. This level has been clearly rejected before, and it now marks the invalidation point for any bearish outlook. A sustained move above this region with solid momentum would invalidate the diagonal and potentially send the price toward the $0.80+ mark. However, without that breakout, the bearish reversal remains the dominant scenario.
💎#CRVUSD is holding above rising trendline support, but this support is critical. A break below it confirms the end of the diagonal and should trigger a strong sell-off. The first target on a breakdown is the $0.5698 area, a zone previously respected and backed by significant volume profile interest.
💎If sellers gain traction and that level breaks down too, we’re watching for a move toward the demand zone at $0.4364, which aligns with the lower volume shelf—this is where the real pain could begin for over-leveraged traders caught on the wrong side.
Play it safe, respect the structure, and let the market come to you!
MyCryptoParadise
iFeel the success🌴
Is the CGPT Retest a Setup-Are You Ready for It?Yello, Paradisers! Have you been watching CGPT closely? Because what we’re seeing now could be a textbook setup to liquidate early longs before a brutal downward move. This is the exact type of trap that punishes undisciplined traders and rewards those who wait.
💎After weeks of bullish momentum with clean higher highs and higher lows, #CGPTUSDT has now printed a clear change of character (CHoCH). The previous low was taken out, and now price has pulled back right into a high-probability resistance zone. This zone, between $0.115 and $0.118, aligns perfectly with a broken ascending trendline adding confluence that strengthens our bearish bias. Traders who aren't careful might interpret this retest as a sign of strength, but this could just be the market setting up its next liquidation wave.
💎Adding even more weight to this bearish thesis is the fact that #CGPT is currently trading below its 50 EMA on the 4H timeframe, showing clear weakness and confirming that the short-term momentum has already shifted in favor of sellers. This acts as dynamic resistance and makes it even harder for price to reclaim bullish control without a significant effort from buyers.
💎The structure is showing all signs of a classic trap. Price action is hesitant at resistance, and with momentum waning, a rejection from this level could spark a swift move down toward $0.09188, our first support zone. But that may not be the end of it. If selling accelerates, we are eyeing the $0.07133 area as a potential major demand zoneour strong support and where true smart money will likely accumulate. However, we must always remain tactical. If CGPTUSDT flips above $0.12526, this bearish scenario is invalidated and we would reassess for possible bullish continuation.
Discipline, patience, robust strategies, and trading tactics are the only ways you can make it long-term in this market.
MyCryptoParadise
iFeel the success🌴

JTO : Price at a critical point: Falling or rising?Hello friends
Given the long-term range that this currency has made, the price has now reached the bottom of the range, which is very sensitive, and this currency also has a token release, which can be a warning.
In case of a drop, we have identified important supports for you, so that you can buy with risk and capital management.
*Trade safely with us*

MOVE : Where to buy ?Hello friends
Given the upcoming token release, the price is expected to continue to fall, so be careful.
In case of a fall, we have identified important support levels for you, where you can buy with capital and risk management.
*Trade safely with us*

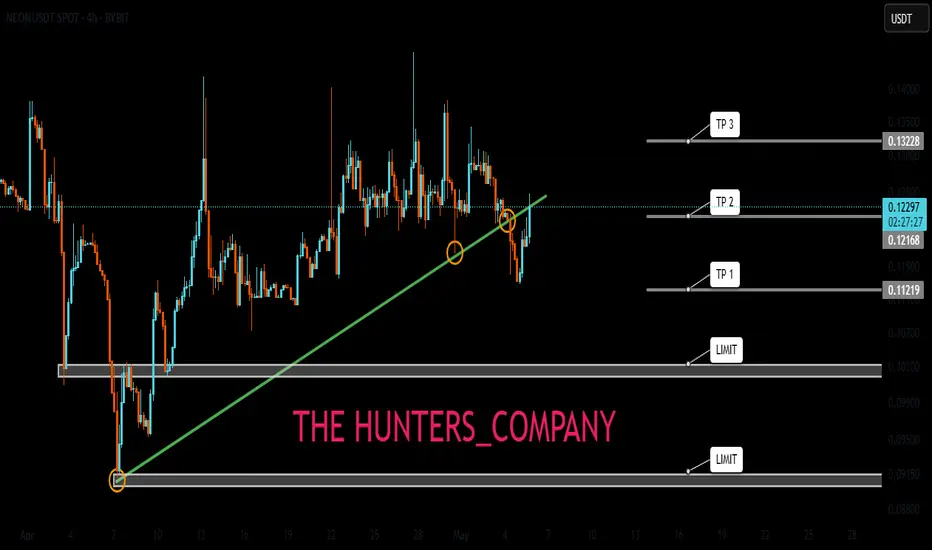
NEON : How long does the decline last?Hello friends
If you are a holder of this currency or have bought it, you should know that the token release is coming and this will cause the price to drop, so be careful.
We have identified good buying ranges for you, where you can buy in case of a drop, with risk and capital management.
*Trade safely with us*
AGI : The fall is comingHello friends
As the price has reached a strong resistance area, you can see that the price has been corrected and lower lows have been made. Now, given the token release that this currency has, there is a possibility of further decline, so we can buy at lower points with capital and risk management and move with it to the specified targets.
*Trade safely with us*
SUI SIGNAL...Hello friends
As you can see, buyers entered the price correction and a reversal pattern is being built...
Due to the buying pressure and the entry of buyers, we can buy within the specified ranges and move towards the set targets, of course with capital and risk management.
*Trade safely with us*

BTC Forming Bullish Structure — But Wait for the Higher LowAfter months of lower lows and lower highs, Bitcoin has finally broken structure by pushing above the previous lower high, officially forming a new higher high (HH). This is an early sign of a potential trend reversal back into bullish territory.
However, before momentum continues upward, a healthy retracement could occur. The key level to watch is the support zone around $91,200. If price pulls back and forms a higher low (HL) here or slightly lower around the $88,700–$87,500 zone, it would confirm the bullish structure and potentially kickstart the next leg up.
Patience is key here — let the higher low form before looking for long setups.

B3 Aanalysis (12H)The strong bullish move on B3 is turning into a 3D. It could move from the supply zone towards the SWAP zone and then get rejected upwards.
We are looking for buy/long positions in the green zone. Targets are marked on the chart.
A daily candle close below the invalidation level will invalidate this analysis.
For risk management, please don't forget stop loss and capital management
When we reach the first target, save some profit and then change the stop to entry
Comment if you have any questions
Thank You

MEMEFI/USDT Bearish Rejection at Supply Zone Incoming? Down!!Price is currently approaching a key supply zone after a sharp drop, with signs of weakness on the lower timeframe. The recent bullish push appears corrective, forming a potential lower high structure.
Looking for price to tap into the highlighted supply area and show rejection — this could confirm a short opportunity.
Entry: 0.00447
Stoploss: 0.00466
Target:
• TP1: 0.00428
• TP2: 0.00412
• TP3: 0.00398
• Final TP: 0.00370
This setup aligns with a bearish continuation bias unless price breaks cleanly above the zone.

BITCOIN (BTCUSD): Strong Bullish Signs?! ₿
Bitcoin has probably completed the accumulation
stage after a completion of a strong bullish wave a week ago.
I see a breakout of a resistance line of a symmetrical triangle
on a daily time frame.
It is an important sign of strength of the buyers.
The price may continue going up now and reach 98.180 level.
❤️Please, support my work with like, thank you!❤️

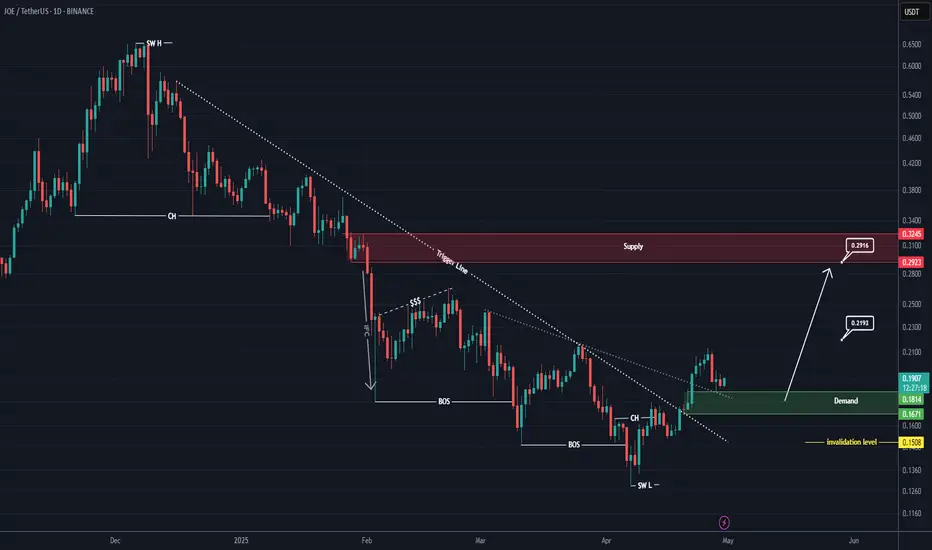
JOE Looks Bullish (1D)A 3D divergence is visible on the chart, indicating that sellers have exited their short positions.
A key trigger line has been broken, and the price has reclaimed critical levels.
We have identified two entry points where we plan to open buy/long positions.
A daily candle closing below the invalidation level will invalidate this analysis
Do not enter the position without capital management and stop setting
Comment if you have any questions
thank you

COOKIE/USDT Short Setup Loading - High-Probability DropPrice recently pumped into a premium zone and gave us a clear Change of Character (ChoCh) — a classic signal that momentum is shifting from bullish to bearish. Now, we’re seeing a pullback into the 0.5–0.618 Fibonacci retracement zone, which often acts as a key area for entries.
📍 Trade Plan
Entry: 0.182 USDT
Stop-Loss: 0.191 USDT (above recent high / invalidation point)
Target: 0.173 - 0.1657 - 0.153
🔎 Why This Setup Stands Out:
✅ ChoCh Confirmed – Momentum has shifted, suggesting the bulls are losing control.
✅ Fibonacci Confluence – Price is pulling back right into the golden zone (0.5–0.618), offering a textbook short entry.
✅ Clean Risk/Reward – With a tight stop and a defined target, the setup offers solid R:R potential.
💭 Final Thought:
Now it’s all about confirmation. If we see a solid rejection in the zone, this setup could play out with strength. Patience is key — let the market come to you.

JOE Looks Bullish (1D)Two important trigger lines have been broken, and a bullish CH (Change of Character) is also visible on the chart. A key support zone has formed, which is expected to hold.
The correction that occurred has been sufficient in terms of both time and price, and the break of the trigger line indicates that the correction is likely over.
There is also a liquidity pool above the chart that is expected to be swept soon
Targets are marked on the chart.
A daily candle closing below the invalidation level would invalidate this analysis.
For risk management, please don't forget stop loss and capital management
Comment if you have any questions
Thank You
GPS Looks Bullish (4H)There are numerous bullish signals on the GPS chart.
A trigger line has been broken, followed by the formation of a bullish CH on the chart.
After the breakout and pullback to the trigger line, the price has formed several support zones, which are fueling its upward movement.
Additionally, a significant order block from the higher timeframes has been cleared.
As long as the demand zone holds, the price could continue moving toward the targets.
A daily candle close below the invalidation level will invalidate the bullish outlook.
For risk management, please don't forget stop loss and capital management
Comment if you have any questions
Thank You

ETH is showing a potential reversal !on the 15 minute chart,
Price is holding strong above the support zone
and is now testing resistance at $1815
if it breaks, the next target is $1830.
scalpers don't miss this breakout opportunity!

Shorting Sui how Far Down Are We Going ? 3.3 -3.0 ? Here is my trade I just entered with stop loss and take profit zones 1 and 2. Let me know what you think
Kris/Mindbloome Exchange
Trade Smarter Live Better

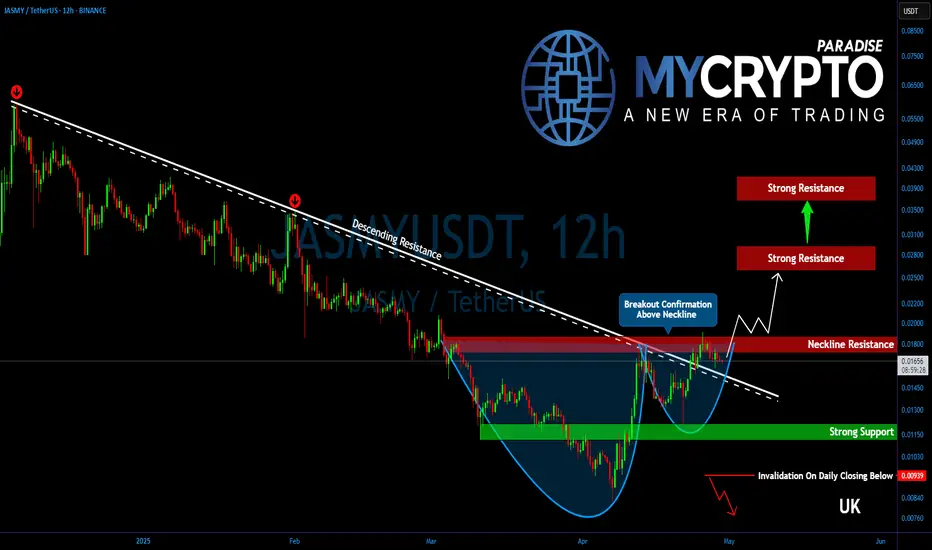
Is JASMY Ready for a Massive Comeback? Key Levels to Watch!Yello, Paradisers! After months of relentless selling, could #JASMY finally be staging a comeback? Let's dive into its key technicals:
💎After an extended and painful downtrend, JASMY has finally broken out of its multi-month descending trendline resistance. This significant technical breakout marks the first step toward a potential broader recovery. Moreover, the price action is shaping a potential cup and handle formation—a powerful bullish continuation pattern—which strongly suggests that the recovery momentum still has further room to run.
💎At the moment, #JASMYUSDT is battling a crucial resistance zone between $0.01750 and $0.01850. This area serves as the neckline resistance of the developing bullish structure. A clean and convincing breakout above this zone would trigger a major shift in momentum, potentially setting up JASMY for a back-to-back bullish breakout.
💎Should bulls succeed in pushing above this resistance, the next immediate target lies at $0.02500 to $0.02750—a heavy supply zone that coincides perfectly with the 50% Fibonacci retracement. This level is expected to attract some strong profit-taking.
💎However, if bullish strength continues to hold firm even after that, JASMY could extend its rally toward the 61.8% Fibonacci retracement zone, located around $0.03650 to $0.04000. This region is historically known to be a "golden pocket" for reversals and thus demands maximum caution. If signs of exhaustion emerge near this zone, it could potentially mark a medium-term top.
💎JASMY’s first primary support now sits at $0.01500. Below that, a firmer, more critical support base exists between $0.01150 and $0.01100—a zone that has already proven capable of withstanding strong selling pressure in the past.
Paradisers, strive for consistency, not quick profits. Treat the market as a businessman, not as a gambler.
MyCryptoParadise
iFeel the success🌴
FETUSDT.P Breakdown Incoming? Supply Zone + Rising Wedge FET just tapped into a strong supply zone and formed a rising wedge — usually a bearish sign. Price looks weak here and might break down soon.
If the wedge breaks, I’m looking for a short setup.
Entry: 0.716 - Wait for breakdown
Stoploss: 0.746
Target 1: 0.685
Target 2: 0.657
Target 3: 0.607
Waiting for confirmation before jumping in. Let’s see how it plays out.

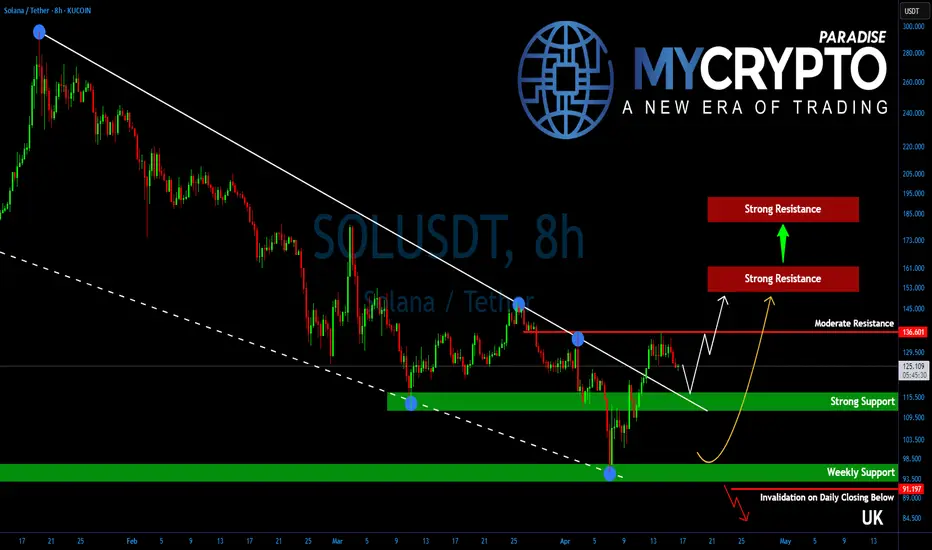
Solana Is One Breakout Away From a Bullish Explosion!Yello, Paradisers! Did you notice how #SOLUSD has been quietly positioning itself while the rest of the market remains uncertain? If you're not paying attention right now, you could be missing one of the cleanest setups on the charts.
💎After several weeks of downside grind and tight consolidation, Solana has just broken out of a falling wedge—a powerful bullish pattern that typically signals trend reversals or the start of a strong upside leg. This breakout wasn’t random either. It occurred after SOL successfully defended a key higher time frame support zone, signaling strength behind the move.
💎For #SOLUSDT, all eyes are on the $136.50 resistance level. This is a critical structural pivot. A clean break and close above this level would confirm a shift in higher time frame momentum from neutral to bullish. Until that happens, bulls still need to proceed with caution—but the setup is clearly developing in their favor.
💎Adding conviction to the idea of a bullish breakout are several supporting factors. Oscillators are showing bullish divergences, a classic sign that seller momentum is fading. At the same time, a golden cross formation on the 12-hour chart is getting closer which typically precedes sustained trend reversals and stronger moves to the upside.
💎If bulls succeed in reclaiming $136.50, the next price targets are $155–$160 as the initial strong resistance zone where some profit-taking could occur. If bulls hold strength, SOL is likely to head further higher and aim for $180–$190, which lines up with the target of the wedge pattern. This is a strong resistance zone and a level which could mark end of the corrective phase for Solana.
💎On the downside, immediate support lies between $110–$115. This is a well-defined range of demand and should offer strong buying interest if any short-term pullbacks occur.
Paradisers, strive for consistency, not quick profits. Treat the market as a businessman, not as a gambler.
MyCryptoParadise
iFeel the success🌴
SHIBUSDT Is Flashing Major Bearish Warnings – Are You Ready??Yello Paradisers, Have you been keeping an eye on SHIBUSDT? If not, now is the time. The market is showing clear signs of weakness that could lead to a significant bearish move, and many traders may not be prepared for what’s coming.
💎SHIBUSDT is currently looking bearish after forming a clear bearish Change of Character (CHoCH) on the higher timeframe. Adding to this, the price action on the lower timeframe is showing an internal Change of Character (I-CHoCH) originating from a 4-hour bearish Order Block (OB). This setup substantially increases the probability of a continuation to the downside.
💎What we are focusing on now is the potential pullback. If SHIBUSDT pulls back to fill the Fair Value Gap (FVG) or develops a bearish pattern from the Order Block, it would provide a strong short opportunity with an excellent risk-reward profile.
💎However, it is crucial to remain cautious: if the price breaks out and closes a candle above the identified Order Block, it would completely invalidate the bearish idea, and we would need to step aside from any short positions.
Remember, Paradisers, sustainable trading success comes from patience and disciplined execution. There is no need to rush. Waiting for confirmation will always keep you on the winning side. Be smart, wait for the right setup, and always trade like a professional. This is the only way you will make it far in your crypto trading journey.
MyCryptoParadise
iFeel the success🌴
