JASMY at a Breaking PointYello, Paradisers! Have you been watching JASMY closely? If not, you might be about to miss one of the most explosive opportunities we've seen in recent days. A major breakout or breakdown is brewing, and the market is preparing for a decisive move!
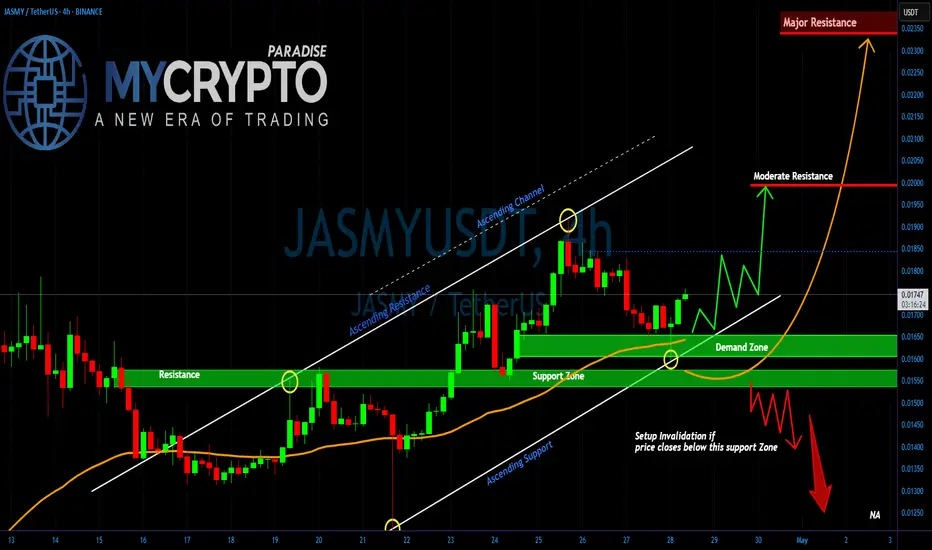
💎Right now, #JASMYUSDT is sitting above a critical Demand Zone after successfully flipping a strong historical resistance into support. Price action is following an ascending structure, respecting both the Ascending Support and the broader Ascending Channel pattern. As long as the price continues to hold this support region and maintain the bullish market structure, there is a high probability of a breakout towards the Moderate Resistance level around 0.01994. A clean break above this area could fuel a sharp rally straight towards the Major Resistance zone at 0.02337.
💎However, caution is absolutely necessary here. If JASMY fails to hold the current Demand Zone and we see a confirmed close below the support at 0.01540 level, it would invalidate the bullish setup. In that case, a rapid sell-off is likely, with downside targets opening towards the 0.01397 region and possibly even lower levels. This would create a high-risk environment where inexperienced traders could get trapped very quickly.
Stay focused, Paradisers. Be the hunter, not the hunted.
MyCryptoParadise
iFeel the success🌴
Cryptosignals
AVAX Analysis: Building Up for a Potential Breakout🔹 Since mid-December, AVAX dropped hard, losing more than 70% from the highs.
🔹 Recently, the coin found strong support around the $15 zone, testing it twice — possibly forming a double bottom pattern.
🔹 At the time of writing, price is consolidating right under the neckline and seems to be building momentum for a move.
Key technical points:
• Massive drop from $55 opens room for a stronger relief rally.
• A breakout above the $23 resistance would confirm bullish continuation.
• $18 is now the new support zone — as long as it holds, the bias remains bullish.
• Major target for bulls: $30–31 area.
🚀 Plan: Watching for a confirmed breakout above $23 for potential continuation higher. As long as $18 support holds, dips could be seen as opportunities.

Bitcoin: Short-Term Bullish, but Herd Mentality ReturnsAfter reaching my 75K target, Bitcoin started to recover nicely. In its comeback, it delivered two important bullish confirmations:
➔ First, it broke above the descending trendline around 84K.
➔ Then, it made a small consolidation, followed by a new leg up that pushed the price above the critical 92K technical zone — also reclaiming the psychological 90K mark.
At the time of writing, the price holds well above horizontal support. From a technical perspective, as long as the 90-91K area remains intact, we can expect higher prices. The next big resistance is around 100K, and if support holds, we might see Bitcoin testing that zone again in the coming days.
Speculators could look to buy dips as long as the structure stays healthy.
My take:
Even though the setup looks technically decent, I'm personally staying out for now. Once again, the crowd is shouting that "the correction is over" and "it's time to buy" — a classic red flag in market psychology.

TAO/USDT.P Short Setup – Riding the Downtrend with PrecisionTrade Details:
Leverage: CROSS 15x - 20x
Entry: 348 - 351 USDT
Stop: 361.1 USDT
Targets:
TP1: 332 USDT
TP2: 319 USDT
TP3: 300 USDT
Why This Trade Makes Sense:
✅ Risk Management: Stop-loss placed at 361.1 USDT ensures protection above the supply levels.
✅ Strategic Targets: The targets are set at key support levels (332, 319, and 300 USDT), where price is likely to react.
Final Thought:
With tight risk management and logical profit-taking targets, it offers a solid chance to ride the market lower. Patience and discipline are key—keep an eye on price action and stick to the plan!

SUI/USDT.P Short Setup — Ride the Wave to Profits!Trade Details:
Entry: 3.56 - 3.6 USDT
Stop-Loss: 3.6935 USDT
Take-Profit Levels:
TP1: 3.4215 USDT
TP2: 3.2700 USDT
TP3: 3.0640 USDT
With clear targets set and a tight risk management strategy, this setup offers a great opportunity to ride the wave of the market’s next move.
Patience and discipline are key. Stay focused, follow your plan, and let's make this trade count!

XRPUSDT on the Edge: Is a Major Breakdown Coming? Yello Paradisers! Are you ready for what could be a huge bearish trap unfolding right now on XRPUSDT?
💎Currently, XRPUSDT is flashing serious warning signs. The formation of a rising wedge pattern is significantly increasing the probability of a bearish move. When analyzing the broader market structure, it appears this recent uptick is merely a retracement within the larger bearish trend—keeping the probability on the bearish side still very high.
💎If XRPUSDT bounces, grabs liquidity and starts forming clear bearish patterns from that resistance area, it could set up an excellent opportunity with a high risk-to-reward (RR) ratio for shorts.
💎However, if the price breaks out and closes a candle clearly above the resistance zone, our bearish thesis will be invalidated. In that case, it would be much smarter to stay patient and wait for a more reliable price action setup before considering any new trades.
🎖Remember Paradisers, the key to surviving and thriving in this market is to stay disciplined, patient, and smart. Trade what you see, not what you feel! Stick to the plan, and never rush decisions under emotional pressure. Play it safe, and stay focused—our time will come!
MyCryptoParadise
iFeel the success🌴

BTC Setup: Scalp Shorts Active Below 97.5K BTC is currently facing strong resistance around the 97.5K area on the daily timeframe.
As long as BTC stays below 97.5K on a daily closing basis, I am expecting a potential pullback move.
📉 There is a chance of a wick or sharp move down toward the 92K zone, which could provide good scalp short opportunities.
📈 However, a clear breakout and daily close above 97.5K would invalidate this short idea and shift the bias back to bullish continuation.
Trade Plan:
🔻 Below 97.5K = Look for scalp shorts with strict risk management.
🔼 Above 97.5K = Exit shorts and watch for bullish setups.
Always remember: Protect your capital and stick to your plan! 🎯
⚠️ Disclaimer:
This is not financial advice. This post is for educational purposes only. Always do your own research and manage your own risk before entering any trade.

XRP break 2.24 bullish, is not, as low as $1.28Traders,
I have to make this quick I was bit by a brown recluse and put it off for a day or two longer than I should have. So I need to Skedaddle to the hospital super quick and fast!
Ok, here’s how I see it. I’m going to post this as a short to mid term trade but explain the long term possibilities. Considering this post is being done via my Moble rather than PC it just doesn’t make sense with my time and options.
so here’s what you’re gonna get the short term trade which I’ve labeled very clearly on the chart and the larger timeframe includes an Elliot wave analysis being that we clearly have a zigzagging consolidation wave that could do one of two things from here if we break about $2.24 we should be starting the next expansion wave. I will do an update if we do do that on this published trade to give an idea of where the price action could go but my immediate thoughts range from $9 to $27.
However, I want everybody to be cautious of a fake out as we are seemingly getting bullish on the weekend which I will be checking liquidity on all of the major alt coins and bitcoin before the weekend is over on our VIP live trading class that we do at 7 o’clock on Sunday night Eastern standard time. Yet, I will share my findings of the liquidity with everyone for this week only. As we definitely want to help as many newcomers and experience, traders, see manipulation, just in case it shows up before it plays out. There are many tools on trading view to find high buildup of large liquidity that the market makers could sweep down and take out if during this weekend we get really bullish And tons of money comes into the market from people’s tax returns, creating a pool of guppies that the market maker may just eat up one more time.
Which brings me to my thought of us potentially revisiting the .65 fib, the .618 or even all the way down to the .5 fib, which is at around $1.23. Nothing in trading is 100% so take my thoughts and stride. yet, I’ve been through three bull runs as a successful trader and market manipulation has been one of my main focuses purchasing mini subscriptions to different tools that give me information so we can take advantage of what the market maker does as opposed to be part of its liquidity grab.
For everyone reading this in the VIP group as you know normal time on Sunday, we will be having the recorded Zoom meeting, but I highly suggest that you make it because this is going one of two ways and there’s a big opportunity here to make some pretty serious pips in my opinion. If you’re not part of our group, I hope you use this information wisely in your research to come up with your decisions, but keep in mind, we are all just here for entertainment purposes! Following every single word from a trader online should never be your gospel to put tons of your money into the market in which ever way that trader is preaching the market will go. Learn risk management, if you don’t feel confident in the research that you’re doing or the traders that you are following are pointing at different directions just make sure you know why they’re pointing in that directions as it could quickly go both ways as we’ve seen recently. With that being said also know that the market maker always goes for liquidity point blank and simple! This is why the majority of traders are unsuccessful in this game because the easy information to learn online for free teaches you stuff that large trading firms have algorithms to find And come sweep in your losses to their profits.
I can’t necessarily say that the exchanges are our biggest worry, but it’s always made me believe most likely they are considering most of these exchanges are also trading as market makers, probably some insider trading with alot of them. The current element of little laws and wishy washy regulation (as much as it will likely stunt this bull run for a few months, or maybe not… being that Trump has given US regulating agencies 180 days from January to have firm regs in place) albeit, Some that are reading this, I’m sure take advantage of it yet, once it’s set in place we will have a little less wild, wild West and less decent traders in traditional markets who hate crypto because of the manipulation and the rug poles and what not will and I’m just guessing here most likely have a clear path to becoming a more profitable trade.
I’m not here to demonize exchanges just keep in mind they have all of the information that you have Placed on their exchange and given them freely by checking off the terms of service and signing up for your account. Lots of these exchanges still have very little regulation and trust you, Me that they are raking in as much as they possibly can to the extent of the little regulation in the country, they are regulated in if they are even bound to abiding by it, as I’m sure, as we know, some folks have already been arrested and indicted for certain things that I will leave for you to search and find on your own. But, my point being is you need to also be very careful of the exchanges that you choose.
In my best opinion, the exchanges with the most amount of liquidity on them makes it more difficult for manipulation to happen yet, it sure still does!
As always friends, stay profitable and I hope this rant that I just went on, helps you in someway over this Easter weekend and I pray you all have an amazing time with your families and if not, then have an amazing time trading and I hope my words have helped!
Stay Profitable,
Savvy

DOT/USDT About to Explode or Crash?Yello Paradisers! Are you ready for DOT's next explosive move, or will you be caught in the trap again? Right now, #DOTUSDT is sitting at a key decision point inside a textbook ascending channel — and what happens next could either print profits or wipe out the unprepared.
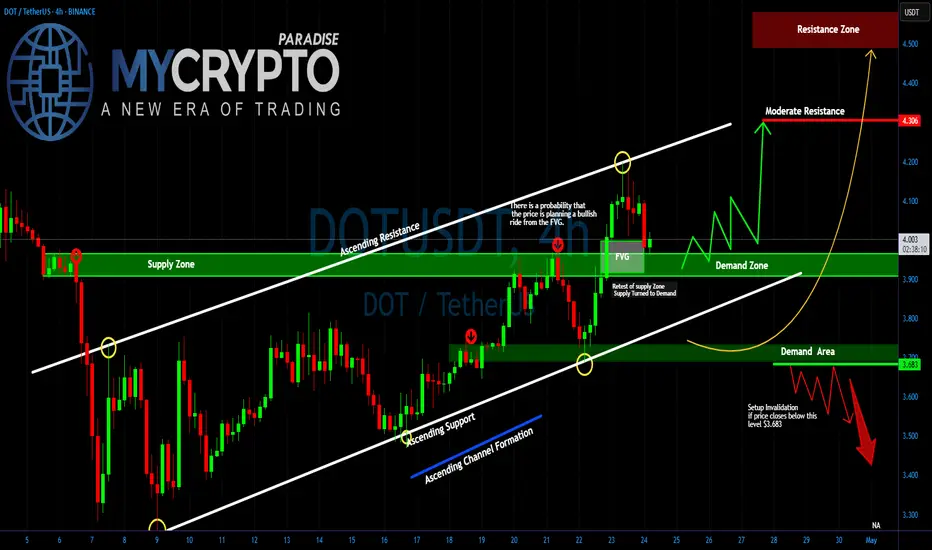
💎After respecting both the ascending resistance and support lines with high precision, it has now pulled back into a crucial area of interest: the Fair Value Gap (FVG). If DOT continues to hold above this level, the probability of a bullish continuation increases significantly. The area around $3.90–$3.95 is aligning perfectly with the demand zone, adding to the confluence and giving bulls a strong foundation to build on.
💎However, the real test lies ahead. POLKADOT must clear the immediate resistance around $4.10–$4.30 for the bullish momentum to gain traction. A successful break and retest of the $4.30 level would likely open the doors to a fast move toward the high-value resistance zone at $4.50 and above.
💎But here’s the twist: if DOT fails to defend the demand zone and instead closes below $3.683, the entire bullish setup becomes invalid. Such a breakdown could trigger a deeper correction, targeting the $3.40 region and possibly flushing out the overleveraged players in the process.
Stay focused, Paradisers. Be the hunter, not the hunted
MyCryptoParadise
iFeel the success🌴
Solana – Bear Market Rally or Reversal?Like the rest of the crypto market, Solana started rebounding on April 8th, pushing more than 50% up from the recent lows. But just like with many altcoins, I'm not convinced this is a true trend reversal. Instead, it looks more like a classic bear market rally.
Let’s not forget: SOL is coming down from nearly $300. A bounce from $95 to $150 is strong, yes—but in the bigger picture, it’s still just a correction.
📍 Key resistance zone: $160–$170
As long as price remains under this zone, the probability of another leg down remains high.
🧠 My plan:
If Solana creates a new local high around $160, I’ll be looking to sell into the rally.
🎯 Target:
$100 at least, depending on how the market reacts.

ETH Rejection Incoming? Don’t Fall for This Bull TrapYello Paradisers, are you watching how ETH is reacting right now at this key zone? This could either turn into a textbook bearish setup… or catch everyone off guard. Let’s break it down 👇
💎ETHUSDT is currently hovering at a critical resistance area, perfectly aligned with both a key Fibonacci retracement zone and the 200 EMA—classic confluence. What makes it even more concerning is the bearish divergence, which is strengthening the probability of a downside rejection from this level.
💎To add fuel to the fire, the price action has just taken liquidity (inducement) above the previous highs, another bearish signal that supports the idea of a potential reversal from here.
💎However, this bearish bias will be fully invalidated if ETH manages to break and close a candle above the resistance zone. That kind of price action would suggest strength from buyers and a likely continuation to the upside.
💎In that case, it’s wiser to stay patient and wait for a cleaner setup at a better price. Rushing into a trade at this stage, especially in a moment of indecision, is not how pros operate.
If you want to be consistently profitable, you need to be extremely patient and always wait only for the best, highest probability trading opportunities.
MyCryptoParadise
iFeel the success🌴

JASMY: Will You Catch the Breakout or Get Caught in the Trap?Yello Paradisers, did you catch the textbook pattern quietly forming on JASMY while most of the market remains distracted? Because what comes next could catch the majority off guard.
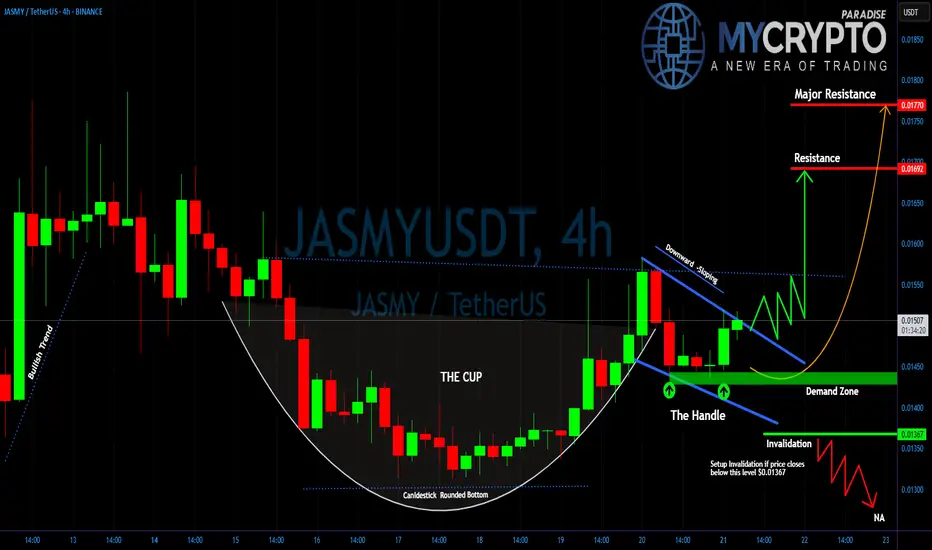
💎#JASMYUSDT is currently forming a classic Cup and Handle pattern. After a strong impulsive move, the price retraced in a rounded bottom structure, completing what now looks like the cup. The current consolidation has created the handle a downward-sloping corrective move that’s showing early signs of exhaustion.
💎What adds even more strength to this setup is that the price is now trading above both the 50 EMA and 200 EMA on the 4H timeframe. This signals a solid bullish bias and confirms that the overall momentum remains in favor of the bulls. When the price holds above both moving averages during a consolidation phase, it often indicates that a strong continuation move is brewing.
💎The price is also respecting a well-defined demand zone between 0.01430 and 0.01450. As long as this area holds, the probability of a bullish breakout remains high. A break above the descending handle resistance will be the first true confirmation.
💎If that breakout is supported by volume and sustained price action, we expect a move toward the first resistance at 0.01698. Beyond that, the final target for this pattern lies at the major resistance zone around 0.01785, where significant selling pressure could return. However, discipline is key. If JASMYUSD breaks below 0.01367, the handle structure would be invalidated.
Stay focused, Paradisers. Be the hunter, not the hunted
MyCryptoParadise
iFeel the success🌴
APT Is Squeezing Into a Reversal Pattern at a Key Weekly Level!Yello, Paradisers! Is #APT quietly gearing up for one of the cleanest reversal plays we’ve seen in weeks?
💎After a long, relentless downside trend, APT is now starting to show signs of life. The price action is compressing inside a classic falling wedge pattern, and more importantly, this is happening right at a weekly key level — the kind of setup that usually leads to significant shifts when confirmed.
💎What’s adding more weight here is the emergence of a bullish divergence on the indicators, suggesting that while price has been making new lows, momentum has already begun to turn. That’s often one of the first early signs of a coming reversal and it’s starting to gain strength.
💎#APTUSDT is now pressing against a decisive resistance zone. The price is testing the 12-hour EMA-50, currently sitting around $5.33, and just slightly above that, the wedge breakout trendline stands at approximately $5.45. These two levels are acting as the immediate gatekeepers for a bullish shift.
💎Breaking through both of these zones will be crucial. If the bulls succeed, we can expect a push toward the $7.00 – $7.35 region — a zone where short-term traders may look to take profits. However, if the momentum continues, the bigger step lies ahead.
💎A sustained breakout could carry APT to the pattern target of $8.75 – $9.25 area. This is a strong resistance zone and this is where things get more challenging. The resistance in this range is reinforced by multiple technical confluences, including the 50% Fibonacci retracement, which often acts as a magnet but also a serious barrier during recoveries.
💎On the flip side, support remains solid. Immediate support is at $4.95, while beneath that, APT sits on a major structural base that has historically held firm. Sellers will need serious volume to crack below this foundation and for now, that pressure isn’t there.
Paradisers, strive for consistency, not quick profits. Treat the market as a businessman, not as a gambler.
MyCryptoParadise
iFeel the success🌴

#HBAR Current Setup Showing Warning Signs | What's Next?Yello Paradisers! Is #HBAR teasing one last move up before everything collapses? Let’s break down what this suspicious structure on #Hedera is telling us:
💎#HBAR is currently trading at $0.183, sitting just beneath a heavy resistance zone around $0.190–$0.200. Price has been unfolding inside a clear Ending Diagonal structure—one of the most deceptive patterns in technical analysis. Wave 5 is still technically in play, but momentum indicators and volume behavior are telling a different story.
💎Volume has been steadily declining even as the price has been climbing, which is never a good sign this deep into a wedge pattern. On top of that, the RSI is pushing into overbought territory, showing that buyers are pushing the market higher, but with weakening strength behind them.
💎The resistance zone above current price is absolutely key. If #HBARUSD manages to break above the red zone and sustain momentum above $0.200, this would invalidate the current bearish setup and could open the door for an impulsive extension toward $0.220 and even higher. However, that scenario currently remains the less likely one unless we see a clear and strong breakout above the zone backed by volume.
💎Until then, bears are in control of the probabilities. The market structure favors a reversal from the Ending Diagonal, and if that plays out, the move could unfold quickly. First, we’ll be watching how price reacts at $0.142, which is the first major support and likely target if the wedge breaks down. A confirmed close below that level would likely lead to a continuation of the drop, with the next strong support zone near $0.125. This area has acted as a solid demand level previously and is also the region where the Volume Profile starts to spike again.
Play it safe, respect the structure, and let the market come to you!
MyCryptoParadise
iFeel the success🌴

ETH Bulls Might Have a Shot – Tight Range Before the Breakout📅 What just happened on ETH?
Ethereum recently printed a local bottom just below 1400 – a level that felt unthinkable just a few months ago. But as it often happens in crypto, the unexpected became reality.
💡 What came next?
From that low, ETH bounced strongly, signaling the start of a natural correction. While I personally don’t believe this is the final bottom, I do see opportunity on the upside.
🧐 What the chart tells us:
Sharp reversal from under 1400
Quick drop but failed continuation lower
Current tight consolidation, which often leads to breakout setups
🧠 My view:
Right now, this looks like a temporary bottom, and until proven otherwise, I’m interested in buying the dip. As long as the structure holds, bulls might have the upper hand short-term.
🎯 My Trading Plan:
Looking to go long, with 1800 as my target.
Risk-Reward? I’m aiming for at least 1:2, so I’ll be waiting for the right entry signal before jumping in.

FARTCOIN/USDT.P – Smells Like a Clean Short Entry’s cooking, and this setup is dripping with RR juice. Let's break it down:
📍 Entry Gameplan:
Short Zone: 1.0660 – 1.0710
SL: 1.1195 (tight and right above the wick)
TP1: 1.025
TP2: 0.9835
TP3: 0.9055 (send it 💨)
Why I Like This Setup:
That choch ➝ BOS combo? Chef's kiss.
Price tapped into supply and reacted fast = strong sellers present
Beautiful RR — no overcomplications, just structure, imbalance, and timing
This thing's been cooking sideways long enough. Now that it’s broken structure and filled its pockets with early buyers, we might finally see a solid dump.
Let’s see if FART delivers the gas.

GOAT Looks Bullish (12H)It seems that a wave A of a higher-degree structure has completed, and the price is forming a triangle at the bottom, preparing for an upward movement in the form of either a wave B or a new impulse wave. Since this wave belongs to a higher degree, we expect the upcoming bullish wave to take time and show a significant upward retracement.
Try to avoid entering during pumps, and instead focus on entries during price corrections.
As long as the green zone holds, the price has the potential to move upward.
A daily candle closing below the invalidation level will invalidate this outlook.
For risk management, please don't forget stop loss and capital management
When we reach the first target, save some profit and then change the stop to entry
Comment if you have any questions
Thank You

Why Dogecoin Just Reached a MAJOR Price Floor in 2025!Dogecoin (DOGE), the beloved meme cryptocurrency, has just reached a critical demand zone at $0.151—its strongest weekly demand level in years! This key price floor signals a major opportunity for investors, as historical data suggests a strong bullish reaction could follow.

BITCOIN - Bullish Double BottomHello Traders !
The BTC price formed a double bottom pattern.
Currently, The neckline is broken !
So, I expect a bullish move🚀
______________
TARGET: 88700🎯

FINAL LEG OF THE ZIGZAG CORRECTION ?Yello, Paradisers! Are we about to see the end of this correction, or is there still one more shakeout coming? Let’s break it down.
💎The market is currently unfolding within a Zigzag Correction (A-B-C) pattern, and we appear to be in Wave C the final leg of this structure. Wave A has already played out with a sharp downward move, followed by Wave B, which acted as a countertrend rally. Now, Wave C is in progress, forming the last phase of this corrective cycle.
💎Since this is a 5-3-5 Zigzag Correction, the third wave of Wave C has already developed, meaning the market is nearing a critical Demand Zone at 4.0283. This level is a strong support zone where a potential reversal could occur. If the price reacts positively from this area, it could mark the end of the correction and signal the beginning of a new bullish phase, starting Wave 1 of the next uptrend.
💎However, if the price remains trapped between the Moderate Support and Moderate Resistance zones, we may see an extended period of sideways consolidation before any decisive move. A key confirmation to watch is the RSI approaching oversold conditions, which would indicate that downward pressure is weakening and the probability of a bullish reversal is increasing.
As always, Paradisers, the key to profiting in this market is waiting for high-probability setups. If this correction is indeed ending, the next move could be explosive. Stay sharp, stay disciplined, and trade smart!
MyCryptoParadise
iFeel the success🌴

Is #XLM Setting Up for a Bull Trap Before a Major Drop?Yello, Paradisers! Is XLMUSD gearing up for a breakout, or is this just a classic liquidity grab before the next major dump? Let’s break it down.
💎Right now, #XLMUSDT is testing a minor resistance at $0.28464, a level where price has repeatedly struggled to push higher. While there is a possibility of a breakout, the presence of strong liquidity around the unmitigated supply zone at $0.31917 suggests that any move higher could be a trap before a significant drop. If price does manage to break above this resistance, traders should be cautious it’s likely just a liquidity grab before a larger move to the downside.
💎Once the price reaches the unmitigated supply zone, a rejection is expected, leading to a downward move toward the key support zone at $0.22699. This level has historically been a strong demand area where buyers could step in, potentially causing a temporary bounce or consolidation before any further downside.
💎As CRYPTOCAP:XLM moves lower, it’s crucial to watch volume activity. If the decline happens with high volume, it will confirm strong selling pressure and increase the likelihood of a deeper drop. However, if the price approaches $0.22699 with low volume, it could indicate a lack of seller conviction, leading to a short-term bounce before resuming the downtrend.
💎The EMA 200 continues to act as dynamic resistance, reinforcing the bearish outlook. As long as price fails to hold above $0.28464 or gets rejected from the supply zone, the bearish setup remains intact. In that case, a move toward $0.22699 and potentially even $0.19151 becomes highly probable. Watching volume reactions at these key levels will be essential to confirm the next move.
💎The only scenario that could invalidate this bearish setup is a strong close above $0.36172 with high volume. That would signal a potential shift in market structure and could indicate renewed bullish momentum.
Paradisers, patience and precision are key in this market. Let the levels guide you, trade strategically, and stay disciplined. Avoid emotional decisions this market punishes the impatient and rewards those who stay focused.
MyCryptoParadise
iFeel the success🌴

SOLUSDT Breakdown WarningYello Paradisers! Have you spotted what’s happening with SOLUSDT right now? A major breakdown just played out, and this could be the beginning of a much deeper bearish move that many are underestimating.
💎SOLUSDT has broken down from a rising wedge pattern—an important bearish structure that often signals upcoming downside pressure. Before the drop, it swept liquidity, a typical smart money move, and has now confirmed a bearish Change of Character (CHoCH). This combination significantly increases the probability of further decline.
💎If we see a pullback into the resistance zone—it could offer a strong short opportunity with good risk-to-reward ratio. That’s where professional traders start looking to position themselves carefully.
💎However, this bearish idea has a clear invalidation point. If price breaks out and closes a candle above that invalidation level, then the bearish outlook becomes void. In such a case, it’s wiser to stay patient and wait for more precise, high-probability setups to develop.
🎖Strive for consistency, not quick profits. Treat the market as a businessman, not as a gambler. Stay disciplined, Paradisers, and wait only for the cleanest, most reliable trading opportunities. That’s how you make it in this game.
MyCryptoParadise
iFeel the success🌴

Is PEPE About to Explode? Critical Breakout Level Incoming!Yello, Paradisers! Are you ready for what could be the breakout #PEPE bulls have been waiting for since February?
💎After a long, painful downside grind, PEPE is finally shaping up for a potential bullish reversal. The price action has entered an ascending triangle, often a reliable pattern that hints at an incoming breakout. This setup is now flashing signals that momentum is shifting but it all hinges on one critical zone.
💎#PEPEUSDT is currently eyeing the $0.0000088 – $0.0000090 region, a heavy resistance that’s proven itself multiple times since February 24th. Bulls have failed to conquer this level on several occasions, and now, the 12-hour EMA-200 is also sitting in this area, a dynamic resistance reinforcing this as a crucial inflection point.
💎If the bulls can finally break through $0.0000090 with clear volume confirmation, PEPE could open up upside potential towards $0.00001135. This level is likely to attract some short-term profit-taking, but if momentum holds, we could see a push towards the much stronger $0.00001400 – $0.00001490 zone. This region lines up with a multi-point confluence, including a significant horizontal resistance and the 38.20% Fibonacci retracement level — both strong technical barriers that may define the next major move.
💎Support is also well-defined for now. The 12-hour EMA-50 is acting as dynamic support and currently sits around the $0.00000720 level. PEPE has been respecting this level well, and any temporary pullbacks may bounce from here. Below this, the $0.00000650 – $0.00000570 range remains the key support zone. This zone held firm during the last dips and is likely to absorb any upcoming selling pressure if the breakout fails short-term.
Paradisers, strive for consistency, not quick profits. Treat the market as a businessman, not as a gambler.
MyCryptoParadise
iFeel the success🌴
