BANDUSDT Breakdown or Reversal?
Yello, Paradisers. Have you been watching #BAND lately? The setup is tightening, and it’s only a matter of time before a major move plays out one that could trap both early bulls and stubborn bears. The key now is preparation, not prediction.
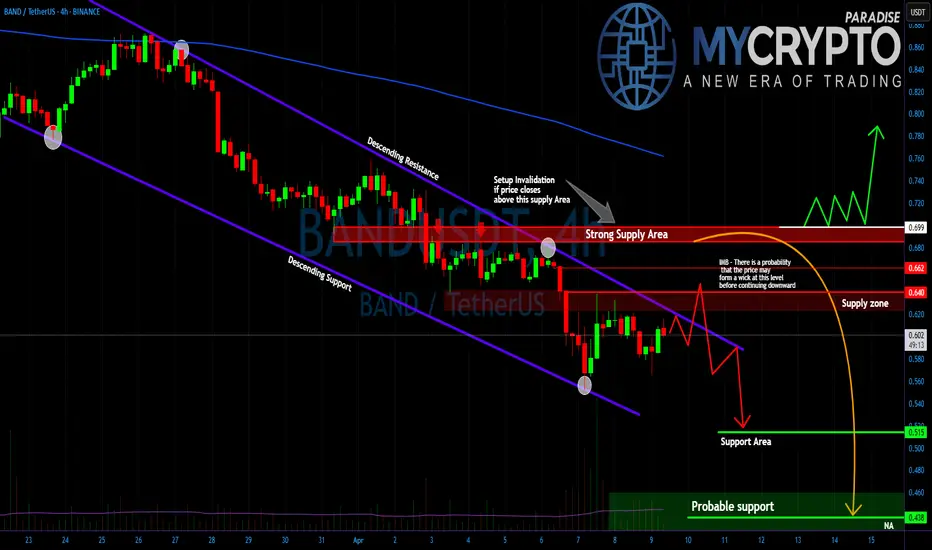
💎#BANDUSDT continues to move within a clean descending channel, respecting both trendline resistance and support. The broader structure shows a clear downtrend, and at this stage, there's a strong probability that price may first push upward with a wick to fill an existing imbalance only to reject and continue lower. These kinds of deceptive moves are common during market weakness and are often designed to trap breakout traders before the real direction is confirmed.
💎#BAND price remains firmly below both the 50 and 200 exponential moving averages, which confirms that the larger trend is still bearish. The 50 EMA is currently acting as dynamic resistance, capping any short-term upside attempts. Meanwhile, the 200 EMA adds further weight to the bearish case, as price has consistently failed to reclaim or hold above it.
💎The most important level to the upside is 0.699. This is a clear supply zone, and unless the price can break and sustain above this level and reclaim both EMAs there will be no real shift in market sentiment. On the downside, 0.515 remains a critical support level. If price holds here, a short-term bounce is possible. However, if 0.515 breaks with momentum, the next key downside target becomes 0.438, marking a deeper markdown phase.
Stay focused, Paradisers. Be the hunter, not the hunted.
MyCryptoParadise
iFeel the success🌴
Cryptosignals
SUSDT Still in Trouble – Is the Worst Yet to Come?Yello, Paradisers! Are you letting this short-term bounce on #SUSD fool you? Be careful. What looks like a recovery could just be a deceptive pause before the next major drop hits.
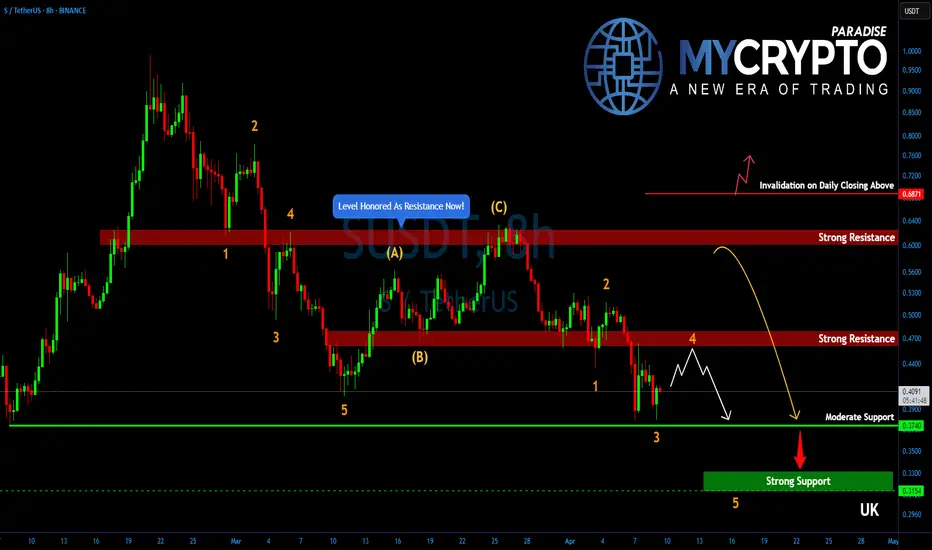
💎After topping out just shy of the psychological $1.00 mark, SUSDT has entered a significant zigzag corrective structure. Despite the recent bounce, the bigger picture still suggests that the market is setting up for one more leg to the downside, where the real bottom might finally be reached.
💎#SUSDT has printed a short-term double bottom around the $0.38 level, positioned slightly above a moderate support zone. This has triggered a minor bullish push, offering a temporary sense of relief for bulls. However, based on the current market structure, this move is likely to be short-lived and part of a broader corrective pattern.
💎The resistance zone between $0.465 and $0.4720 is now the key level to watch. It’s a strong supply area where selling pressure is expected to return with intensity, making it difficult for buyers to gain control. If price gets rejected from this zone, a drop back toward the $0.3740 level is highly probable, as this area serves as the next moderate support.
💎The structure on SUSDT is far from done to the downside. If the rejection plays out as expected, the price could slide even lower, targeting the $0.3300 to $0.3150 range. This is where the final drop may conclude and a proper base for recovery could finally be established.
Paradisers, strive for consistency, not quick profits. Treat the market as a businessman, not as a gambler.
MyCryptoParadise
iFeel the success🌴
Fil has BottomedTraders,
Like it or love it, this is an unpopular opinion in a sketchy time in the market. Regardless, our team thinks we have bottomed for alt, its discount season! You name it and it is at the bottom!!
We hope you enjoy a little hopium in these uncertain times!!
Stay Profitable,
Savvy!

Is DOGE About to Crash Hard From This Trap Zone? Read Before LONYello Paradisers — could this be the perfect bull trap setting up before a bigger drop? Our previous analyses warned about these kinds of setups, and once again, DOGEUSDT is flashing multiple signals that suggest a high-probability reversal could be just around the corner.
💎Currently, DOGEUSDT is trading right inside the golden Fibonacci retracement zone, a level that often acts as a powerful area of rejection. What makes this zone even more significant is the confluence of additional bearish indicators aligning at the same point. Both the 100 and 200 EMAs are present, reinforcing dynamic resistance, and there are clear Fair Value Gaps (FVGs) visible on both the 4H and Daily timeframes. On top of that, a bearish divergence has now formed, signaling early exhaustion in bullish momentum and further reinforcing the potential for a downside move.
💎When these elements align, the probability of a rejection increases substantially. However, we’re not jumping in blindly. If DOGEUSDT starts to bounce from here and shows weakness—such as stalling below resistance—then we’ll be closely watching for confirmation patterns like a double top or a head and shoulders. These would not only validate the bearish narrative but also offer significantly better risk-to-reward ratios for short setups.
💎That said, every setup has its invalidation. If price breaks and closes candle above our invalidation level, then the entire bearish scenario must be considered void. In that case, the best approach would be to stand aside and wait for a cleaner structure to form before taking any action. There’s no reason to force a position in uncertain conditions.
If you want to be consistently profitable, you need to be extremely patient and always wait only for the best, highest probability trading opportunities.
MyCryptoParadise
iFeel the success🌴

ETHEREUM (ETHUSD): Strong Bullish Move Ahead?!
It looks like we have a valid liquidity grab after a test
of a key weekly structure on Ethereum.
After a false violation of the underlined area,
the price formed a cup and handle pattern
and violated its neckline with a bullish imbalance on an hourly chart.
I think that the market can remain bullish and reach at least 1700 level.
❤️Please, support my work with like, thank you!❤️

Will #SHIB Continue Pumping or a Bull Trap is Waiting for Bulls?Yello, Paradisers! Will #SHIBUSDT continue flying, or are we about to witness a brutal rejection straight into the demand abyss? Let’s break it down.
💎#SHIB has recently broken out of a Descending Broadening Wedge Formation on the 4H chart, a pattern that historically signals potential bullish reversals. This breakout was strong, but the price has now hit a critical Supply Zone between 0.00001530 – 0.00001650, and has already shown signs of rejection from this area.
💎The structure shows #SHIBUSD facing Strong Resistance just below 0.00001711—a level that acts as Bearish Setup Invalidation. If the price closes decisively above this zone, bears will lose control, and we could see a sharp squeeze up toward 0.00001900.
💎However, the more probable scenario for now is a retest and rejection from the supply zone, followed by a deeper pullback. Based on volume profile and historical price behavior, the Support Zone around 0.00001181 is a key level to watch for a possible bounce. If this level is lost, SHIB could fall to sweep the swing low (SH) at 0.00001081 to complete a liquidity grab before resuming any bullish trend.
💎RSI is currently near overbought territory, suggesting SHIB may be due for a short-term correction or consolidation. This lines up with the visual expectation of a potential ABC correction back into support, where Wave A has started and Wave B might complete soon.
Patience and precision are key in these conditions wait for strong confirmation before making your moves.
MyCryptoParadise
iFeel the success🌴

Crypto Sell-Off: Is Solana Headed for $80?Without a doubt, Solana was the hottest topic in the crypto market last year and at the start of this one—especially with the meme coin craze.
However, after peaking near $300, the price began to decline in what initially appeared to be a normal correction. But once Solana broke below the $200 mark, things turned ugly, and the price quickly dropped to the key $120 support zone—a level that held strong over the past year.
Now, it looks like Solana is on the verge of breaking below this support, which could trigger an acceleration toward $80, with the $100 psychological level as an intermediate stop.
________________________________________
Why the Downside is Likely to Continue
📉 Bulls Can’t Hold Gains – Short-term rallies are fading fast, showing a lack of real buying strength.
📉 Bearish Engulfing Candle – Yesterday’s price action printed a lower high, adding further pressure on support.
📉 $120 Breakdown Incoming? – If this level fails, expect a sharp decline toward $80.
________________________________________
Trading Plan: Selling Under $130
🔻 Sell Rallies Below $130 – Targeting a move to $80 in the medium term.
🔻 Only a Sustained Move Above $130 – Would shift Solana to a neutral stance—not bullish by any means.
For now, the bearish pressure remains, and selling rallies is the strategy to follow. 🚀

Is This the Final Drop Before a Major Reversal? Read This NOW! Yello, Paradisers! Are we about to witness the final leg of this move, or is one last shakeout coming before a massive reversal? Let’s break it all down using Elliott Wave principles.
💎Wave 1 initiated the downtrend, marking a strong sell-off from higher price levels. Volume surged during this phase, signaling institutional selling and overall market panic. This aggressive downward move set the foundation for the corrective Wave 2.
💎Wave 2 began as the price rebounded after hitting the local low at $1.406. This move aligns with a typical Elliott Wave correction, often retracing 50%–61.8% of Wave 1. The recovery phase pushed the price back up, potentially reaching as high as $1.964 before the next major move.
💎Wave 3, the strongest and longest in the sequence, started once the price failed to sustain above $1.964. This move could extend all the way down to $0.809, a critical level where selling pressure is expected to peak. Historically, volume is highest during Wave 3, indicating aggressive selling and potential accumulation zones forming.
💎Wave 4 might be unfolding right now, forming a short-term recovery. If the price retraces toward $1.392 but fails to break above it, the bearish wave count remains intact. It’s crucial to note that Wave 4 must NOT enter the price range of Wave 2—if it does, the entire Elliott Wave structure is invalidated, suggesting an alternative pattern like an ending diagonal or a larger correction.
💎Wave 5 is the final impulse wave. If Wave 4 faces rejection below $1.392 and consolidates, the market could see the beginning of Wave 5, pushing price toward the $0.746 support zone. This phase typically marks the last exhaustion move before a potential market reversal or a shift in structure.
Patience and strategy win the game, Paradisers! The market is designed to shake out weak hands before the real move happens.
MyCryptoParadise
iFeel the success🌴

ARBUSDT: What Happens Next Could Shock ManyYello, Paradisers! Are you watching this key level hold by a thread? The market is giving us signals, but most traders are too distracted to see them. If you're not careful here, you’ll be on the wrong side of the next big move.
💎ARBUSDT is currently trading below both the 50 EMA and the 200 EMA, confirming a strong bearish bias in the market. The trend remains in a clear markdown phase, with price action continuing to respect the descending channel, and no clear signs of bullish reversal just yet.
💎We’re approaching a moderate resistance level around $0.32 has already shown signs of weakness if price fails again at this area, it will likely confirm that sellers are still dominating, increasing the probability of a renewed leg down.
💎If the market rejects at current levels, the first key support to watch is around $0.2847, which could be hit quickly. However, the real danger lies below. A breakdown beneath the $0.2847 zone would expose the market to significant downside pressure, opening the path for a much deeper correction.
💎With ARB trading below the 200 EMA, we must remain cautious. The trend remains bearish, and any short term rally into resistance is more likely to present a shorting opportunity than a bullish breakout.
💎Still, if the market manages to close decisively above the $0.35 mark, it could shift the structure and momentum, targeting $0.37 and higher in the short term. Until then, the bias remains with the bears.
Stay focused, Paradisers. Be the hunter, not the hunted.
MyCryptoParadise
iFeel the success🌴

SUSHI is Bleeding Out — Is This the Calm Before the Final Dump? Yello, Paradisers! Have you been ignoring SUSHI lately? That might be a mistake — because the price action is showing signs that a deeper drop could be just around the corner, and those not paying attention could get caught off guard. Let’s break it down.
💎#SUSHIUSDT is still trading below both the 50 EMA and the 200 EMA, a clear confirmation that the broader market structure remains decisively bearish. The 50 EMA continues to act as dynamic resistance, repeatedly rejecting price during short-lived pullbacks, while the 200 EMA sits significantly higher, further emphasizing the strength of the existing downtrend.
💎Adding to the bearish pressure, there’s a strong supply zone between $0.620 and $0.640. This zone has capped every bullish attempt, confirming heavy distribution at these levels. Until this zone is broken with volume and conviction, upside potential remains extremely limited.
💎One key level to watch in the short-term is the 50% Fibonacci retracement at $0.586, which has turned into a reliable interim rejection level. We expect the price to tap this level again before any meaningful downside continuation is likely to unfold.
💎As long as price fails to close above the $0.568 level, the structure will remain under pressure. A breakdown below the moderate support at $0.522 would likely trigger a move into the $0.485–$0.451 major support zone, where we could see more aggressive buyers or a potential reversal setup.
💎The only scenario that would invalidate this bearish outlook is a clean breakout and sustained close above $0.640, which would reclaim the supply zone and force shorts to cover. Until then, the path of least resistance remains to the downside.
Stay focused, Paradisers. Be the hunter, not the hunted.
MyCryptoParadise
iFeel the success🌴

ZROUSDT – Short SetupI'm taking a short position on #ZROUSDT after a Break of Structure (BOS) confirmed a shift in market direction, following a Change of Character (Choch).
Price retraced into the 15-minute Fair Value Gap (FVG) and tapped into the premium zone near the 0.5–0.618 Fibonacci level, offering a good entry for a short setup.
Entry: Around 2.98
Stop Loss: Above 3.07
Target: 2.88 - 2.8 - 2.67
Risk/Reward Ratio: 1:3.4
Waiting for follow-through to the downside. Trade safe and always manage your risk.

ATOMUSDT – Accumulation Phase with Bullish Breakout Potential!ATOM is currently trading within a key accumulation zone, showing signs of potential reversal after a liquidity sweep below the 2024 bottom support level around 3.63 USDT. This move may indicate the presence of strong demand at lower levels.
As long as ATOM holds above the 3.63 USDT level on a daily closing basis, the bullish scenario remains valid. A sustained move above the 5.15 USDT resistance may confirm the start of a bullish breakout, with potential upside targets at 7.76 and 9.30 USDT.
However, a daily close below 3.63 USDT would invalidate the bullish bias and suggest further downside pressure.
Key Levels to Watch:
Support: 3.63 (bottom support of 2024)
Resistance: 5.15 (accumulation zone breakout level)
Bullish Targets: 7.76 and 9.30
The structure remains bullish unless invalidated by a breakdown below support. Always manage risk accordingly.
#ATOM #COSMOS #ATOMUSDT

Is ONDO Gearing Up for a Massive Breakout or Just a Bull Trap?Yello, Paradisers! Is #ONDO setting up for a bullish explosion, or is this just the calm before another dump? Here's what the current price action is signaling, and why this zone could be the final opportunity before a major move…
💎ONDOUSD has remained one of the strongest-performing altcoins, even amid broader market corrections. Since peaking in December, however, it has entered a healthy corrective phase. Currently, the price is forming a falling wedge pattern, and the ABC zigzag correction appears to have completed — an early sign of potential trend reversal.
💎#ONDOUSDT is currently consolidating above a moderate support zone between 0.766 and 0.70, a level that has held firmly since early March. This repeated defense of support, along with the completed correction, is reinforcing the potential shift in market sentiment.
💎If bullish momentum starts building, price is likely to aim towards the descending resistance around the 0.90 level. A confirmed breakout above this area would flip market structure bullish, potentially igniting a trend continuation toward the next resistance range between 1.10 and 1.20.
💎Should this breakout sustain and strength remain, ONDO could target the strong resistance zone between 1.40 and 1.50, which also aligns with the 50% Fibonacci retracement — a critical level where sellers are likely to return.
Paradisers, strive for consistency, not quick profits. Treat the market as a businessman, not as a gambler.
MyCryptoParadise
iFeel the success🌴

SOLUSDT | Elliott Wave Projection – Next big Move Incoming 50%+BINANCE:SOLUSDT
The chart is probably currently developing a five-wave impulsive structure (1)-(2)-(3)-(4)-(5), suggesting a potential bullish movement towards the 174-175 USD resistance zone before a larger correction unfolds.
📈 Bullish Setup:
- A corrective A-B-C structure seems complete, with a potential impulsive wave (1)-(5) forming.
- Price is reacting at a strong demand zone, initiating Wave (1) upwards.
- Possible target for Wave (5) lies near **174-175 USD**.
📉 Bearish Continuation Afterwards
- After reaching the projected high, expect a sharp rejection and reversal.
- The final bearish target lies within the "End of Bear" zone (~108-109 USD).
---
### 🔹 Key Levels to Watch:
✅ First Bullish Target: ~174-175 USD
⚠️ Critical Support Zone: 108-109 USD
---
### 📌 **Trading Plan:**
1️⃣ Long Opportunity: If price respects the current support, target Wave (3)-(5) completion near 174 USD.
2️⃣ Short Confirmation: If price rejects at resistance, a larger bearish wave is expected.
3️⃣ Final Bear Target: 108-109 USD zone for possible long-term support.
🚨 Risk Management:
- Stop-loss below 111 USD for longs.
- Wait for confirmation before shorting after rejection.
💬 What do you think? Will SOL hit 175 USD before the final drop? Comment below!

Is TAOUSDT About to Dump Hard? Yello, Paradisers! Are you paying close attention to this subtle shift on TAOUSDT? Because what we’re seeing right now could easily trap late bulls before the real drop even begins…
💎TAOUSDT is currently displaying clear signs of a potential bearish reversal. We’ve observed a bearish Change of Character (CHoCH) developing from the 1H Fair Value Gap (FVG), which is a strong early indication of weakening bullish momentum. To add to this, price has also broken down below the 50 EMA, a technical signal that increases the probability of further downside movement. When both of these elements align, it’s often a precursor to a more significant pullback.
💎If TAOUSDT revisits the recent Fair Value Gap, the trade setup becomes even more attractive, offering a stronger risk-to-reward ratio. That would be the optimal level for entry. However, even from current price levels, the trade still offers a 1:1 risk-to-reward opportunity. While not ideal, it remains viable for more aggressive traders.
💎That said, the entire bearish setup becomes invalid if the price breaks out and closes a candle above the current resistance zone. In such a scenario, it would be wise to step back and wait for more reliable price action to develop before making any further decisions.
Strive for consistency, not quick profits. Treat the market as a businessman, not as a gambler.
MyCryptoParadise
iFeel the success🌴

ALGO Ready to Break Out—or Fake Out? Watch This Critical ZoneYello, Paradisers! have you been watching #ALGOUSD’s recent moves closely—or are you about to miss the bounce that could catch 90% of traders off guard?
💎After topping out in December 2024, ALGO entered a clear corrective phase. That correction just completed an ABC zigzag pattern right into a strong support region, slightly above its key weekly level—a zone where buyers historically step in.
💎#ALGOUSDT is showing clear bullish reactions between the 0.165–0.145 levels. More importantly, a complex bullish divergence is forming—on both RSI and MACD. This is your first warning sign that the bears are losing steam and bulls are ready to step back into control.
💎On the upside price must break and hold above the moderate resistance zone at 0.22 level. A successful reclaim here would not only validate the divergence but also represent a deviation reclaim, where price recovers a previously broken support level.
💎If this reclaim is successful and supported by volume, the next key zone to monitor is between 0.25 and 0.275. This region carries particular significance, as it aligns with both the descending trendline resistance and the 25% Fibonacci retracement. It is a critical level that will likely determine whether the current bounce evolves into a sustained bullish leg.
💎Should buyers maintain momentum beyond that point, the next upside target lies between 0.365 to 0.380 levels.
Paradisers, strive for consistency, not quick profits. Treat the market as a businessman, not as a gambler.
MyCryptoParadise
iFeel the success🌴

NEAR Breakdown Confirmed! More Blood Before the Reversal?Yello, Paradisers! Is #NEAR about to drop even lower, or is a major reversal brewing? Let’s break it down!
💎#NEARUSDT recently suffered a descending triangle breakdown, sending prices tumbling lower. Adding to the bearish pressure, we’ve also got a death cross formation, reinforcing the weakness in price action. Right now, before NEAR can find any long-term bottom, the probability of further downside remains high.
💎The bulls are currently struggling. Multiple resistance levels are blocking any attempts to gain momentum, with all EMAs currently sloping downward—not a good sign for any immediate recovery.
💎NEAR is expected to slowly bleed into the long lower wick of February 3rd. Strong support exists between $2.65 and $2.40, a key demand zone that could trigger a bullish reversal. But if sellers continue to dominate, they could overpower this level and drive prices down further toward $2.05 - $1.95. This is a major higher time frame support zone, where a long-term reversal could finally take shape.
💎For the bulls to negate this growing pressure, they must break above $4.50—a critical level reinforced by both horizontal and descending resistance. If the price secures a bullish breakout above this, NEAR could be in a prime position to rally over the next few months.
Paradisers, as always, patience and precision are key in this market. This isn’t a time for reckless trades—let the levels guide you, trade strategically, and stay disciplined.
MyCryptoParadise
iFeel the success🌴

SOL/USDT May SOL lose the weekly support? Key Level to buy!Hey traders! 👋 Let’s dive into the weekly chart for SOLUSDT.
📊 Current Price Action:
SOL is trading at $112.20, down 10.96% on the weekly chart. The price has been consolidating in a "Buying Zone" between the weekly support levels of $110.17 and $131.68. This zone has historically acted as a strong base, with the price bouncing from this area multiple times since late 2023.
🟢 Buying Zone and Support:
The current price is sitting in a critical "Buying Zone" between $110.17 and $131.68. This area has acted as a springboard for previous rallies, and if SOL holds above $110.17, it could be a good opportunity for accumulation. A break below $110.17, however, might lead to further downside toward the next support at $80.18 or even $54.00.
🎯 Target:
If SOL manages to break through the $195.71 resistance, the next major target is its previous ATH at $260. I’ve projected a potential move to $295.71, which would be a 95.71% increase from the current price of $112.20. This target aligns with the historical price structure and Fibonacci extensions.
⚠️ Risk Management:
Keep an eye on the $110.17 support. A weekly close below this level could signal bearish momentum, potentially driving the price toward lower supports. On the upside, watch for a strong breakout above $195.71 with high volume to confirm the bullish scenario.
What do you think about SOL’s setup? Are you bullish or bearish on Solana? Let’s discuss in the comments!
#SOLUSD #Solana #Crypto #TechnicalAnalysis #Breakout

PEPE Ready to Dump? This Key Zone Could Trigger a Sharp ReversalYello Paradisers — did you catch the recent shift on PEPEUSDT? If not, now’s the time to zoom in, because the setup is looking primed for a big move, and you don’t want to be caught on the wrong side.
💎PEPEUSDT has broken out of Ascending Channel & shown a clear bearish CHoCH (Change of Character), confirming a shift in market structure. Following that, we’ve now seen a proper pullback. Currently, the price is sitting right at a critical resistance zone.
💎What makes this zone especially significant is the confluence of technical factors stacked at the same level — the 200 EMA, a Fair Value Gap (FVG), and the Fibonacci Golden Zone are all present. This combination significantly increases the probability of a bearish move from here.
💎If PEPE breaks out and closes a candle above our invalidation level, the entire bearish idea gets invalidated.
🎖Paradisers; the next 6–9 months will be juicy for some and painful for others. Discipline, patience, robust strategies, and trading tactics are the only ways you can make it long-term in this market.
MyCryptoParadise
iFeel the success🌴

ENA About to Collapse or One Last Rally Before the Fall?Yello, Paradisers! Is ENA about to crash hard, or is a sneaky rally waiting to trap late bulls? Read this before making your next move!
💎#ENAUSDT has recently formed a Change of Character (CHOCH) while leaving behind a supply zone and an imbalance. Currently, we expect an upside correction toward $0.4333 and $0.4507, but this move is likely to be short lived. If the price taps these levels and faces strong resistance expect a sharp rejection, especially with the descending trendline and EMA 50 acting as barriers to bullish momentum. This setup suggests ENA is in a prime position for further downside unless it breaks above the supply zone.
💎If #ENAUSD fails to break the supply zone, a rapid sell-off toward the $0.34 support zone is highly likely. A visible gap imbalance further increases the probability of the price filling the gap before any potential reversal. Volume analysis also shows a clear surge in bearish activity, confirming strong selling pressure in the market.
💎The $0.34 level remains the most crucial support where buyers may attempt to step in. However, if this fails to hold, the next major demand zone sits around $0.30, where a deeper correction could unfold. Until a significant bullish breakout occurs, the risk of further downside remains high.
💎If the price manages to break above the supply zone, it would invalidate the bearish setup and could fuel a stronger rally. However, as long as the descending trendline and EMA 50 continue to hold back bullish momentum, the bearish outlook remains intact.
💎Will ENA hold support or break down further? Drop your thoughts in the comments! Are you positioning yourself for a move, or are you waiting for confirmation? Let’s discuss!
Stay sharp, Paradisers! The market rewards patience, discipline, and strategic thinking. Trade smart.
MyCryptoParadise
iFeel the success🌴

CTK/USDT in Danger? Key Levels That Will Decide the Next MoveYello, Paradisers! Is CTK/USDT on the verge of a major breakdown, or will bulls make a comeback? Let’s dive in!
💎#CTKUSDT has broken below its ascending channel, signaling a potential trend shift. Right now, the $0.41 - $0.42 level, which previously acted as strong support, has turned into resistance. This is a critical area if buyers fail to reclaim it, the selling pressure will likely continue. Adding to the bearish outlook, price is trading below both the EMA 50 and EMA 200, further confirming that sellers remain in control.
💎A fair value gap (FVG) near $0.41 could act as a magnet for a short-term bounce, but unless price reclaims this level with strength, the downtrend remains intact. If the rejection plays out, the next target to the downside is $0.3484, with a deeper drop potentially reaching the major support zone at $0.3091.
💎On the flip side, a break above the major supply zone at $0.4631 would completely invalidate the bearish setup and open the door for another strong rally. However, as it stands, the market structure favors further downside, and a rejection at resistance could accelerate the decline.
MyCryptoParadise
iFeel the success🌴

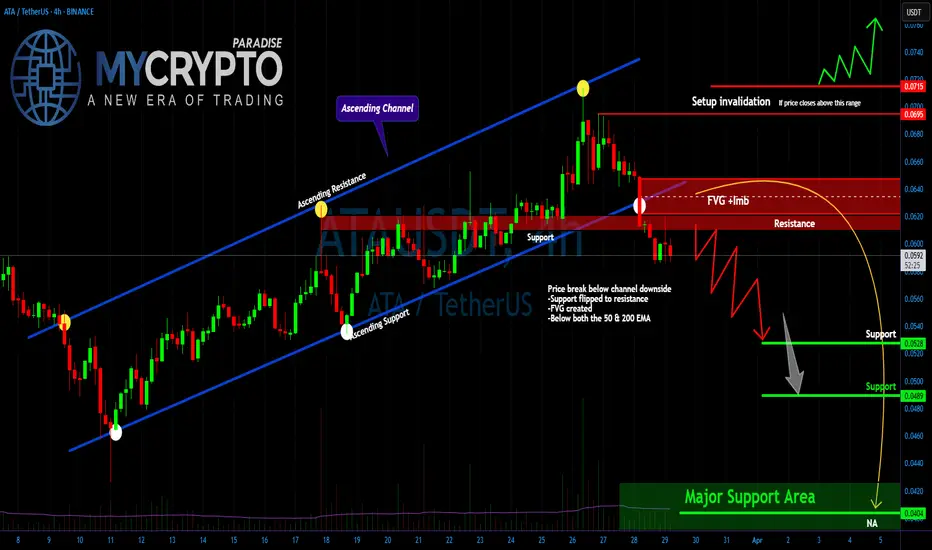
Major Breakdown Confirmed! Is a Bigger Dump Incoming? Yello, Paradisers! Did you catch this critical shift in price action? A major breakdown has occurred, flipping previous support into resistance and confirming a trend reversal from bullish to bearish. This shift has reinforced selling pressure, with price now trading below both the 50 & 200 EMA, signaling a strong bearish trend.
💎The market is currently testing resistance at $0.619. If this level holds, the probability of a significant drop increases. A Fair Value Gap (FVG) has also formed, indicating price inefficiency that may get filled before the next leg downward. If selling pressure remains dominant, a zig-zag decline toward lower support levels is likely. The key downside targets to watch are $0.0528, followed by $0.0489, with a major support zone resting at $0.0402.
💎Recent price action further supports the bearish bias. The last five candles have upper wicks, indicating strong rejection at higher levels. Volume is gradually declining, suggesting short-term consolidation before the next significant move. A bearish engulfing pattern has also emerged, reinforcing the likelihood of further downside.
💎To invalidate the bearish setup, price must close above the $0.0695 - $0.0715 range. A decisive breakout above this level would signal a possible trend reversal. Until that happens, the bias remains bearish, with expectations of continued downward momentum unless resistance is broken convincingly.
Stay patient, stay disciplined, and always wait for the highest probability setups. Those who follow the plan and avoid emotional decisions will be the ones who come out on top. Be a PRO!
MyCryptoParadise
iFeel the success🌴
XRPUSDT.P — Is This the Beginning of the Next Pump?
BINANCE:XRPUSDT.P is bouncing back with style — and this long setup is giving off real “king of the charts” vibes. Look at that clean risk-to-reward!
Entry: 2.0905 USDT
Stop-loss: 2.0574 USDT
Take-Profit: 2.2238 USDT
R:R Ratio: 3.28
Why this setup matters:
Confirmed bounce off intraday support
Momentum shift with bullish engulfing candle
Targeting a clean resistance level for optimal exit
Tight stop, juicy upside — exactly what scalpers and day traders crave. Add to watchlist and get ready to trail that stop if momentum holds.
