#DYMUSDT is showing signs of growth📉 Long BYBIT:DYMUSDT.P от $0,4575
🛡 Stop loss $0,4350
🕒 1H Timeframe
⚡️ Overview:
➡️ The main POC (Point of Control) is at 0,4149, indicating the area with the highest trading volume.
➡️ The 0,4572 level acts as a local support, as the price previously bounced from this zone.
🎯 TP Targets:
💎 TP 1: $0,4720
💎 TP 2: $0,4850
💎 TP 2: $0,4970
📢 Monitor key levels before entering the trade!
📢 If 0,4572 is broken downward, the trade may be invalidated.
BYBIT:DYMUSDT.P is showing signs of growth — expecting further upside movement!
Cryptosignals

After an 80% Drop, Is FET Finally Ready to Reverse?Exactly one year ago, FET reached its all-time high of $3.5, but since then, it has experienced a steep decline of over 80%.
However, the coin has recently found strong technical support around the $0.45 zone, which, in my view, signals a potential rebound on the horizon.
Currently, FET is trading near $0.52, and from a psychological standpoint, being around a key round number and its Binance listing price, we could see a bounce from these levels.
With this in mind, I anticipate a trend reversal, with an initial target of $1 in the near future. Additionally, $0.80 stands as a significant resistance level and could serve as an interim target before further upside movement.
From a risk-reward perspective, this setup offers an attractive 1:5 ratio

Bitcoin- I'm looking to re-eter shortIn my BTC analysis last week, I outlined the reasons behind my decision to enter short exit and detailed my expectations for a corrective move.
As projected, BTC broke below the $80,000 level. Although my initial downside target at $75,000 has not been fully met, I opted to manually close my short position to secure profits. Currently, I am monitoring price action for a potential re-entry on the short side.
From a structural standpoint, after establishing a local low around the $76,500 area, BTC has initiated a corrective bounce.
However, this recovery appears weak and corrective in nature — likely unfolding as a bear flag formation, albeit not perfectly defined.
My primary short re-entry zone is identified between $85,500 and $87,000, where I expect supply to emerge. As long as price remains capped below that zone, my bearish bias remains intact. I continue to anticipate a move to $75,000, with a potential extension toward the $72,000 technical support zone.
This bearish scenario would be invalidated in the event of sustained buying and consolidation above the $90,000 resistance level.

FIL/USDT Breakdown – Is a Major Drop Coming? Yello, Paradisers! FIL/USDT has just broken below the EMA 50, and that’s a big red flag for bulls. This level had been acting as strong dynamic support, and now that it’s lost, the bearish momentum is strengthening. If buyers can’t reclaim it soon, the market could be gearing up for a deeper move to the downside.
💎The price is struggling around the major Supply Zone at $2.90 - $3.00, and the failure to hold above this level combined with the EMA 50 breakdown increases the likelihood of a drop toward the next Support Area at $2.467 - $2.209. With the EMA 50 now acting as resistance, any retest is likely to face heavy selling pressure.
💎The EMA 200 remains a key dynamic resistance, reinforcing the bearish bias. Unless FIL/USDT reclaims the EMA 50 and breaks convincingly above $3.306 with strong volume, the downward trend remains intact.
💎If the decline continues with increasing volume, sellers are firmly in control, making a deeper drop more likely. On the other hand, a weak move lower with low volume could indicate exhaustion, potentially leading to a short-term bounce or consolidation.
This is not the time to chase trades blindly. Patience and discipline always win in the long run, Paradisers. Stick to your levels and execute only high-probability setups. Stay sharp.
MyCryptoParadise
iFeel the success🌴

ETH/USDT: Testing Key Support with Potential for ReboundThe ETH/USDT pair continues to decline, approaching a key support level last tested in October 2023. Historically, similar price movements were observed in 2021, when the price dropped from the 4,300 level before rebounding from the 1,700 support zone, ultimately leading to new all-time highs.
Currently, the price has broken above a downward trendline that had served as a resistance throughout the month. Looking ahead, the market may remain in a sideways phase over the coming weeks, with a potential upward push if buying pressure emerges from the support level. The next key target is the resistance zone around 2,190

PIUSDT : Head & Shoulders Signals a Major Drop Incoming!Yello, Paradisers! PIUSDT is flashing strong bearish signals! The price has formed a Head & Shoulders pattern right on the resistance trendline of a descending channel—this combination significantly increases the probability of a sharp move to the downside.
💎PIUSDT breaks below the neckline and closed a candle which validates the bearish setup, increasing the likelihood of further downside.
💎However, We have to wait for the proper retest of the neckline, patience is key for the right entry.
💎On the flip side, if PIUSDT breaks above the resistance zone and closes candle above it, the bearish setup will be invalidated.
Stay disciplined and wait for confirmation, Paradisers. A fakeout could trap impatient traders—don’t be one of them! 🎖
MyCryptoParadise
iFeel the success 🌴

Solana’s Price Action: Aftermath of the Blow-Off TopThe recent peak for Solana, approaching $300, has proven to be a classic blow-off top. The subsequent decline has broken through three key support levels, retracing around 60% and ultimately reaching the $120 level—a price point that has acted as a strong floor over the past year, with multiple reversals from this zone.
While this may seem positive, the chart structure at the moment doesn't appear encouraging for bulls.
Current Market Structure: A Bearish Outlook
Looking at the price action, it’s clear that the market has faced significant downward pressure. Despite the bounce from $120, the overall structure suggests caution. While the $120 level is historically strong, there’s no guarantee it will hold again. The series of broken support levels and the depth of the correction point to a market that is struggling to regain its previous strength.
Optimistic vs Pessimistic Scenarios: Where Could Solana Go Next?
In my opinion, the optimistic scenario for Solana would see the price range between the $120 zone and the $180 zone. This would represent a consolidation pattern, as the market tries to establish a new equilibrium. However, given the overall trend and recent price action, it’s also important to consider a more pessimistic scenario. In the worst case, the price could fall as low as $80, especially if the broader market continues to face downward pressure.

Alts- Will they drop further? (+name your alt)In my early February analysis on altcoins , I noted that while a bounce was likely after the sharp drop triggered by Trump’s initial tax remarks, the $1.3T level would act as strong resistance.
I expected another decline once this resistance was confirmed— which is exactly what happened, as the market reached that level and began to drop again.
After multiple tests of the rising trendline that began in October 2023, last week saw a breakdown, with price finding support just above $900B (an important level as we can see from the posted chart).
But was that the full extent of the drop?
In my view, we are far from being in the clear, and further declines seem likely. Technically, the rising trendline has been broken, and the recent rebound appears to be corrective rather than the start of a sustained recovery.
As long as the price remains below the $1.15T–$1.2T zone, I see a high probability of the market
breaking under 900B zone support and reaching $700B in the coming months.

Resistance at 1.3T: Is a Deeper Crypto Correction Coming?The long-awaited Trump inauguration, which was expected to trigger an altcoin season, had the exact opposite effect. This once again proves that when the majority of market participants expect one outcome, the market often does the opposite.
After several days of testing support, the "tax policy" announcement triggered a breakdown below the 1.3T level, causing Total 3 to drop around 30% to 1T.
The market is now experiencing a normal rebound, but I am not very optimistic in the medium term.
Technically, 1.3T has now turned into strong resistance. In my opinion, after this rebound, a new leg down is likely.
I expect a drop below 1T, potentially reaching around 900B in the near future.

AVAXUSDT Breakdown Alert – Are Lower Lows Coming Next?Yello, Paradisers! Is AVAXUSDT gearing up for a bigger drop? Let’s break it down.
💎AVAXUSDT has turned bearish after breaking below its key support trendline. A Change of Character (CHoCH) confirms the shift to the downside, and right now, the price is rejecting from a critical 4H Fair Value Gap (FVG) and the 200 EMA resistance zone. Adding to the bearish pressure, we also see a 4H bearish divergence, making a downside move highly probable.
💎Moreover, AVAXUSDT is in the process of forming a Head & Shoulders pattern, which increases the risk-to-reward (RR) potential for short trades. On top of that, there’s liquidity resting below, which could act as a magnet, pulling the price further down.
💎However, if the price breaks out and closes a candle above the 200 EMA resistance zone, this bearish outlook will be invalidated. In that case, it’s better to wait for clearer price action before making any moves.
🎖Patience is key, Paradisers. Stick to the strategy, avoid emotional trading, and let the market come to you. The best setups will always present themselves to those who wait!
MyCryptoParadise
iFeel the success🌴

BTCUSDT Upside potentialThe BTC/USDT market is currently consolidating above the 80,000 level after breaking below February's low. Recently, a large weekly doji candle has emerged, signaling ongoing sideways movement. At present, the price remains within this week's trading range.
From a broader perspective, price action appears to be narrowing, forming a falling wedge pattern. With the market consolidating just below the downward trendline, a potential breakout above this level could signal further upside momentum. If the price manages to close above last week's high, it could lead to the formation of a solid inverse head and shoulders pattern, reinforcing the possibility of an upward extension. The next key target lies at the resistance zone around 88,000

BTC FOR SCALPERS AND DAY TRADERS *9400 POINTS **Guys pls like, share and follow my ideas
Entry price ,stoploss and Target already marked in the chart itself FYI.
Thank You All
ZIGZAG STRATEGY SIGNAL
GREEN ARROW INDICATES BUY
RED ARROW INDICATES SELL
STOP LOSS DONT RISK MORE THAN 2%
OF YOUR CAPITAL
BUY TARGET POINT 2900
SELL TARGET POINT 6500

#WUSDT is setting up for a breakout📉 Long BYBIT:WUSDT.P from $0,08897
🛡 Stop loss $0,1985
1h Timeframe
⚡ Plan:
➡️ Waiting for consolidation near resistance and increased buying activity before the breakout.
➡️ Expecting an impulsive upward move as buy orders accumulate.
🎯 TP Targets:
💎 TP 1: $0,09275
💎 TP 2: $0,09465
💎 TP 3: $0,09566
🚀 BYBIT:WUSDT.P is setting up for a breakout—preparing for an upward move!

#VIRTUAL Ready For Another Leg Down Before Bullish Reversal Yello, Paradisers! Is #VIRTUAL gearing up for a full-blown collapse, or will the bulls fight back at critical support? Let’s break down #VirtualsProtocol:
💎#VIRTUALUSDT has already broken below the falling wedge, confirming that sellers remain in full control. The breakdown from this pattern signals that the expected bullish reversal has failed, and the trend remains decisively bearish. The price action is also clear—momentum is heavily bearish, and unless something shifts fast, we could see much lower levels ahead.
💎The previous major support zone at $0.60 - $0.65 has flipped into resistance, making it a crucial level to watch. Any short-term bounce into this area is likely to face strong selling pressure from sellers of #VIRTUALUSD. Only a break above $0.935 would invalidate this bearish outlook and signal a shift in momentum.
💎If the rejection plays out, the next downside target sits at $0.40, with a high probability of further decline toward the major support zone at $0.31 - $0.07. This is where buyers must step in—otherwise, a much deeper drop could follow.
💎RSI remains weak, and volume is declining, confirming the lack of strong buying interest. As long as this continues, the bearish pressure is likely to persist.
The market rewards discipline and patience—trade smart, Paradisers!
MyCryptoParadise
iFeel the success 🌴

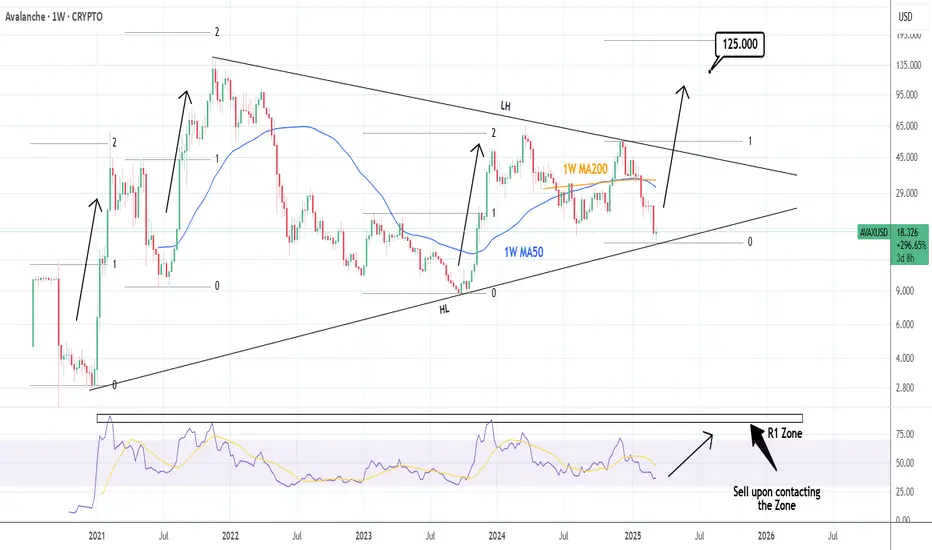
AVAXUSD: Could target $125 by the end of this CycleAvalanche is bearish on its 1D technical outlook (RSI = 38.910, MACD = -2.280, ADX = 35.079) but the bullish dynamics should start accelerating now as the price hit the HL trendline of December 2020. This is the bottom of the multi year Triangle pattern and with the 1W RSI as low as the August 5th 2024 bottom, we expect the final rally of this Bull Cycle to start. Technically it should break above the LH trendline as all Bull Cycle rallies hit (or came close to) their 2.0 Fibonacci extension. Buy and aim for slightly below it (TP = 125.000).
## If you like our free content follow our profile to get more daily ideas. ##
## Comments and likes are greatly appreciated. ##
HBAR Hanging by a Thread! A Breakdown Could Be Brutal!Yello, Paradisers! Is #HBAR about to crumble under selling pressure? The charts are flashing red flags, and bulls are barely holding on! Let’s break it down.
💎#HBARUSDT is clinging to a crucial support zone between $0.1900 – $0.1785—a level that has held strong since December 2024. However, with repeated tests, this support is starting to weaken, signaling potential trouble ahead. Sellers are building pressure, and if bulls fail to defend the $0.1750 level, HBAR could face a sharp drop toward $0.1500, where a short-term short-squeeze might offer some temporary relief.
💎However, if selling momentum persists, the decline could extend further, dragging HBAR down to the $0.1300 – $0.1175 zone, where higher time-frame supports are present. This area is more likely to trigger strong short-covering and attract fresh buying interest, potentially setting the stage for a recovery.
💎On the upside, bulls are trapped under heavy resistance at $0.24, with a critical barrier at $0.26 – $0.275. Until this level is broken with conviction, HBAR remains vulnerable to further downside.
Paradisers, as always, patience and precision are key in this market. This isn’t a time for reckless trades—let the levels guide you, trade strategically, and stay disciplined.
MyCryptoParadise
iFeel the success🌴

Warning: DSYNC Is on the Edge—A Huge Drop Could Be Next!Yello, Paradisers! Are we about to witness another major leg down for #DSYNC? The price action is flashing clear warning signs, and if you’re not paying attention, you might get caught on the wrong side of the trade.
💎#DSYNCUSDT has been in a consistent downtrend since forming a double top, and the technicals are pointing to more downside ahead. The pair is now shaping a descending triangle, a well-known continuation pattern that signals further bearish movement.
💎Right now, 0.1850 is the key battleground. DSYNC is breaking below this critical support level, and if sellers hold this breakdown, an accelerated drop could follow in the coming hours. The first major support lies at 0.1415, where some profit-taking may occur, but it’s unlikely to stop the overall decline. Below this level, the final target zone between 0.1215 and 0.1115 becomes the most significant area of interest, as this is where the pattern’s full downside projection concludes and stronger support is expected.
💎At the same time, DSYNC is already turning 0.1850 into a resistance, reinforcing the bearish momentum. Higher up, another resistance at 0.2120 will make it even harder for bulls to regain control. For any meaningful recovery, buyers need to push past the stronger resistance zone between 0.255 and 0.2720, but as long as this area holds, sellers remain firmly in control.
💎Adding to the downside pressure is the death cross between the EMA-50 and EMA-200, a strong bearish signal that suggests the trend remains aggressively negative. Without a decisive reclaim of key levels, DSYNC is vulnerable to further losses.
Paradisers, as always, patience and precision are key in this market. This isn’t a time for reckless trades—let the levels guide you, trade strategically, and stay disciplined.
MyCryptoParadise
iFeel the success🌴

ATOMUSDT Nearing a Breakdown – More Pain Ahead?Yello, Paradisers! Is ATOMUSD gearing up for a deeper decline, or can the bulls pull off a breakout reversal? The latest price action suggests a major move is coming let’s break it down.
💎#ATOMUSDT remains in a strong downtrend, repeatedly rejecting from the key resistance trendline and the 200 EMA. The latest attempt to break above the supply zone $4.445 was firmly rejected, reinforcing bearish control. Sellers continue to dominate, keeping the price below the $4.445 supply zone, making ATOM vulnerable to further downside. Until this level is reclaimed, the trend remains bearish.
💎The next key downside target is the $3.740 support zone, where a temporary relief bounce could occur. However, if selling pressure persists, ATOM could drop further toward the $3.482 major support, a historically strong buying area.
💎For the bulls to regain control, #ATOM must break above $4.445 and push beyond the 200 EMA near $4.80. However, a true trend reversal will only be confirmed if ATOM closes above $5.90, invalidating the bearish setup.
Stay patient, Paradisers! The market rewards discipline. If we see confirmation, we take action. If not, we wait. Trade smart, not fast!
MyCryptoParadise
iFeel the success 🌴

XRPUSDT: A Massive Move Is Coming – But Will It Be Up or Down?Yello, Paradisers! Are we about to see an explosive breakout in XRP, or is a deeper pullback lurking around the corner? Let’s break it down.
💎XRPUSDT has formed a falling wedge alongside a bullish divergence, signaling a potential upside move. Adding to the bullish case, we also see an inverse head & shoulders pattern forming underneath – a combination that significantly increases the probability of a breakout.
💎For a high-probability bullish confirmation, we need a breakout and candle close above the falling wedge.
💎That said, if price retraces deeper, we should be watching the major support zone for a potential bounce. A bullish I-ChoCH on lower timeframes will serve as the key confirmation for a reversal.
💎The invalidation level? If XRPUSDT breaks down and closes candle below the major support zone, this bullish setup will be completely invalidated.
🎖Stay sharp, Paradisers. The next move will decide everything! As always, discipline and patience will separate the winners from the crowd. Be strategic, trade smart, and wait for the highest probability setups.
MyCryptoParadise
iFeel the success 🌴

ZILUSDT at a Breaking Point: Deeper Drop or a Surprise Reversal?Yello! Is ZILUSDT about to sink further, or are the bulls preparing for a comeback? The price action is flashing critical signals, and a major move is brewing traders, stay sharp.
💎#Zilliqa remains under heavy bearish pressure, struggling to reclaim the key $0.01503 resistance level. The price is trading below both the 50 and 200 EMAs, reinforcing the downtrend and showing that sellers are still in control. If GETTEX:ZIL fails to hold above the current trendline, it will likely retest $0.01278, where a rejection could send it lower. Until $0.01503 is reclaimed and sustained, the risk of further downside remains high.
💎The next major support sits at $0.01032, where a temporary bounce could occur. This is a crucial level, as it marks a strong historical support zone. However, if selling pressure persists, ZIL could drop further to $0.00879, a key accumulation area where bulls might step in—or where the bearish trend could deepen even further.
💎For the bulls to regain control, it must reclaim $0.01503 and break past the supply zone. A sustained push beyond this level, backed by strong buying momentum, could hint at the start of a trend reversal. However, a true shift in momentum will only be confirmed if ZIL closes above $0.01503, reclaims the 200 EMA, and invalidates the current bearish setup.
Patience is everything, traders. The biggest profits come from waiting for confirmation, not chasing every small move. Play it smart and stay disciplined only the prepared will win in the long run.
MyCryptoParadise
iFeel the success 🌴

VETUSDT on the Edge – Is a Major Breakdown Coming?Yello! Is VETUSDT on the verge of a bigger drop, or could a reversal be in play? The price action is signaling a critical moment, and traders need to stay sharp. A major move is brewing let’s analyze the setup.
💎#VETUSD remains under strong bearish pressure, repeatedly rejecting from the descending trendline and key supply zone. Price is also trading below the 200 EMA, reinforcing the bearish momentum and signaling that sellers remain in control. Until VET reclaims $0.02695, the risk of further downside remains high.
💎The next major support level to watch is $0.02117, where a temporary bounce could occur. However, if selling pressure continues, VET is likely to push lower toward $0.01906, a historically strong accumulation zone. This level will be crucial either it holds as a buying opportunity, or we see deeper downside continuation.
💎For the bulls to regain control, it must reclaim $0.02695 and break past the supply zone. A sustained push beyond $0.025, combined with strong buying momentum, could indicate the start of a recovery. However, a true trend reversal will only be confirmed if NYSE:VET closes above $0.02695 and reclaims the 200 EMA, invalidating the bearish setup and signaling bullish strength.
Patience is key, Paradisers. The market rewards those who wait for confirmation instead of chasing every move.
MyCryptoParadise
iFeel the success 🌴

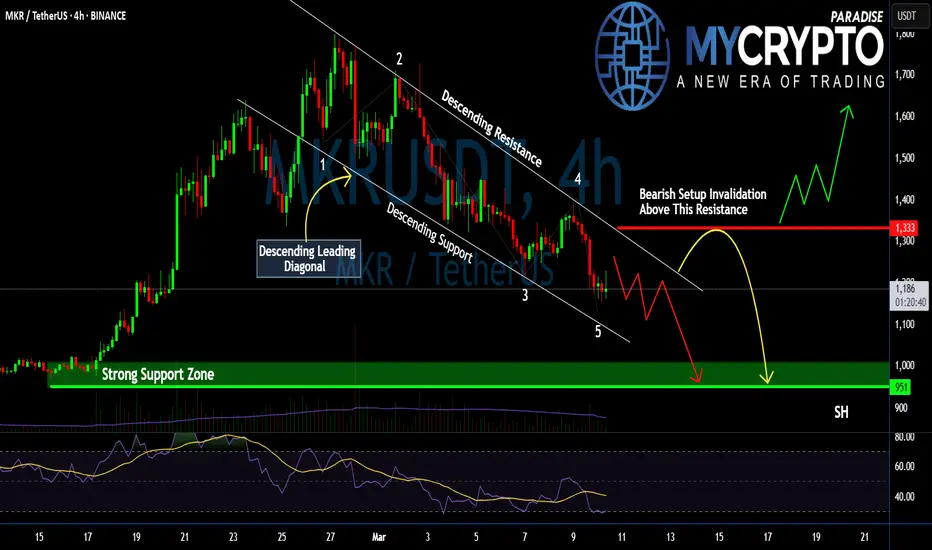
#MKR Bears in Control: Is a Breakdown Inevitable or Not?Yello, Paradisers! Is #MKR setting up for another leg down, or will the Bulls finally step in? The structure is clear; this could get ugly unless something changes soon. Let’s break down the #Maker setup:
💎#MKRUSDT is forming a Descending Leading Diagonal, a classic bearish pattern within a larger zigzag correction. This structure suggests that sellers remain in control, with each bounce being met by renewed selling pressure.
💎Price is currently reacting off the descending support near $1,160. While a short-term bounce toward $1,250 - $1,300 is possible, it remains within the bearish framework. The critical resistance to watch is at $1,333—a breakout above this level would invalidate the bearish setup and signal a shift in momentum.
💎If the bearish structure holds, the next leg down could take us to the strong support zone at $1,000 - $950. This is where buyers will have their last real chance to defend the trend. A failure to hold this level could open the door to a deeper correction.
💎RSI remains weak, showing no strong bullish divergence, signaling that momentum is still in favor of the sellers. The volume is declining, meaning the recent price action lacks strong buying conviction.
Strive for consistency, not quick profits. The market rewards discipline and patience—trade smart, Paradisers!
MyCryptoParadise
iFeel the success 🌴
Bulls in Trouble! Sonic Rejected Again—Lower Lows Incoming?Yello, Paradisers! Is #Sonic about to take another dive? The latest price action suggests trouble for the bulls. After failing to reclaim key support, the downtrend is back in full force.
💎#SUSDT continues to reject from a historically strong resistance at $0.63 – $0.65, a level that has repeatedly proven difficult to break. This latest rejection is only accelerating the downside, putting lower targets into play.
💎The sellers are initially aiming for the $0.46 – $0.44 levels, a strong support zone where we could see some short-covering as traders take profits on their positions. This level has provided temporary relief in the past, making it a key area to watch.
💎However, if sellers maintain control and the bearish momentum continues, the price could dip even further into the $0.3850 – $0.3740 zone. This area has historically acted as a strong support base, attracting significant buying pressure that could fuel a potential reversal.
💎For bulls to regain control, they must reclaim the $0.63 – $0.65 zone, a strong resistance level. However, with descending resistance reinforcing this area, breaking out won’t be easy. Until then, the trend remains bearish, and lower levels are in play.
Stay patient, Paradisers! The market always rewards discipline. If we see confirmation, we take action. If not, we wait. Trade smart, not fast! 🎖
MyCryptoParadise
iFeel the success 🌴
