Crypto total market capCrypto Total Market Cap Excluded BTC
The RSI resistance on weekly is right behind the corner. Like we can see from the picture this is the fourth time this RSI line gets hit ( RED circles ).
GREEN circle shows where the suppressing downtrend line got broken. (Trend turned to Bull)
BLUE arrows shows that these upward legs are identical size. Which would mean a pullback.
I believe we might get a small and fast retrace from here before we take up higher.
After the line breaks and price stays higher I believe we are going to 250 billion marketcap.
Remember that "more times a support or resistance gets hit the weaker it gets".
What I have seen, the fifth time usually does it ;)
For long term I am bullish.
Also the fear and creed index has been on creed / extreme creed for 2 weeks. (not the first time thou)
alternative.me
This is not a financial advice!
If you do trade use stop loss and small enough positions!
1st mistake beginner traders do is taking too big risk.
-Jebu
Cryptototalmarketcap

Crypto total market,analys for short term (1-2 weeks) Hi Guys
This time I'll show my tight field of view of whole cryptocurrency market. Last several days we move in upper channel pattern - which is a strenght signal that we are in up trend from march. If the prediction is correct, and we are forming rising wedge pattern, in short term - ill stay and wait for next move. RSI is oversould,but still pointing down. If we have engulfing bearish candle or othersign which is close below wedge (a few 4h candle - supported by volume, or 1D), this will be massive bearish sign. Leaning on Fibo retracment it could get easly to 433.B crypto total market which is 5% of funds. This is good time to check bitcoin domination - if it is stable, thoooose altcoins will bleed. Fear & Greed index for today: 86 points. Next week should show the further direction.
Cheers!

CRYPTO TOTAL MARKET - ABC Correction of EWTCrypto is making the Elliott wave pattern, but ABC correction is remaining. We can assume the A point around 378.60B , and B point near 426 , and the C point will be around 320 . After that, there is a high possibility of reversal. The third wave includes a diagonal triangle.

Trillions IndustryThis Industry is about to catch a part of the fiat supply.
Some of the wealthier person in the world buying big chunk of $at.
.
.
.
.
.
Billions and Billions and Billions and Billions Billions and Billions and Billions and Billions ... www.youtube.com
.
.
.
To bitcoin

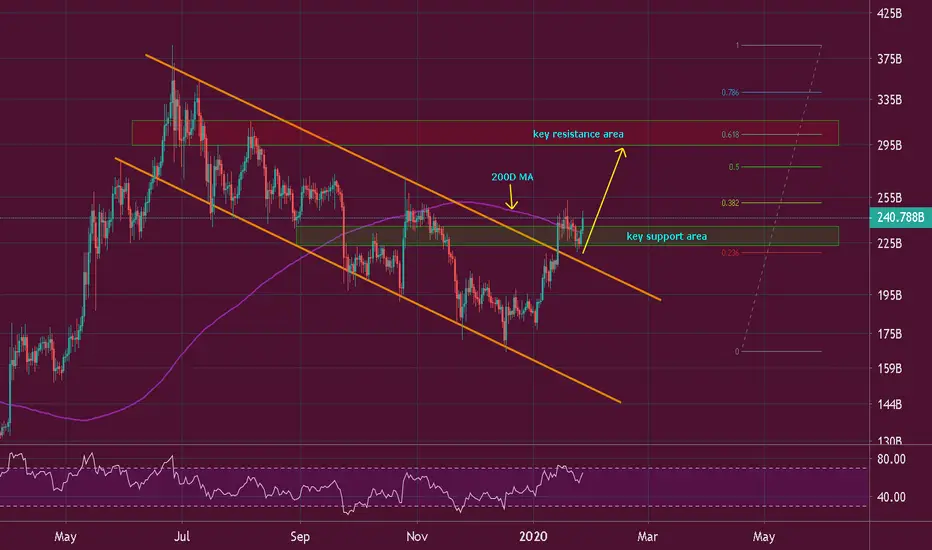
Crypto Total Market Cap TA Update (Bull Flag Pattern?)Crypto Total Market Cap
CTMC broke bullish of this descending channel and retested the 200D MA as support.
The price is about to close the candle above 200MA for the 2nd day and it is likely painting a bull flag and our target to the upside is the 0.618 Fib resistance.
When in doubts - Zoom out Hello everyone.
If you´re lost in mid/long term cycle/ right market side I would recommend just to ZOOM OUT
** Last time I´ve called local bottom it was at 3K range and it was based on Volume **
but supported by RSI indicator bull divergence as well
Now if you check out the Crypto Total Market Cap volume, RSI, MA´s, as well as supports/resisstances
You must realize how big is the amount of huge buy volume compared to the previous price action
Further confirmation by patterns:
+
Closer view on Bull Divergence on Daily chart + Basic W1-5 Eliott Waves
**Latest High (13K USD/ 400b tmc ) Called based on bearish divergence here:**
Longer term tracking on Weekly chart:
If you appriciate my work efforts I would appriciate like for this TA
&
If youre in doubts or have any questions then feel free to ask in comments below the chart.
Wish you all nice Weekend
Cheers
------------------
Risk Disclosure
DISCLAIMER: This is not a financial advice ! Cryptocurrency trading involves substantial risk of loss and is not suitable for every investor. The valuation of asset may fluctuate, and, as a result, clients may lose more than their original investment. Investing will have impact on your trading account and this can work against you, leading to large losses or can work for you, leading to large gains. As an investor, it's crucial to know how much of your money you could lose and what circumstances could cause this to occur. Always do your own research and think twice before you invest.

Total Market Cap Chart moving in down trend channel. We formed falling wedge - reversal pattern. And we already broke up resistance line of this wedge.
We touched support line of this channel and now we go to resistance line to biggest horizontal volume (Visible Range)

Alts Against Bitcoin : Where Are We Heading?#Alt_Update
#ALTs / #BTC
The main reason we have not been posting ideas was the Alt market scenario. It was in a downward move since May 30 which was more of a correctional retrace move instead of a major downward trend. We are now at a major point were we can decide that Alts will continue and enter a major downward channel or not. The main price level area is at around 945B which is depicted by the blue circle on the chart. If Alts market is going to break the support of this level at the closing of the current chart we might go further downward and will be in a bearish overall market trend for some days by the following week. In the other scenario which can happen we might see a good bullish reversal move and will test the area at around 1.16Tr level. Further if it can break the resistance at that area we will be on the start of a bullish season for Alts.
-MACD and RSI are still in bearish mode amd EMA still in bear mode too.
By this we conclude that we need to be careful on our alt trades and need to be sure on accumulations backed by TA and FA studies.
