Waiting for the starting whistle (EUR/GBP)Setup
Bullish. Potential breakout
Cup & Handle pattern
Signal
Awaiting daily close above 0.875 resistance for confirmation of breakout
Price has formed a base underneath 0.875, holding above the 100 SMA
RSI maintains a bullish range
Right, wrong? Tell me what you think :)
Ta, Jasper
Cup And Handle

Possible cup and handle?I drew out rays from the weekly chart just to see how it will theoretically affect the price of BB today.
We have a really nice cup formation, after the weak but still green 3rd candle my theory hat says
We will likely find a handle formation within one of the yellow channels drawn from previous resistance lines.
Once we find the correct channel, follow until it breaks and confirms the outside channel for the trend.
I would watch this and enter between 4.3 and 5 and then hope to sell close to 8 or higher.

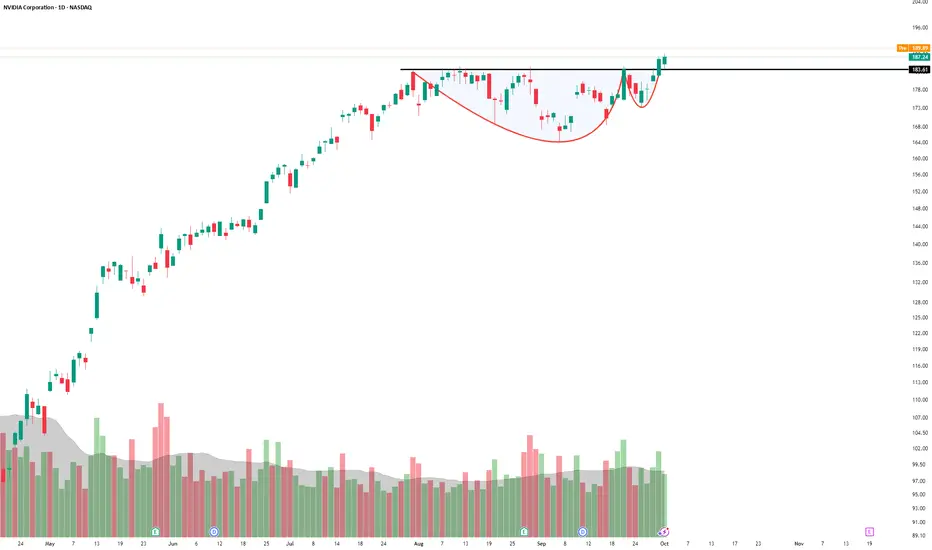
NVDA Breaking Out ... Yet Again!NASDAQ:NVDA is just unstoppable. It broke out again from this base which can also qualify as a cup and handle (C&H) continuation. Going by the size of pattern, it could very well he hitting 200 soon, though exact size comes at around 205.
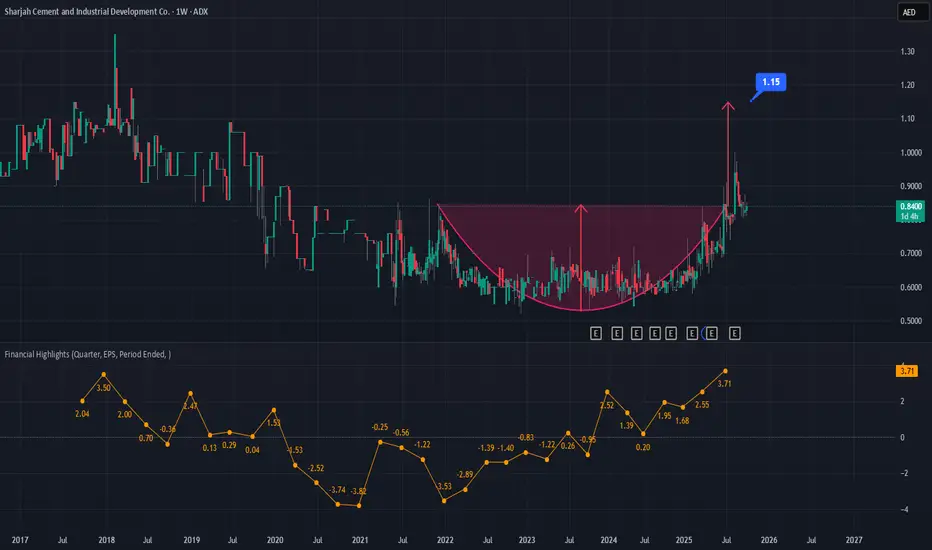
Sharjah Cement – Cup & Handle Breakout FormationThe stock has completed a long-term Cup & Handle pattern on the weekly timeframe.
Breakout level: 0.84 AED
Target: 1.15 AED (based on measured move projection)
Support zone: 0.78 – 0.80 AED (handle low / breakout retest zone)
📈 As long as price sustains above the breakout level, momentum could push it toward the projected target.
📉 A close below 0.78 AED would invalidate this bullish setup.
Bias: Bullish
TP: 1.15 AED
SL: 0.78 AED
Tata PowerStock after consolidation has entered in a Cup and Handle Pattern.
Breakout above neckline should look for below targets
Target 1 420
Target 2 440

Descending channel followed by cup and handle?After the bull flag we had a descending channel pattern. I’m thinking that we are about to form a cup and handle pattern here. All three patterns are bullish.
BMNR 4H – cup with handle or champagne glass?The current technical setup on BMNR (4H) shows a potential “cup with handle” structure forming within a clear accumulation zone. Price is holding above both the MA50 and MA200, which are positioned below and confirm buyers’ control. The 4H trendline acts as dynamic support, while the 48–50 zone remains the key entry area. The upside potential extends toward 97.50, making this setup attractive for a medium-term outlook. Volume support during the last bounce favors the bullish case, and RSI recovery from oversold levels suggests renewed demand.
From a fundamental standpoint, BMNR is still tied to the volatility of speculative growth stocks, yet growing investor appetite for niche digital tech solutions and broader market optimism amid potential rate cuts provide a tailwind.
Tactical plan: accumulation from the 48–50 buy zone, with targets at 71.7, 86.2, and a final destination at 97.5.
The structure looks like a champagne glass - now it’s just a matter of waiting for the toast at higher resistance.

Is the SUI / SOL ratio forming a cup and Handle?Key Takeaways of a Cup and Handle:
The cup and handle pattern represents a bullish technical price formation that manifests on a price chart as a cup accompanied by a handle, indicating a possible buying opportunity.
This pattern generally develops over a span of seven to 65 weeks and is defined by a "U" shaped cup followed by a handle that slopes downward.
In order to trade the cup and handle pattern, traders may opt to place a stop buy order just above the upper trend line of the handle or wait for the price to close above it, establishing a profit target based on the height of the cup.
Instances such as Wynn Resorts illustrate how a properly formed cup and handle pattern can lead to substantial price movement once the pattern is validated and the resistance level is breached.
However, limitations include the duration required for the pattern to form and the variability in the depth of the cup, necessitating its use in conjunction with other signals and indicators.

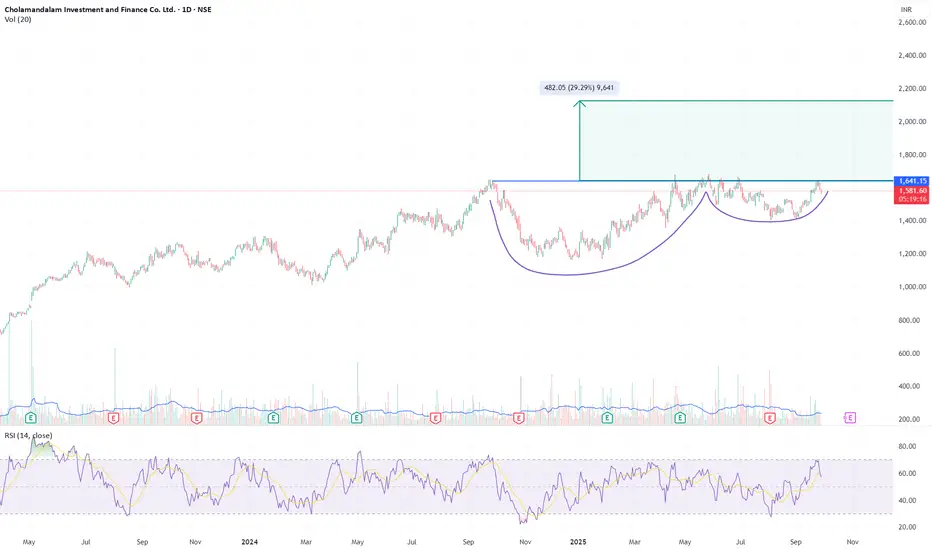
CHOLAFIN – Cup & Handle Reformation | Setup in ProgressCHOLAFIN is re-forming a higher timeframe Cup & Handle pattern after a failed breakout attempt in July. The broader base now spans from late 2024, showing improved symmetry and structural maturity. This is a classic example of a breakout setup resetting through time.
Pattern Details
Pattern: Cup & Handle (reformed)
Neckline / Breakout Level: ₹1641.15
Current Price: ₹1581.10
Target (if breakout holds): ₹1641 + ₹482 = ₹2123
Upside Potential: ~29%
Volume: Needs breakout-day confirmation (>2x 20-day avg)
RSI: 57.2 – healthy, approaching 60
Setup Bias
Not a buy yet — structure is constructive but needs confirmation
Watch for daily/weekly close above ₹1645 with volume support
Prior failure adds caution, but also strengthens credibility on second attempt
Disclaimer
This post is for educational and informational purposes only . It is not a recommendation to buy, sell, or hold any securities. Technical chart patterns involve inherent risk and are not guarantees of future performance. Traders must use their own discretion, manage risk appropriately, and consult with a SEBI-registered financial advisor if needed.
GOLD (XAU/USD): Trend Following TradingIt appears that the price of 📈GOLD has completed a correctional phase following a strong bullish trend.
The price has shown good respect for a significant intraday horizontal support level, subsequently establishing a cup and handle pattern.
The breakout above the neckline, accompanied by a strong imbalance candle, offers substantial confirmation of a bullish trend continuation.
Therefore, an increase to 3770 - 3785 is anticipated.

GOLD (XAU/USD): Time for Pullback!?Regarding the recent developments on the Gold market, a potential cup and handle pattern has been identified on the 4-hour timeframe.
As per our established strategy, a definitive bearish signal will be confirmed upon a breakout below the pattern's neckline.
whereas a 4-hour candle closing below 3750 would validate a significant bearish correction.


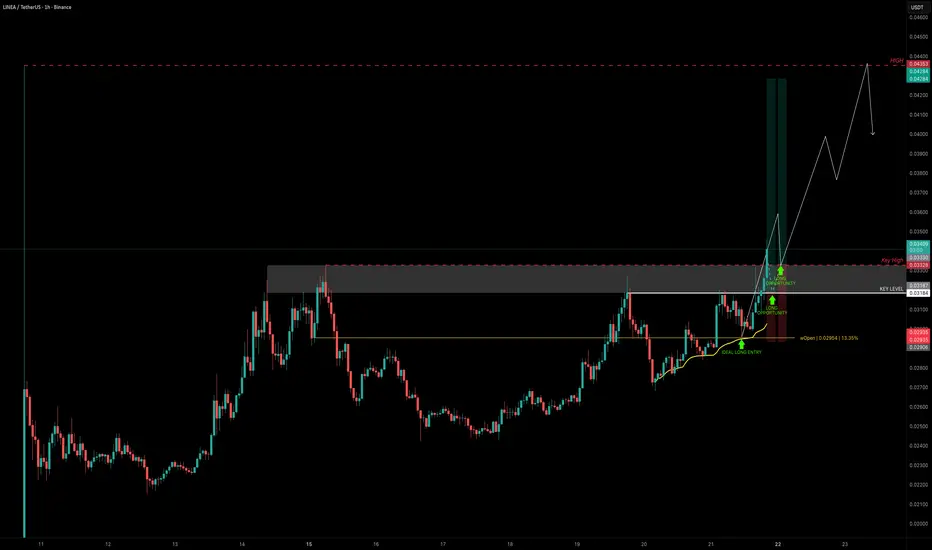
LINEA — $0.033 Key Break Could Unlock Big UpsideLINEA is starting to look interesting. Currently trading around $0.032 (~500M market cap), this level acts as resistance that needs to be broken for bullish continuation.
Earlier today, we already had a clean long setup from $0.03 support, in confluence with the weekly open ($0.02954) and anchored VWAP (yellow line), which held and gave a solid bounce.
Next Long Setup Idea
Entry 1: Watch for a breakout above the key high at $0.03328, then retest for confirmation.
Entry 2: Alternatively, a hold above $0.032 could offer a safer re-entry.
Stop-Loss: Below $0.03 support for now.
Targets
TP1: $0.036
TP2: $0.04
TP3: $0.043
Final Target: $0.065 (aligns with 1B market cap resistance)
This setup could yield:
+30% gain if exited around $0.043
+100% potential if momentum drives price into the $0.065 zone
Quick Take
A breakout and retest of $0.03328 would open the path toward the $0.036–$0.043 zone. If momentum continues, the 1B market cap resistance at $0.065 becomes a realistic macro target.
🔍 Indicators used
DriftLine — Pivot Open Zones → For identifying key yearly/monthly/weekly/daily opens that act as major S/R reference points
➡️ Available for free. You can find it on my profile under “Scripts” and apply it directly to your charts for extra confluence when planning your trades.
_________________________________
💬 If you found this helpful, drop a like and comment!
9/ 22: Trade Within 3718–3668 Range, Watch Support Near 3666Good morning everyone!
Following last week’s rate decision, gold retested support around 3630 and confirmed the level before reclaiming 3658 resistance. This week’s opening saw prices rally above 3690, approaching the 3700 psychological level.
⚠️ Key Levels to Watch:
If price holds above 3666 support, bulls may attempt another test of 3700, with potential to extend into the 3706–3712/3721 resistance zone. Long positions should manage risk carefully here and avoid chasing at highs.
If price breaks below 3666, monitor the 2H chart for possible signs of trend reversal.
📌 Trading Outlook:
Focus on the 3718–3668 range for intraday opportunities.
Near or above 3700, consider selling opportunities.
On a pullback below 3670, look for buying setups.

Japan Approval strengthened fundamentals. Given Japan market reach endorsing future revenues, soon market valuation will sync-in and the rally should kick in and here are the Fibonacci levels for each leg.

TOTAL2 at Crossroads: Alt Season or Triple Divergence CorrectionBy now, it’s no secret that everyone’s watching the cup and handle forming on the TOTAL2 chart (crypto market cap excluding Bitcoin).
A clean break above 1.71T (2021 high) would confirm the pattern and likely ignite an alt season — maybe even reminiscent of 2021, where altcoins more than quadrupled in value.
That’s the bullish scenario. But let’s weigh the other side too.
⚠️ Bearish Warning Signs
Triple Bearish Divergence :
The RSI has been flagging weaker momentum even as price retests highs.
Stochastic RSI Overbought:
It’s been consolidating at overbought for almost 3 months, right as this divergence has been forming.
These suggest the breakout could fail, at least in the short to mid term.
📉 Key Support Levels if Rejected
1.42T (38.2% Fib + EMA 20 ):
First support, already acting as dynamic trend support since Q2 2025. The band is projected via Bollingers with 1 standard deviation setting.
1.27T (50% Fib retracement):
Previous strong S/R flip. If TOTAL2 loses this level, deeper corrections across major alts such as Ethereum, Cardano, Solana are likely.
⚡ Summary:
We’re at a fork in the road. Break 1.71T cleanly → potential alt season.
Fail here → correction toward 1.42T or even 1.27T.
Either way, these levels are where opportunity lies for traders.
📌 DISCLAIMER: Educational purposes only. Trading involves risk and can result in loss of capital. Always do your own due diligence.

Long Term Silver Cup & HandleTextbook Cup & Handle with targets 92-94 as Minimum!
Use this, the Silver Train is just beginning!

This $PENGU Can Fly
Summary
COINBASE:PENGUUSD has traced a broad 2025 “cup” base, with April setting the low and price now back to the January supply shelf. Price forming a bullish wedge just below all-time highs. As we retest what I call the "blue sky" box, we attempt to resolve a contracting wedge to the upside, printing a fresh daily higher high (HH). While price accepts above local resistance, the path of least resistance is higher with an initial magnet toward the ATH "blue sky" box.
Market Structure and Setup
The higher-timeframe structure is the completed cup + reclaim of the former supply shelf ("blue sky" box). On the daily, the sequence is: retest of the shelf as support → wedge compression → upside break → HH. This multi-timeframe alignment (HTF reclaim + D1 momentum) provides defined risk against the shelf and clear upside reference points (ATH → extensions).
Fibonacci-Based Upside Roadmap
Anchor the swing from the April handle low to the August/September impulse high. The roadmap is:
First waypoint: prior ATH band / 1.00 extension (supply; expect reactions).
Continuations: 1.272 and 1.618 extensions of the April → August leg as conditional targets if ATH is accepted and weekly momentum persists.
These are waypoints, not promises—active only while price holds above the reclaimed shelf.
Microstructure: Acceptance > Expansion
The break produced a HH, but the higher-quality entry often comes from acceptance: a shallow pullback that holds the top of the blue box and forms a D1/4H higher low (HL). That HL becomes the pivot to trail against. If momentum continues without a pullback, treat local range highs as a go-with trigger and manage tightly.
Execution Plan
Setup A – Retest Buy (preferred): Accumulate on a controlled retest into the blue breakout box, then look for a 4H reclaim and higher low to confirm buyers. Invalidation is a daily close back below the shelf or loss of the HL. Distribute into the ATH band first; let a runner work toward 1.272/1.618 if acceptance above ATH materializes.
Setup B – Continuation Buy: If there’s no retest, enter on a clean break-and-hold above the recent HH as a momentum trigger. Invalidation sits under the breakout pivot (last 4H swing). Use smaller size and trail faster given the paid-up entry.
Setup C – Failed-Break Short (contingency/hedge): Engage only if price loses the shelf on a daily close and then rejects on a reclaim attempt from below. Invalidation is re-acceptance back above the shelf. Targets are the cup’s midpoint and the 50–61.8% retrace of the April → August impulse.
Invalidation Criteria
Near-term: a daily close back below the blue shelf = reclaim failed; stand down and wait for fresh structure.
Structural: a weekly close back inside the mid-cup range would negate the completed base and argue for more time/width.
Risk & Sizing
Risk ≤1% per idea; position size = account_risk ÷ (entry→stop). Cut risk further if liquidity is thin or wicks are frequent.
Use reduce-only stops and avoid clustering at obvious lows/highs.
Take 30–50% into ATH supply; trail the remainder beneath 4H HLs or a fast EMA pair (e.g., 8/21) to self-finance the trade.
Fundamental/Flow Linkages
As a high-beta crypto/NFT-adjacent asset, PENGU’s tape is sensitive to broad crypto liquidity, meme-beta flows, and listing/funding dynamics. A trending BTC/ETH backdrop and favorable risk sentiment are supportive; adverse headlines, liquidity air-pockets, or exchange changes can truncate moves abruptly.
Key Risks
Crypto beta: a risk-off impulse in majors typically unwinds alt momentum irrespective of local structure.
Liquidity/venue risk: thinner books can produce stop-hunts and gap moves; listing or market-maker changes can impact spreads.
Narrative fatigue: meme/NFT-linked tokens can overshoot then mean-revert sharply as attention rotates.
Technical failure: acceptance back below the shelf converts today’s support back into resistance and invites a deeper cup-middle retrace.
Conclusion
While PENGU consolidates around ATHs, I want to be long on retests that form higher lows or on clean continuation through range highs. First distribute into the ATH band; if acceptance builds above it, press runners toward the 1.272 → 1.618 roadmap. Lose the shelf on a daily close, and the trade is off until structure rebuilds.
Not financial advice. Levels and sizing should be adapted to your process and constraints.


CHFJPY: Strong Bullish Pattern 🇨🇭🇯🇵
CHFJPY is currently updating the All-Time High, breaking
a neckline of a cup & handle pattern.
Looks like an uptrend is going to continue.
Next resistance - 186.85
❤️Please, support my work with like, thank you!❤️
I am part of Trade Nation's Influencer program and receive a monthly fee for using their TradingView charts in my analysis.

EURSGD - 5 months CUP & HANDLE══════════════════════════════
Since 2014, my markets approach is to spot
trading opportunities based solely on the
development of
CLASSICAL CHART PATTERNS
🤝Let’s learn and grow together 🤝
══════════════════════════════
Hello Traders ✌
After a careful consideration I came to the conclusion that:
- it is crucial to be quick in alerting you with all the opportunities I spot and often I don't post a good pattern because I don't have the opportunity to write down a proper didactical comment;
- since my parameters to identify a Classical Pattern and its scenario are very well defined, many of my comments were and would be redundant;
- the information that I think is important is very simple and can easily be understood just by looking at charts;
For these reasons and hoping to give you a better help, I decided to write comments only when something very specific or interesting shows up, otherwise all the information is shown on the chart.
Thank you all for your support
🔎🔎🔎 ALWAYS REMEMBER
"A pattern IS NOT a Pattern until the breakout is completed. Before that moment it is just a bunch of colorful candlesticks on a chart of your watchlist"
═════════════════════════════
⚠ DISCLAIMER ⚠
The content is The Art Of Charting's personal opinion and it is posted purely for educational purpose and therefore it must not be taken as a direct or indirect investing recommendations or advices. Any action taken upon these information is at your own risk.

EURCNY - 5 months CUP & HANDLE══════════════════════════════
Since 2014, my markets approach is to spot
trading opportunities based solely on the
development of
CLASSICAL CHART PATTERNS
🤝Let’s learn and grow together 🤝
══════════════════════════════
Hello Traders ✌
After a careful consideration I came to the conclusion that:
- it is crucial to be quick in alerting you with all the opportunities I spot and often I don't post a good pattern because I don't have the opportunity to write down a proper didactical comment;
- since my parameters to identify a Classical Pattern and its scenario are very well defined, many of my comments were and would be redundant;
- the information that I think is important is very simple and can easily be understood just by looking at charts;
For these reasons and hoping to give you a better help, I decided to write comments only when something very specific or interesting shows up, otherwise all the information is shown on the chart.
Thank you all for your support
🔎🔎🔎 ALWAYS REMEMBER
"A pattern IS NOT a Pattern until the breakout is completed. Before that moment it is just a bunch of colorful candlesticks on a chart of your watchlist"
═════════════════════════════
⚠ DISCLAIMER ⚠
The content is The Art Of Charting's personal opinion and it is posted purely for educational purpose and therefore it must not be taken as a direct or indirect investing recommendations or advices. Any action taken upon these information is at your own risk.

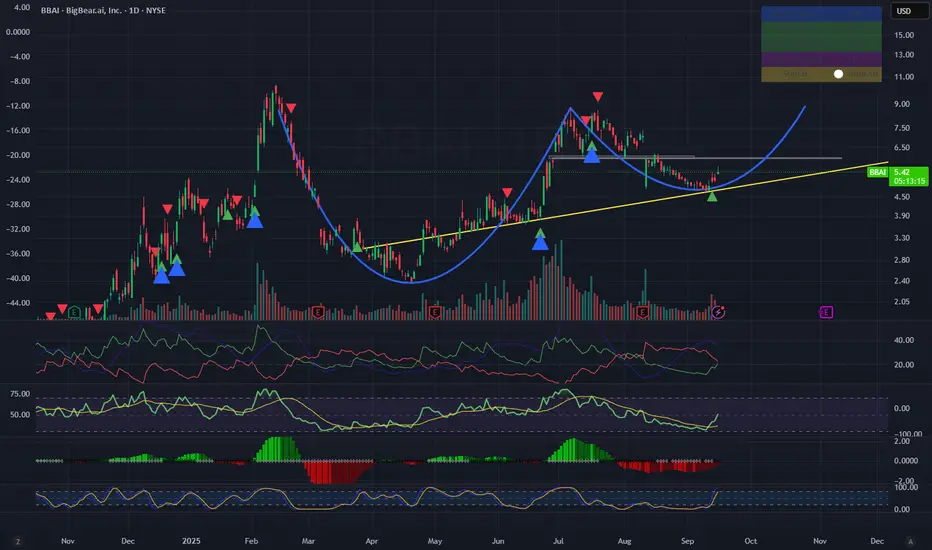
BBAI – Cup & Handle Breakout Potential | Watching the $6 Level
BigBear.ai (BBAI) is developing a **classic Cup & Handle formation** after months of consolidation and accumulation.
The stock is currently trading around **$5.3–5.4**, sitting right above its long-term ascending trendline, and approaching a critical resistance zone.
---
## 🔹 Technical Setup
- **Pattern:** Well-defined Cup & Handle, historically a bullish continuation pattern.
- **Support:** Trendline around **$5.0** has been tested multiple times and held.
- **Resistance / Breakout Zone:** **$5.8–6.0** → key level to watch.
- **Upside Targets:**
- 🎯 First target: **$6.8–7.0**
- 🎯 Secondary: **$7.5–8.0**
- 🎯 Extension: **$8.5–9.0** if momentum continues
- **Invalidation:** Breakdown below **$4.9** negates the setup.
---
## 🔹 Fundamental & Sentiment Context
- 💰 **Cash Position:** ~$390M cash on hand.
- 📦 **Backlog:** ~$380M in contracted revenue.
- 📉 **Challenge:** Q2 showed an **18% YoY revenue decline** and lowered FY2025 guidance ($125–140M vs. $160–180M). Profitability remains an issue.
- 📊 **Market Sentiment:** High short interest (~70M shares) → potential for a **short squeeze** if breakout confirms.
- 🛡️ **Competitive Landscape:** Palantir secured large contracts, but BBAI still has niche opportunities in AI/defense.
---
## 🔹 Trading Thesis
The setup is clear: **Cup & Handle nearing breakout**.
If BBAI **closes above $6.0 with strong volume**, probability for a continuation move toward **$7.5+** increases significantly.
Risk/reward looks attractive for swing traders, but discipline and risk management are critical.
---
## 📈 Conclusion
BBAI is approaching a **technical inflection point**.
A confirmed breakout could unlock strong upside momentum, fueled by technical structure, liquidity, and short interest dynamics.
However, fundamentals remain mixed → this is primarily a **technical swing setup** rather than a long-term investment thesis.
---
⚠️ **Disclaimer:** This idea is for educational purposes only and does not constitute financial advice.
Always conduct your own due diligence and manage risk accordingly.