19.2K bounce and 17.5K targetMorning folks,
Overall action stands relatively quiet,so we have minimal changes since Mon. Overall context remains bearish. Maybe poor NFP numbers only could trigger more or less moderate bounce.
Here we have two targets. First one is 19.2K which could be finalized by minor butterfly with tactical upside response on intraday charts. This is the object for scalp traders, who wants to take long position.
At the same time, bears could try to sell possible rally, aiming on the next 17.5K target.
BTC now has no support at all - major levels have been broken, market is not at oversold. Only previous 20K top works like natural support line and holds the price by far. But it can't last forever.
Daily Charts


what if we distribute further in major indices?spx is in a correction wave of a terminal thrust distributively, and if we sink we distribute further. the .382, tram, and sss ma are levels of resistance and .618 and lower anchored vwap band are levels of support, .5 and nearby levels are pivot, but we may trend much lower in major indices. there are still bullish scenarios marked out and fib retrace levels are a guide as well as sss signal and qqe entries.

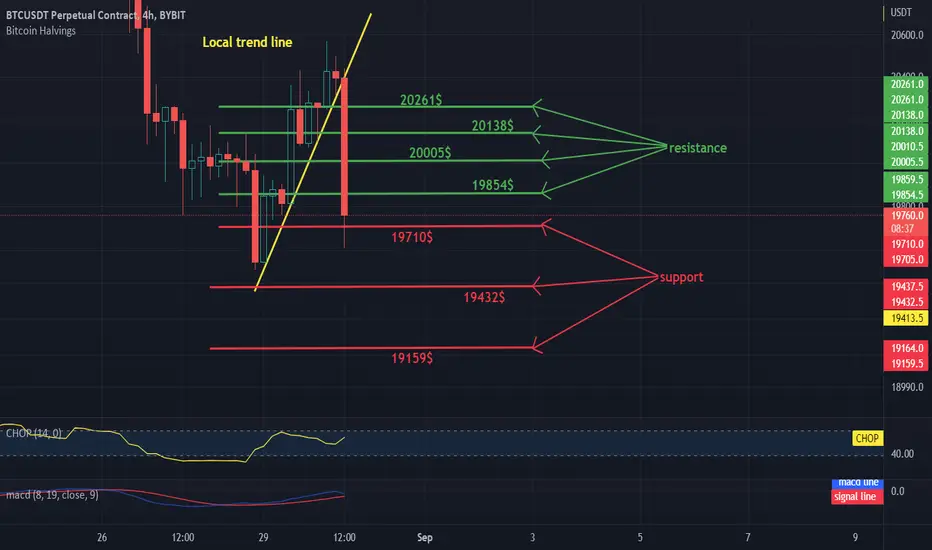
Daily BTC to USDT review on 4H intervalHello everyone, let's take a look at the BTC to USDT chart in 4 hours. As you can see, the price is moving above the local downtrend line.
Let's start with the designation of the support line and as you can see the first support in the near future is $ 19,710, if the support collapses, the next support is $ 19,432, $ 19,159.
Now let's move from the resistance line, because the first resistance is $ 19,854, if you can break it, the next resistance will be $ 2,0005, $ 20,308 and $ 20,261.
Looking at the CHOP indicator, we can see that we have a lot of energy in the 4H range, and the MACD indicator shows the local upward trend.
USDJPY - SIGNAL ON 15 MIN [BUY]Pair Name: USD/JPY
Time Frame: 15 MIN
Analise Type: liquidity zones, order blocks
Reasons:
•Bearish trend but London session created a false breakout
•New liquidity created that hopefully will be reacted by the price
•Previous liquidity reacted well by the price
•Daily low created in London Session

EURCHF 4 Hr. Short Opportunity! + Trading PlanWelcome back! Let me know your thoughts in the comments!
**EURCHF - Listen to video!
We recommend that you keep this pair on your watchlist and enter when the entry criteria of your strategy is met.
Please support this idea with a LIKE and COMMENT if you find it useful and Click "Follow" on our profile if you'd like these trade ideas delivered straight to your email in the future.
Thanks for your continued support!
Brian & Kenya Horton, BK Forex Academy

21.70-22K is vital bearish areaMorning folks,
Thursday plan has worked nice. Wyoming meeting just has confirmed our long-term view and why we call to stay aside of BTC since Jan 2022. BTW, we've prepared new fundamental report where we explain why it is not the time yet to invest, set downside targets and also share forecasts of long-term performance of BTC and US Stocks... ITs free on Forexpeacearmy website, just watch for Blog part and find my Blog - Sive Morten.
Now concerning the short-term. As market has no solid support, context remains bearish. Nearest downside targets are 19.2K and 17.5K. But, as daily bearish flag has been broken - for short term BTC it is vital to stay outside the flag. Otherwise stronger upside bounce is possible.
That's why for short-term bearish setup we consider 21.70-22.05K resistance area as a vital, because it also coincides with the flag trendline. For position taking you could consider any other Fib levels - 20.41K and 21K K-resistance.
We do not consider any long positions by far.

GOLD for a retest of the 1680 🦐GOLD on the daily chart after the recent retest of 0.382 Fibonacci level is moving to the daily support.
The market is looking for a possible break of the structure and a potential retest of the strong support level at the 1680 zone.
How can i approach this scenario?
I will wait for a potential break of the area and in that case i will look for a nice short order according to the Plancton's strategy rules.
--––
Follow the Shrimp 🦐
Keep in mind.
🟣 Purple structure -> Monthly structure.
🔴 Red structure -> Weekly structure.
🔵 Blue structure -> Daily structure.
🟡 Yellow structure -> 4h structure.
⚫️ Black structure -> <4h structure.
Here is the Plancton0618 technical analysis , please comment below if you have any questions.
The ENTRY in the market will be taken only if the condition of the Plancton0618 strategy will trigger

GBPJPY August 28thDaily Flag Pattern
4H Trendline markup for Daily Flag Pattern
4H Ascending Triangle being created after touching bottom of Flag Pattern
4H Bearish Correction
1H Bullish Engulfing on bottom of Ascending Triangle trendline & 4H Zone.
30m double bottom (reversal pattern).
Daily exhaustion at 4H Zone.


Nasdaq Higher Timeframes AnalysisPrice potentially formed a lower high filling the fair value gap on the weekly timeframe. Potential short from the H4 order block to continue lower and tap into the daily demand zone. Potential bullish reversal on the daily demand.

Is AUDNZD can take a breakout ?well here is the point where AUDNZD can take a breakout and take a buy side but if it unable to sustain above the buy zone then we'll go for sell entry to our target

GOLD can move higher? 🦐XAUUSD on the daily chart after the test of the daily resistanceretraced exactly at our beloved 0.618.
The market is now testing the 0.382 Fibonacci level and we can expect some further bullish move after the EU market open.
How can i approach this scenario?
If the price will break above the 0.382 resistance level i will look for a nice long order according to the Plancton's strategy rules.
--––
Follow the Shrimp 🦐
Keep in mind.
🟣 Purple structure -> Monthly structure.
🔴 Red structure -> Weekly structure.
🔵 Blue structure -> Daily structure.
🟡 Yellow structure -> 4h structure.
⚫️ Black structure -> <4h structure.
Here is the Plancton0618 technical analysis , please comment below if you have any questions.
The ENTRY in the market will be taken only if the condition of the Plancton0618 strategy will trigger

Short position against 25.6 resistanceMorning folks,
So, our Monday setup is accurately done - minor AB-CD pattern completed, and we have "222" Sell pattern. Wyoming could bring surprises, and break technical setup, no doubts. But this factor is external and stands out of our control. So, it makes no sense to rely on it. Technical picture looks bearish and suggests downside breakout. Supposedly short Sell might be considered with protection above 22.5 resistance area

ETH daily status; No bullish move expectedPrice zone $1700 - $1750 is a daily resistance area and I'm waiting to inspect the price action in its lower timeframes after touch. I think it looks more like a potential rejection.
Potential important levels are been highlighted in the chart.
DO YOUR OWN ANALYSIS.
DO NOT FORGET MONEY MANAGEMENT.
Things you might like:
- Trend Key Points Indicator have been used to draw important key levels and key points.
- 🔥 Strong Trading Strategy, Do not trust all the pin bars
- You can use Big Moves Indicator to be aware of major moves on the chart by marking them and getting alert for them.

CHFJPY - My Trading Plan in a picture!Hello TradingView Family / Fellow Traders. This is Richard, as known as theSignalyst.
on DAILY: Left Chart
CHFJPY is retesting the previous daily highs so we will be looking for sell setups.
Knowing that CHFJPY can still trade higher and break the zone upward.
That's why we don't sell blindly, we always zoom in to lower timeframes and look for the bears to take over.
on H1: Right Chart
CHFJPY is forming a channel in red but the lower trendline is not valid yet.
So we will be waiting for a third swing to form around it to consider it our trigger swing.
Trigger => waiting for that third swing to form and then sell after a momentum candle close below it.
Meanwhile, until the sell is activated, CHFJPY can still trade higher.
Which scenario do you think is more probable and why?
Always follow your trading plan regarding entry, risk management, and trade management.
Good luck!
All Strategies Are Good; If Managed Properly!
~Rich

25.2-25.5K seems interesting for new short positionMorning folks,
BTC goes with our long-term fundamental view and those who read our monthly reports knows about it since December 2021 when we've warned against long-term investments in BTC. This week end we have taken in-depth view on the US stock market that shows bad perspectives and BTC as usual is becoming a storm crower, with 600 Mln+ positions were liquidated just on Friday...
In short-term it seems that 25.2-25.4 resistance area might be interesting to consider another short position. Right now we do not consider any longs by far.

22-22.4K bounce up to 24-24.4 Morning folks,
So, longer-term perspective remains bearish by far as Fed minutes recently tells that tightening effect yet to come on the market, unemployment should start rising in II H of 2022 and Fed stands on the course of 0.5-0.75% rate change in September. In general this sounds hawkish enough.
The pullback from daily resistance that we've discussed last time has started accurately. But now market is coming to 22-22.4K support and if you still hold the short position - you have to decide how to manage it. WE suggest that downside action is not over yet, and in mid term it should continue to major ~20K area support. But in short-term it could be interrupted by the pullback to form larger bearish pattern - H&S on 1H chart. It means that starting from 22-22.4K area BTC could turn to form right arm top around 24-24.4K. This will be 2nd chance for short entry.
Bulls in turn, could consider scalp long trade if reversal patterns will be formed around neckline and support area.

Daily review of BTC interval 4HHello everyone, let's take a look at the BTC to USDT chart over the 4 hour timeframe. As you can see, the price is moving below the local downtrend line.
Let's start with the designation of the support line and as you can see the first support in the near future is $ 23,177, if the support breaks down, the next support is $ 22,903 and $ 22,681.
Now let's move from the resistance line as you can see the first resistance is $ 23,695, if you can break it the next resistance will be $ 23,942, $ 24,133 and $ 24,326.
Looking at the CHOP indicator, we can see that in the 4-hour interval we have a lot of energy and the MACD indicator shows a downward trend.

Daily review of BTC interval 4HHello everyone, let's take a look at the BTC to USDT chart over the 4 hour timeframe. As you can see, the price is moving above the local uptrend line.
Let's start with the designation of the support line and as you can see the first support in the near future is $ 23,945, if the support breaks down, the next support is $ 23,754, $ 23,578 and $ 23,422.
Now let's move from the resistance line as you can see the first resistance is $ 24,258, if you can break it the next resistance will be $ 24,493, $ 24,690 and $ 24,882.
Looking at the CHOP indicator, we can see that in the 4-hour interval we have a lot of energy and the MACD indicator shows a local downward trend.

Tactical bearish setup is readyMorning folks,
Our long term view stands intact - we do not exclude action up to 30K or even to 36K resistance within 6-9 months due changes in fundamental background - starting QE activity from the Fed and massive US government programmes up to $1 Trln. This should flow more liquidity on the markets. This is the way how Democrats would like to create the visuality of success, prosperity before November elections...
In short-term our XOP on 4H mostly is done, as well as butterfly. Thus, bears could think about position taking with initial stops above daily K-resistance of 26.35K. But this is tactical pullback by far. Do not merry the position, and better to focus on the lower border of daily channel, as the target by far.

this is my NJ 4hr/ daily mark up within this chart mark up i have tabs listed with details of my analyst feel free to review and even put the trades in demo first lets goooo

GBPUSD for a new test of the 1.23 🦐GBPUSD on the 4h chart after the recent lows retraced at the 0.5 Fib level below an important resistance.
The market is moving between the 0.5 and the 0.382 level.
How can i approach this scenario?
I will wait for the EU market open and IF the price will break above we will check the opportunity for a nice short order according to the Plancton's strategy rules.
------
Follow the Shrimp 🦐
Keep in mind.
🟣 Purple structure -> Monthly structure.
🔴 Red structure -> Weekly structure.
🔵 Blue structure -> Daily structure.
🟡 Yellow structure -> 4h structure.
⚫️ Black structure -> >4h structure.
Here is the Plancton0618 technical analysis , please comment below if you have any question.
The ENTRY in the market will be taken only if the condition of the Plancton0618 strategy will trigger.
