NZDHUF – Potential Long from Key Support ZonePEPPERSTONE:NZDHUF has reached a key support level, which has historically acted as a strong demand zone, leading to bullish reversals. The recent decline into this area suggests a potential opportunity for buyers to regain control and push prices higher.
A bullish confirmation, such as a strong rejection pattern, bullish engulfing candle, or long lower wick, would strengthen the case for an upward move. If buyers step in, price could rally toward 222.600. This setup aligns with a short-term bullish outlook within the broader market structure.
This is not financial advice but rather how I approach support/resistance zones. Remember, always wait for confirmation, like a rejection candle or volume spike before jumping in.
Please boost this post, every like and comment drives me to bring you more ideas! I’d love to hear your perspective in the comments.
Best of luck , TrendDiva
Dailyanalysis

EURUSD - Sell Setup After Key Support BreakOANDA:EURUSD has decisively broken below a key trendline, signaling an increase in bearish momentum. This breakdown suggests that sellers are gaining control, with the potential for further downside continuation.
In the near term, price may revisit the breakout level for a retest, where the previous support could now act as resistance. A failure to reclaim this level would reinforce bearish sentiment, increasing the likelihood of renewed selling pressure. If sellers maintain dominance, the price may head toward the 1.03120 level.
For confirmation of continued downside movement, traders should look for bearish technical signals, such as a rejection wick, a bearish engulfing candlestick, or increased selling volume. Conversely, a sustained move back above the resistance level could invalidate the bearish setup and shift the bias toward a potential bullish recovery.
This is not financial advice but rather how I approach support/resistance zones. Remember, always wait for confirmation before jumping in.
Please boost this post, every like and comment drives me to bring you more ideas! I’d love to hear your perspective in the comments.
Best of luck , TrendDiva

CADJPY - Buy Setup at Clear Support LevelOANDA:CADJPY is approaching a strong support zone, an area that has previously attracted buyers. The recent bearish momentum has pushed price closer to this zone, making it a key level to watch for potential buying interest.
If buyers step in and confirm the support with bullish price action—such as rejection wicks, bullish engulfing candles, or increasing buying volume—I anticipate a move toward 107.710. However, if price breaks below this level, it could signal further downside and invalidate the bullish outlook.
This is not financial advice but rather how I approach support/resistance zones. Remember, always wait for confirmation, whether it’s a strong rejection candle or a spike in volume, before making a move.
Your support means the world! Every like and comment motivates me to share more insights. Also, let me know your thoughts in the comments—I’d love to hear your perspective!
Best of luck , TrendDiva

GOLD at Critical Resistance – Reversal Incoming?OANDA:XAUUSD is trading at a key resistance zone, a level where sellers have previously taken control. If buyers fail to break through, we could see a rejection that sends the price lower toward $2,740.
I anticipate a move downward if we get bearish confirmation—such as rejection wicks, a bearish engulfing candle, or weakening buying pressure. However, a strong breakout and sustained hold above this zone could invalidate the setup, shifting momentum bullish and opening the door for new highs.
This is not financial advice but rather how I approach support/resistance zones. Remember, always wait for confirmation, like a rejection candle or volume spike before jumping in.
Please boost this post, every like and comment drives me to bring you more ideas! I’d love to hear your perspective in the comments.
Best of luck , TrendDiva

EURZAR at Key Demand Zone – Potential Buy OpportunityOANDA:EURZAR has reached a significant demand zone. This level has been a strong support in the past, with multiple historical rejections, suggesting that buyers could step in here again.
The current price action within the zone is crucial. If the price forms a clear bullish rejection pattern (such as bullish engulfing candles or long lower wicks), it may indicate a reversal, with a potential upward move toward the 19.40058 level. However, if the price consolidates further or breaks below this demand zone, it would signal weakness, and sellers could take control, invalidating the bullish outlook.
If you have additional insights or a different perspective, feel free to share your thoughts in the comments!

Bullish Setup on CHFJPY — Watching for Confirmation!OANDA:CHFJPY has reached a critical demand area where buyers have previously stepped in, leading to strong bullish momentum. This zone has historically provided a solid base for upward momentum, making it a key level to watch.
If we see bullish confirmation—such as rejection wicks, bullish engulfing candles, or a surge in buying volume—I anticipate a move toward 171.180, aligning with previous market structure. However, a decisive breakdown below this zone could weaken the bullish outlook and shift momentum downward.
This is not financial advice but rather how I approach support/resistance zones. Remember, always wait for confirmation, like a rejection candle or volume spike before jumping in.
Please boost this post, every like and comment drives me to bring you more ideas! I’d love to hear your perspective in the comments.
Best of luck , TrendDiva

AUDJPY at Key Support Zone - Will Buyers Regain Control?OANDA:AUDJPY has reached a significant demand zone marked by prior price reactions. This level aligns with a key support level that has historically shown buyer interest, suggesting a potential for reversal.
The recent bearish move appears to be testing this demand zone, and if the price shows a clear rejection through bullish price action signals—such as a strong engulfing candle or wicks rejecting lower prices—there is a likelihood of a rebound. I anticipate that if the demand zone holds, the market may see a rally toward the 97.300 level.
Let me know your thoughts on this analysis or if you see any alternative scenarios. Feel free to share in the comments!

EURJPY Testing Key Support Zone – Potential Buy SetupOANDA:EURJPY is approaching a key demand zone, an area where buyers have historically stepped in. The current market structure suggests the possibility of a bullish bounce if the price confirms a rejection from this zone.
The target at 161.857 is based on the expectation of buyers gaining momentum. If bullish price action confirms the demand zone as valid support, this setup offers a high-probability scenario.
Keep an eye on bullish confirmation signals, such as strong wicks or bullish engulfing candles, to validate the setup.
What’s your take on this analysis? Do you think the demand zone will hold, or do you anticipate further downside? Share your perspective below!

Platinum Testing Key Resistance - Reversal Ahead?OANDA:XPTUSD has reached a major resistance zone, where sellers have previously taken control. The current rally has been strong, but this level could act as a turning point if buyers start losing momentum.
If we see bearish confirmation—such as rejection wicks, bearish engulfing candles, or a drop in volume—I anticipate a move toward $971.78 level. A clear rejection here could fuel selling momentum, leading to further downside. However, if price breaks and holds above the zone, the bullish trend could extend higher.
This is not financial advice but rather how I approach support/resistance zones. Remember, always wait for confirmation, like a rejection candle or volume spike before jumping in.
Please boost this post, every like and comment drives me to bring you more ideas! I’d love to hear your perspective in the comments.
Best of luck , TrendDiva

SILVER at Key Resistance: Correction Ahead?OANDA:XAGEUR is currently approaching a key resistance zone. The ongoing bullish momentum may face exhaustion as price reaches this area, making it a potential turning point.
If bearish confirmation appears, such as rejection candles or a bearish engulfing pattern, I anticipate a pullback targeting the 29.49615 level. This area represents a logical target within the current market structure, reflecting a possible short-term correction.
This setup aligns with the idea of trend exhaustion near resistance. If you agree with this analysis or have additional insights, feel free to share your thoughts!

AUDJPY - Buy Opportunity at Key Support LevelOANDA:AUDJPY is approaching a significant support zone, where buyers have previously stepped in, leading to strong bullish reactions. The recent decline suggests a potential buying opportunity if the price shows signs of reversal.
A bullish confirmation, such as a strong rejection candle or a bounce from support, could indicate a move toward 97.240. However, a break below the support zone could invalidate this setup, signaling further downside.
This is not financial advice but rather how I approach support/resistance zones. Remember, always wait for confirmation, like a rejection candle or volume spike before jumping in.
Please boost this post, every like and comment drives me to bring you more ideas! I’d love to hear your perspective in the comments.
Best of luck , TrendDiva

GBPAUD at Key Resistance: Correction Ahead?OANDA:GBPAUD is approaching a key resistance zone, a level that could act as a potential turning point for the pair. As price moves into this area, bullish momentum may face exhaustion, creating the possibility for a reversal if sellers step in.
If bearish confirmation appears, such as rejection candles or a bearish engulfing pattern, I anticipate a pullback targeting the 1.9863 level. This area represents a logical target within the current market structure, reflecting a possible short-term correction.
This setup aligns with the idea of trend exhaustion near resistance. If you agree with this analysis or have additional insights, feel free to share your thoughts!

BTC 1D Interval Chart ReviewHello everyone, I invite you to review the current situation on BTC. When we enter the one-day interval, we can see how the BTC price moved in the local downtrend channel, from which we got an exit at the top and currently we can see how the price is fighting to maintain the position above the previous channel, and as a result, it has created a new local uptrend line for us.
Here we can see how the current rebound brought the movement closer to the resistance at $ 105,300, and then a strong resistance zone is visible from $ 107,700 to around $ 110,000. Only when we leave this zone at the top will the price be able to continue towards the very strong resistance level at $ 113,400.
Looking the other way, we can see that when the trend reverses, we first have a support zone from $102,000 to $99,900, but if this zone is broken, we can see a quick return of the price to the area of the second very strong support zone from $94,470 to $90,450.
On the MACD indicator, we can observe a fight to maintain the local upward trend, while lower on the RSI indicator, we can see that the increase in price has given a dynamic movement on the indicator, but we still have room for the price to go to a higher level.

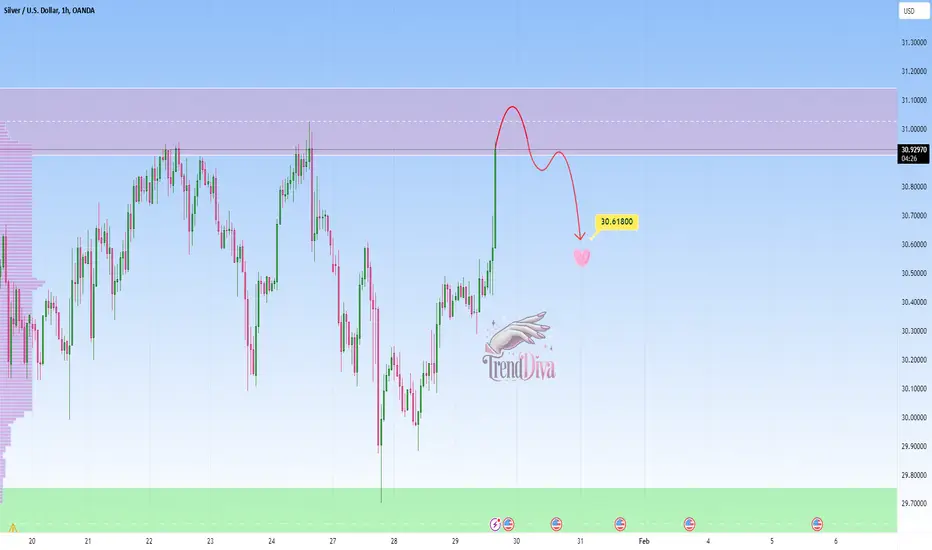
SILVER - Potential Short Setup at Key Resistance LevelOANDA:XAGUSD is currently testing a key resistance level, presenting a potential sell opportunity. If price fails to break above and holds below this resistance, a downward move towards 30.61800 could be expected.
A rejection at this level—confirmed by a bearish candlestick pattern or strong selling pressure—would strengthen the bearish outlook. Traders should watch for signs of failure to break resistance, which would support the short position. However, if the price breaks and closes above resistance, the bearish scenario would be invalidated, and the bias would shift to the upside.
This is not financial advice but rather how I approach support/resistance zones. Remember, always wait for confirmation, like a rejection candle or volume spike before jumping in.
Please boost this post, every like and comment drives me to bring you more ideas! I’d love to hear your perspective in the comments.
Best of luck , TrendDiva
ZARJPY - Potential Long from Key Support ZoneOANDA:ZARJPY is currently testing a significant support zone. The recent decline into this zone suggests a potential for buyers to regain control and push prices higher.
A bullish confirmation, such as a strong rejection pattern, bullish engulfing candles, or long lower wicks, would indicate an increased likelihood of a move upward. If this scenario unfolds, the price may head toward the 8.350 level.
This setup aligns with a potential short-term rebound within the broader market structure.
This is not financial advice but rather how I approach support/resistance zones. Remember, always wait for confirmation, like a rejection candle or volume spike before jumping in.
Please boost this post, every like and comment drives me to bring you more ideas! I’d love to hear your perspective in the comments.
Best of luck , TrendDiva

COTTON at Key Support - Potential Buy OpportunityFOREXCOM:COTTON has reached a critical support zone, aligning with previous price rejections and marking an area where buyers have historically regained control, leading to bullish reversals.
The current market structure indicates a potential bullish reaction if the price confirms a rejection from this zone. A likely scenario could involve the formation of a bullish rejection pattern, such as a pin bar or a bullish engulfing candle, signaling a shift in market momentum.
If buyers reclaim control at this level, I anticipate an upward move toward the 6,827.0 level, which is a logical profit target for the current market structure.
If you agree with this analysis or have additional insights, feel free to share your thoughts in the comments!

NZDSGD - Potential Long from Key Support ZoneOANDA:NZDSGD is approaching a key support level that has previously acted as a strong demand zone, leading to bullish momentum. The recent decline into this area suggests a potential opportunity for buyers to step in and push prices higher.
A bullish confirmation, such as a strong rejection pattern, bullish engulfing candle, or long lower wick, would increase the likelihood of an upward move. If buyers regain control, the price may head toward the 0.76630 level. This setup indicates a potential short-term rebound within the broader market structure
This is not financial advice but rather how I approach support/resistance zones. Remember, always wait for confirmation, like a rejection candle or volume spike before jumping in.
Please boost this post, every like and comment drives me to bring you more ideas! I’d love to hear your perspective in the comments.
Best of luck , TrendDiva

AUDUSD - Potential Bullish Continuation SetupOANDA:AUDUSD is currently trading within a well-defined ascending channel, reflecting a strong bullish market structure. The price is approaching a key support zone, which aligns with the lower boundary of the channel.
If the price holds at this support and buyers step in, a bullish continuation toward the 0.63380 level is likely, making it a reasonable target for an upward move.
Trade Considerations:
Wait for confirmation of buying pressure before entering a position.
Monitor for invalidation if the price breaks below the demand zone and the channel boundary, as this would signal potential downside momentum.
This is not financial advice but rather how I approach support/resistance zones. Remember, always wait for confirmation, like a rejection candle or volume spike before jumping in.
Please boost this post, every like and comment drives me to bring you more ideas! I’d love to hear your perspective in the comments.
Best of luck , TrendDiva

EURAUD: Sell Setup at Key Resistance Zone OANDA:EURAUD is testing a significant resistance zone, a level where price has historically struggled to break higher. This area represents a potential reversal point, as the market structure suggests sellers may regain control.
If the price confirms a rejection at this resistance zone, I anticipate a potential move downward toward the 1.65600 level, which represents a logical target for this setup.
If you agree with this analysis or have additional insights, feel free to share your thoughts in the comments!

AUS200 - Potential SHORT setupPEPPERSTONE:AUS200 is currently in a critical resistance zone that has consistently acted as a barrier for bullish momentum.
Taking this into account I anticipate a move toward at least 8,250. However, if the resistance fails to hold, it may open the door for further upside.
Proper risk management is essential, given the possibility of price breaking higher.
Feel free to share your opinions in the comments.

Forecast UPDATES! Jan 15, WedIn this video, we will update the forecasts for the following markets:
ES \ S&P 500
NQ | NASDAQ 100
YM | Dow Jones 30
GC |Gold
SiI | Silver
PL | Platinum
HG | Copper
Enjoy!
May profits be upon you.
Leave any questions or comments in the comment section.
I appreciate any feedback from my viewers!
Like and/or subscribe if you want more accurate analysis.
Thank you so much!
Disclaimer:
I do not provide personal investment advice and I am not a qualified licensed investment advisor.
All information found here, including any ideas, opinions, views, predictions, forecasts, commentaries, suggestions, expressed or implied herein, are for informational, entertainment or educational purposes only and should not be construed as personal investment advice. While the information provided is believed to be accurate, it may include errors or inaccuracies.
I will not and cannot be held liable for any actions you take as a result of anything you read here.
Conduct your own due diligence, or consult a licensed financial advisor or broker before making any and all investment decisions. Any investments, trades, speculations, or decisions made on the basis of any information found on this channel, expressed or implied herein, are committed at your own risk, financial or otherwise.

#BTC - Bitcoin to $100K - What's Next? Major milestone for #BTC hitting $100K
After a short correction we saw a break to the long awaited $100K
Why I believe a sweep below is in the forming for the nex 5-10 days:
The highest liquidity was above 100K, it got swept
Price retraced to 60%, then extended to the current zone with forming a HTF FVG
Given the liquidity now is way low, it needs to extend a bit more to the 1.382 - 1.618, which is a deviation, form some liquidity then trick everyone that we'll continue to 110-115k
Plenty of retail will now go long on it given it passed the psychological barrier - will attract even more late longs
the #TOTAL market cap is already extended and the funding rates are heating up quite fast
Be on the lookout, take some profits if possible and prepare for the next leg up in around a week!

UNION BANK 1D TFNSE:UNIONBANK has formed a resistance zone with multiple touch points. If the stock breaks out the stock could traded.
Disclaimer:- This analysis is only for educational purpose. Please always do your own analysis or consult with your financial advisor before taking any kind of trades
