TradeCityPro | Bitcoin Daily Analysis #58👋 Welcome to TradeCity Pro!
Today, we'll delve into the analysis of Bitcoin and key crypto indices. As usual, I want to review the triggers for the New York futures session.
🔄 Yesterday, the price broke through the support zone between 80,595 and 81,522, retracing down to 78,778. Let's see what triggers the market could offer us today.
⌛️ 1-Hour Timeframe
On the 1-hour timeframe, as you can see, after breaking the 78,778 level, the price quickly recovered and climbed back above the 81,522 zone. Currently, it is hovering near 83,349.
🔍 Today, for a long position, we can consider opening a trade upon breaking the 83,349 resistance. The next resistance level at 84,572 could act as the following trigger point.
🔽 For short positions, we need to wait for a new market structure to form and observe whether the 81,522 or 80,595 zones can serve as our triggers.
⭐️ The RSI oscillator is near the Overbought zone, and a breakout above 70 into Overbought territory would provide good confirmation for a long position.
📊 Market volume has been increasing since the bullish leg started from 78,778. If this volume growth continues, the probability of breaking through the 83,349 resistance will rise.
👑 BTC.D Analysis
Now, let's move to Bitcoin Dominance (BTC.D). Yesterday, the 63.50 resistance was broken, and as Bitcoin's price climbed, its dominance also rose. This has caused altcoins to underperform compared to Bitcoin.
🔼 Currently, the next resistance for BTC.D is at 63.86. A break above this level would confirm the next bullish leg in Bitcoin Dominance.
📉 For a bearish move in dominance, the Futures triggers are at 63.50 and 63.30. However, for a confirmation in spot trading, we would need a break below 62.65.
📅 Total2 Analysis
Moving on to the Total2 (altcoin market cap excluding Bitcoin), I've slightly adjusted the zones and updated the triggers for altcoins.
✨ As I mentioned in the Bitcoin Dominance analysis, altcoins have been lagging behind Bitcoin. Even though Bitcoin reached 83,349, Total2 failed to retest its previous highs and instead formed a lower high.
✔️ For long positions on altcoins, a break above 940 would be ideal. For short positions, you can look for confirmation if 903 is broken.
📅 USDT.D Analysis
Finally, let's analyze USDT Dominance (USDT.D). Yesterday, it bounced from the 5.53 support level, climbing to 5.84 before starting a new downtrend, now approaching 5.53 again.
⚡️ To continue the bearish move, a break below 5.53 would be significant. Conversely, for a bullish move, the first trigger is at 5.84.
❌ Disclaimer ❌
Trading futures is highly risky and dangerous. If you're not an expert, these triggers may not be suitable for you. You should first learn risk and capital management. You can also use the educational content from this channel.
Finally, these triggers reflect my personal opinions on price action, and the market may move completely against this analysis. So, do your own research before opening any position.
Dailyanalysis

XAG/USD Climbs on FOMC WorriesSilver prices climbed above $31 per ounce on Thursday, extending gains for a second straight session as commodities rebounded following President Trump’s rollback of his reciprocal tariff policy. The new measure lowers tariffs on most trade partners to 10% for 90 days to support negotiations. However, China, a key silver consumer, still faces a steep 125% tariff, keeping geopolitical tensions elevated and sustaining safe-haven demand. Meanwhile, FOMC minutes revealed growing concerns about stagflation and the impact of Trump’s trade agenda on the Fed’s dual mandate of price stability and full employment.
Resistance starts at 31.50; if breached, the next levels are 32.15 and 33.30. Support sits at 30.20, with 29.50 and 29.20 below if that level gives way.

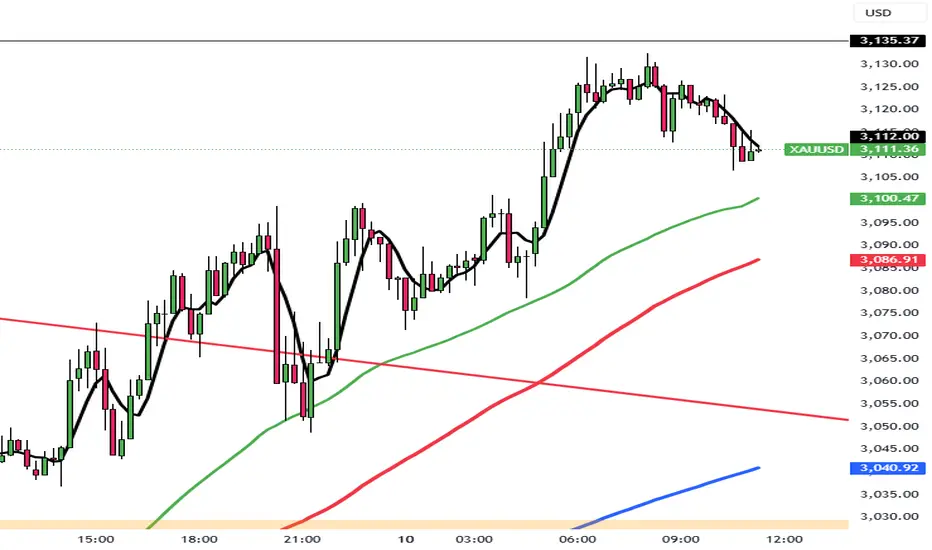
Gold Surges, Hits Record Above $3,200Gold spiked to a new record above $3,200 per ounce on Friday, driven by safe-haven demand and a weakening dollar amid intensifying U.S.-China trade tensions. The U.S. hiked tariffs on China to 145%, while easing duties for other partners. At the same time, U.S. consumer prices unexpectedly fell in March, fueling bets on a Fed rate cut in June and a full percentage point cut by year-end. Despite this, inflation risks remain due to ongoing tariff pressure. Gold is set for its strongest weekly gain since November.
Key resistance is at $3,250, followed by $3,300 and $3,350. Support stands at $3165, then $3135 and $3090.

Pound Gains on Dollar Softening, GBP/USD at $1.30The pound extended gains to $1.30 for a third session, as the dollar softened following Trump’s 90-day tariff pause for most countries. However, the 145% hike on Chinese goods kept risks elevated. While volatility persists, traders now expect 66 bps of BoE rate cuts this year, down from 79 bps a day earlier. UK GDP is forecast to grow 0.1% in February, suggesting a slow recovery.
If GBP/USD breaks above 1.3050, resistance levels are at 1.3100 and 1.3200. Support is at 1.2960, followed by 1.2900 and 1.2850.

EU Tariff Relief Drives Euro Above $1.13The euro climbed above $1.13, its highest since September 2024, after the EU suspended new U.S. tariffs for 90 days to allow trade talks. This followed President Trump’s move to cut tariffs to 10% for non-retaliating countries while raising Chinese duties to 125%. While easing global slowdown fears, the mixed signals fueled uncertainty. Money markets adjusted ECB expectations, pricing the deposit rate at 1.8% by December, up from 1.65%, and lowered the probability of an April cut to 90%.
Key resistance is at 1.1390, followed by 1.1425 and 1.1500. Support lies at 1.1260, then 1.1180, and 1.1100.

Yen Gains on Recession FearsThe yen rose past 144 per dollar, a six-month high, as U.S. recession fears and a Treasury selloff boosted demand for safe-haven assets. Although Trump paused new tariffs for 90 days, total U.S. tariffs on China now stand at 145%, prompting retaliation with China imposing 84% tariffs on U.S. goods. The U.S.-Japan trade outlook remains in focus, with Japan still facing a 10% U.S. tariff but seeking better terms.
Key resistance is at 145.80, with further levels at 148.00 and 152.70. Support stands at 142.00, followed by 139.65 and 138.00.

TradeCityPro | Bitcoin Daily Analysis #57👋 Welcome to TradeCity Pro!
Today, we'll delve into the analysis of Bitcoin and key crypto indices. As usual, I want to review the triggers for the New York futures session.
🔄 Yesterday, there was news from Trump granting a 90-day tariff reprieve to all countries except China, which activated both long triggers I outlined for you yesterday—one before the news and one after.
⏳ 1-Hour Time Frame
In the hourly time frame, as you can see, after the price was supported at 74760 in yesterday's analysis, I mentioned that breaking 77735 could be a risky long entry and breaking 80595 would activate the Double Bottom long trigger.
🔍 As observed, the first trigger at 77735 provided a very good entry, allowing us to open a robust position. However, the 80595 position, as it activated a four-hour pattern, naturally takes longer to reach the target or stop-loss.
📈 Currently, the price has made a bullish leg and is in a correction phase, and we need to see how far this correction can continue. A new support is forming at 81522, where the price had previously shown support and is now being supported again.
✔️ With 80595 and 81522 being close, we can say that a yet unconfirmed support zone has formed around this area, and the price could start its next bullish move after correcting into this zone.
🔼 Thus, for a long position, reacting to this support zone and breaking the short-term ceiling in lower time frames can give us a position. The next trigger is breaking the ceiling at 83349, which could start the next bullish leg upon making a higher high.
💫 However, the main trigger for going long is breaking 84572, which is a major resistance. Since this area is very significant, I wouldn't open a position with just the break of 83349, as a rejection from 84572 could hit our stop-loss and poses a high risk.
✨ If you recall, in analysis number 52, I drew a trendline in the daily time frame that now coincides with this price area, and the trigger for breaking this trendline overlaps with 84572, another reason this resistance is significant and why its breach is crucial.
🔽 For short positions, as you know from following my analyses, I trade based on the current momentum and market trend. Since we have entered a bullish momentum and no bearish structure has been formed yet, there is no reason for a short position. However, if you still want to open one no matter what, breaking areas 81522 or 80595 could be very risky but suitable.
👑 BTC.D Analysis
Yesterday, there was a detailed analysis of Bitcoin dominance, complete with explanations of its utility and why we use it. I strongly recommend reviewing that analysis to understand why this chart needs to be checked and what's happening in its higher time frames.
☘️ Yesterday, the dominance faked out from the area of 63.30, then returned above this area, moving towards the ceiling of the box it had created, 63.50, and now it seems to be faking this area too.
⚡️ When this occurs in the chart, it indicates that the chart is not analyzable correctly, and we must wait until a proper structure is formed. Until then, we can decide candle by candle, following the momentum of each candle.
📅 Total2 Analysis
Moving on to the analysis of Total2, triggers in the areas of 896 and 920 were activated, and the price movement continued near the area of 965, now entering a corrective phase.
📊 The support floor being formed is slightly above 920, and we should wait for a new structure. Until then, breaking 965 for a long and breaking 920 for a short are suitable.
📅 USDT.D Analysis
Let's turn to Tether dominance, which, like Total2 and Bitcoin, has had its triggers activated and moved downward, reaching the support area at 5.53.
🎲 We confirm the continuation of the downtrend with the break of this 5.53, and for further correction, breaking 5.73 gives us confirmation.
❌ Disclaimer ❌
Trading futures is highly risky and dangerous. If you're not an expert, these triggers may not be suitable for you. You should first learn risk and capital management. You can also use the educational content from this channel.
Finally, these triggers reflect my personal opinions on price action, and the market may move completely against this analysis. So, do your own research before opening any position.

Silver Remains Volatile Amid Trade War and Recession FearsSilver stayed above $30.50 per ounce on strong safe-haven demand amid U.S.-China trade tensions. Prices held a 3.5% gain after President Trump announced a 90-day tariff pause and a 10% rate for all but China, which now faces a 125% tariff. China raised tariffs on U.S. goods to 84%, and the EU approved duties on €21 billion of American exports. Fed minutes showed concerns about stagflation and the impact of Trump’s trade policies. Markets now await March U.S. inflation data on Thursday for clues on the Fed’s next move.
Technically, the first resistance level is located at 31.50. In case of its breach 32.15 and 33.30 could be monitored respectively. On the downside, the first support is at 30.20. 29.50 and 29.20 would become the next support levels if this level is passed.

Gold Jumps 3% on U.S.-China Tariff BattleGold jumped over 3% to above $3,095 per ounce on Wednesday as U.S.-China trade tensions escalated. President Trump announced a 90-day tariff pause and a reduced 10% rate for all but China, which now faces a 125% tariff. Treasury Secretary Bessent said the lower rate would apply during talks, excluding China and some sectors. In response, China raised tariffs on U.S. goods to 84%, and the EU approved levies on €21 billion worth of American exports. Fed minutes showed policymakers expect higher inflation from tariffs but remain uncertain about its scale and duration.
Supporting gold’s rally further, the World Gold Council reported that gold-backed ETFs attracted 226.5 metric tons in inflows during Q1, totaling $21.1 billion in value.
Key resistance is at $3,135, followed by $3,165 and $3,200. Support stands at $3030, then $3010 and $2956.
GBP/USD Awaits CPI After Tariff-Driven GainGBP/USD hovered near 1.2830 on Thursday morning, holding its upward momentum for a third straight session. The pair remained supported as market sentiment improved following Trump’s tariff pause. All eyes are now on today’s U.S. inflation data, which is expected to influence the next move.
If GBP/USD breaks above 1.2860, resistance levels are at 1.2900 and 1.2940. Support is at 1.2715, followed by 1.2650 and 1.2600.

Euro Steady as EU Retaliates on TariffsThe euro hovered around 1.0980 on Thursday, supported by rising trade tensions and renewed political stability in the Eurozone. Sentiment favored the currency after China raised tariffs on all U.S. goods to 84% from 34%, retaliating against Washington’s hike to 104% on Chinese imports. The European Commission also approved retaliatory tariffs on €21 billion worth of U.S. goods, including soybeans, motorcycles, and orange juice. The escalation pushed investors away from typical safe havens like the dollar and Treasuries. Political stability in Germany further supported the euro, as the CDU/CSU and SPD finalized a coalition, clearing the way for Friedrich Merz to become Chancellor next month. The ECB is also expected to cut rates by 25 basis points later this month.
Key resistance is at 1.1020, followed by 1.1100 and 1.1150. Support lies at 1.0880, then 1.0810 and 1.0730.

TradeCityPro | Bitcoin Daily Analysis #56👋 Welcome to TradeCity Pro!
Let's dive into the analysis of Bitcoin and key crypto indices. Today, as usual, I will review the New York futures session triggers.
✔️ Yesterday, the short trigger we discussed was activated, and the price moved downward to the area of 74760.
👀 Today, the market conditions are favorable for opening positions, both long and short.
⏳ 1-Hour Timeframe
As I mentioned yesterday, the price executed another downward leg after pulling back to the 80595 area, activating our trigger at 78913 and moving to the main support floor. Today, I have adjusted this area, and we will explore why this adjustment was made.
📚 Positions like the one yesterday, which are opened for scalping, I usually set with a risk to reward ratio of 2 or 3, and I don’t leave them open for long, opting instead to secure profits. If you also open such positions, I recommend not holding them long term.
💥 However, today, as you can see, the price is forming more structure and giving us more logical triggers. The SMA99 indicator is nearing the price, and the RSI is showing divergence compared to the first bottom that the price made at 74650, which was accompanied by divergence.
🔼 For the divergence in RSI to activate, it needs to break the area of 59.87. If this happens, we can say that the divergence is active, and we can look for a price trigger for a long position.
⚡️ The first trigger for a long position is the 77735 area, which is considered risky, and with the breaking of this area, you can open a scalping position. The main long trigger is the breaking of 80595, which, if broken, activates a Double Bottom pattern that could change the market trend.
⭐ Keep in mind, there is currently no Double Bottom, and only if the 80595 area breaks will this pattern form.
📉 For a short position, the 74760 trigger is still appropriate, and you can enter a short position if this area breaks. However, it is important to note that this area is very close to the 71779 area, and opening a position on the break of 74760 will be risky.
👑 BTC.D Analysis
Let's now analyze Bitcoin dominance, which continues to range between the areas of 63.30 and 63.50. Breaking this box could define the positions we open today.
💫 If the 63.30 area breaks, dominance might temporarily decline, allowing more capital to flow into altcoins. Conversely, if the dominance breaks upwards at 63.50, more capital will flow into Bitcoin. Soon, we will have a comprehensive analysis of Bitcoin dominance that I highly recommend not to miss.
📅 Total2 Analysis
Moving on to the analysis of Total2, yesterday the Total2 trigger at the 896 area was activated, and altcoins, like Bitcoin, declined, causing this index to drop to the area of 860.
🔍 Today, for a short position, breaking the 860 area is appropriate. However, for a long position, I recommend seeking confirmation from Bitcoin itself and its dominance.
📅 USDT.D Analysis
Finally, for the Tether dominance analysis, this index activated its upward trigger at the 5.84 area and performed an upward leg to 6.13.
📊 Currently, confirmation for the next upward leg in dominance will be with the breaking of 6.13, and the confirmation for a downward turn remains at the 5.73 area.
❌ Disclaimer ❌
Trading futures is highly risky and dangerous. If you're not an expert, these triggers may not be suitable for you. You should first learn risk and capital management. You can also use the educational content from this channel.
Finally, these triggers reflect my personal opinions on price action, and the market may move completely against this analysis. So, do your own research before opening any position.

Yields and Trade Wars Induce Silver InstabilitySilver dropped below $30 per ounce, hitting $29.57 on April 4, its lowest since mid-January, as rising U.S. Treasury yields made non-yielding assets less attractive. The U.S. announced a 104% tariff on Chinese imports starting at midnight, intensifying trade war concerns. Although over 70 countries have reportedly requested tariff relief, market sentiment remains cautious. The EU’s retaliatory tariff plans further fueled risk aversion, pressuring industrial metals. Still, expectations of Fed rate cuts and safe-haven demand offer some support.
Technically, the first resistance level is located at 30.90. In case of its breach, 31.40 and 32.50 could be monitored respectively. On the downside, first support is at 29.00. 28.40 and 27.50 would become the next support levels if this level is passed.

Gold Experiences Surge with Economic FearsGold soared to around $3,000 per ounce as investors sought refuge from intensifying trade war concerns and recession risks. The U.S. confirmed a new round of tariffs with no exemptions, China faces a record 104% hike. Trump also warned of a forthcoming pharmaceutical import tariff. The market is now focused on the Fed's March meeting minutes, set for release later today, for potential rate cut clues. Ongoing central bank purchases and strong ETF demand, China’s ETF added 233,000 ounces, also supported the rally.
Key resistance is at $3,035, followed by $3,085 and $3,105. Support stands at $2,956, then $2,930 and $2830.

Sterling Remains Firm Despite Inflationary PressuresGBP/USD traded around 1.2830 on Wednesday, holding gains from the previous session. However, ongoing global trade tensions and fears of goods dumping from China and Europe weighed on sentiment. Though U.S. tariffs are relatively lower on the UK, broader economic concerns persist. At the same time, rising inflation risks may lower expectations for rate cuts, providing some support to the pound.
If GBP/USD breaks above 1.2850, resistance levels are at 1.2900 and 1.2940. Support is at 1.2715, followed by 1.2650 and 1.2600.

Dollar Under Pressure from Recessionary SignalsEUR/USD climbed about 80 pips to 1.1040 on Wednesday as the dollar index slipped below 105.5, marking a second day of losses. The U.S. dollar weakened amid growing fears of recession, triggered by President Trump's sweeping tariffs. China now faces a 104% levy, with Beijing vowing to "fight to the end." Market sentiment remained cautious as trade negotiations stalled, despite Trump’s outreach to major partners. Concerns that the escalating trade war may tip the U.S. into recession have increased expectations of further Fed rate cuts, weighing on the dollar.
Key resistance is at 1.1100, followed by 1.1150 and 1.1215. Support lies at 1.0900, then 1.0850 and 1.0730.

Yen Appreciates with Trade TurmoilThe Japanese yen rose above 146 per dollar on Wednesday, extending gains as Trump's looming tariffs drove safe-haven flows. The dollar weakened on recession fears tied to escalating trade tensions and potential Fed rate cuts. New U.S. tariffs include a 24% duty on Japanese goods and a 25% car import levy. Trump confirmed that Japan will send a delegation to renegotiate terms, while PM Ishiba urged a policy rethink. Domestically, Japan's current account surplus hit a record in February, supported by strong exports and reduced imports, boosting the yen further.
Key resistance is at 148.70, with further levels at 152.70 and 157.70. Support stands at 145.60, followed by 143.00 and 141.80.

TradeCityPro | Bitcoin Daily Analysis #55👋 Welcome to TradeCity Pro!
Let's delve into the analysis of Bitcoin and key crypto indices, focusing today on the New York futures session triggers as usual.
🔄 Yesterday, the market was in a corrective phase of a downward trend, coinciding with news about the date of a meeting between Iran and the USA, which caused a slight upward movement in the market.
📊 As I mentioned, due to the low market volume, any news from the USA can significantly impact the price. The news was that Iran and the USA have scheduled a meeting for Saturday to negotiate an agreement.
📰 However, a more significant news item that the whole world is waiting for is China's reaction to the 35% tariffs imposed by the USA. Trump has declared that if China does not accept these tariffs within the next few days, he will increase them to 50%.
🎲 If this happens, the next downward leg in price might begin. However, if news comes out that these two countries are nearing an agreement and are ready to negotiate tariffs, the market will undoubtedly move upwards, and this news could even be the start of a new bullish trend.
Let's move on to the chart to find the technical triggers.
⏳ 1-Hour Timeframe
As I said yesterday, with the breaking of the 50 area in the RSI, the price underwent a deeper correction and moved upwards.
⭐ It appears that an ascending structure is forming, and the price is steadily moving upwards. However, this movement doesn't have much upward momentum, and its volume isn't very high.
🔽 Today, for a short position, we can open a position in line with the trend at a high risk with the break of the 78913 area. The price has corrected to a reasonable extent and has pulled back near the SMA99. If the price moves towards this SMA and gets rejected, the importance of breaking 78913 will increase.
📉 The main trigger is currently the 74760 area, which is the market's primary floor. However, in general, I believe that the market structure isn't yet in a state where we should open major positions, and we should wait for more structure to form. This way, we can open more secure and precise positions, which would allow us to take higher risks and ultimately make more profit.
💫 If you want to open a short position with the break of 78913, the RSI moving below the 50 area could be a good confirmation, but be careful not to involve too much risk.
👑 BTC.D Analysis
Let's move to the analysis of Bitcoin dominance, which is still ascending and has created a temporary support floor at 63.30. If this area breaks, we might temporarily confirm a decline in dominance.
🚀 Keep in mind that the dominance trend is bullish in all market cycles, and breaking this area does not mean a bearish trend. However, if it breaks 63.30, dominance might pull back to 63.07 and could enter a correction phase for a few days, which would impact our position choices.
✔️ If dominance is supported from this area, the likelihood of its continued growth increases.
📅 Total2 Analysis
Moving on to the analysis of Total2, as you can see, with the slight correction of Bitcoin dominance, this index has performed slightly better than Bitcoin and has currently reached a similar peak at 920.
📉 The short trigger I gave on Bitcoin at 78913 is a better trigger compared to Total2, where the 896 area has not yet been tested and is riskier than Bitcoin.
🔼 For long positions, you can open one with the break of 920, but I do not recommend it because the market is in a downward trend, and there is a downward momentum in the market, and since I do not trade against the trend, I also do not recommend that you take a long position against the downward trend.
📅 USDT.D Analysis
Finally, the analysis of Tether dominance is performing similarly to Total2 and is currently fluctuating between 5.73 and 5.84.
✨ Both of these areas could be used as triggers, but as I mentioned, it's better to wait for the market to create more structure and reveal the main triggers.
❌ Disclaimer ❌
Trading futures is highly risky and dangerous. If you're not an expert, these triggers may not be suitable for you. You should first learn risk and capital management. You can also use the educational content from this channel.
Finally, these triggers reflect my personal opinions on price action, and the market may move completely against this analysis. So, do your own research before opening any position.

Silver Holds Ground as Markets Eye Fed CutsSilver hovered around $30 per ounce on Monday, staying volatile as markets reacted to Trump’s escalating trade war. The metal dropped 16% over three sessions as recession fears sparked a broad selloff, with traders liquidating metals to cover losses. China retaliated with tariffs after the US imposed levies on all countries, with others expected to follow. Trump’s tariffs excluded copper, gold, energy, and certain minerals. Despite the slump, silver may regain support as markets bet on more Fed rate cuts this year.
Technically first resistance level is located at 30.90. In case of its breach 31.40 and 32.50 could be monitored respectively. On the downside, the first support is at 29.00. 28.40 and 27.50 would become the next support levels if this level is passed.

Gold Jumps on Fresh Trade War WorriesGold rose above $2,995/oz on Tuesday, rebounding from a 4-week low as trade war fears fueled haven demand. Trump threatened a 50% duty on China starting Wednesday unless it drops its 34% tariffs, while the EU proposed 25% counter-tariffs on U.S. goods. Markets await Fed minutes (Wed), CPI (Thu), and PPI (Fri) for policy clues. Despite recent losses, gold is still up over 14% YTD.
Key resistance is at $3,050, followed by $3,085 and $3,105. Support stands at $2,956, then $2,930 and $2830.

Euro Firms as U.S.-China-EU Trade Rift WidensThe euro hovered near $1.10, its highest since October 2024, as the dollar weakened and trade tensions escalated. China plans to impose 34% tariffs on all U.S. goods from April 10, following Trump’s 10% tariff on all imports, including 20% on EU and 34% on Chinese goods. France urged firms to halt U.S. investments, and the EU is preparing countermeasures. Markets now price in a 90% chance of an ECB rate cut in April, with the deposit rate seen falling to 1.65% by December from 2.5%.
Key resistance is at 1.1100, followed by 1.1150 and 1.1215. Support lies at 1.0900, then 1.0850 and 1.0730.

TradeCityPro | Bitcoin Daily Analysis #54👋 Welcome to TradeCity Pro!
Let's delve into the analysis of Bitcoin and key crypto indices. As usual, I will review the New York futures session triggers for you.
⚡️ The market has experienced a drop since yesterday, and I had identified the triggers for this drop in the previous analysis. Let's analyze today to see what we can do in the market.
⏳ 1-Hour Timeframe
In the 1-hour timeframe, as you can see, the price made a downward move after the triggers at 82633 and 81473 were activated, even breaking the important support at 79120 and now has rebounded from the area of 74760.
✔️ If we draw a Fibonacci from this downward leg, we can find potential resistance levels. A few moments ago, there was also a fake news report from Trump stating that he would give 90 days to all countries except China to start tariffs, which, although fake, had a significant impact on the market.
📊 The market volume is very low, which makes it susceptible to such short and small news about tariffs to react this way.
📰 If such news continues and the market acts emotionally, the technical analysis I perform for you will not be very reliable, and the price will move more emotionally.
🔼 However, if these emotional moves end and the price stabilizes in these areas, the potential resistances we have are the Fibonacci levels of 0.5, 0.618, and 0.786, where the 0.5 and 0.786 areas overlap with static price resistances, and the 0.618 area, being the golden Fibonacci, could prevent further price drops.
💥 The RSI oscillator, after a sharp fall and being mostly in Oversell yesterday, has finally exited this area and now reached around 50. If this area is broken in the RSI, the likelihood of a deeper correction will increase.
📉 Today, for a short position, we only have the break of the 74760 area, which I also suggest not opening a position with this trigger because the market has recently moved and needs to create a new structure.
📈 For long positions, according to the strategy I have, it does not make sense for me to open a position in this trend that has so much downward momentum. The best analogy is that when a knife is falling, you shouldn't try to catch it mid-air because it might cut your hand; you should wait for it to fall to the ground so you can pick it up safely without risk.
Let's look at the indices to take a look at the situation with altcoins.
👑 BTC.D Analysis
Bitcoin dominance has made another upward move after breaking 63.07. This caused altcoins to fall more than Bitcoin during this drop, and short positions on altcoins would have given us more profit compared to Bitcoin.
🚀 In the analyses of Bitcoin and altcoins, I've repeatedly told you that for buying altcoins, we should wait until Bitcoin dominance starts to drop. That hasn't happened yet, and it still has a strong upward trend, so today if the market gives a short trigger, altcoins would be more logical.
📅 Total2 Analysis
As you can see, this index has fallen much more than Bitcoin, experiencing a very sharp downward leg upon activating the trigger at 965.
⭐ Currently, I've only added the 949 line to the chart, which overlaps with the 0.786 Fibonacci of this downward leg, and I haven't added any other lines and am waiting for the price to create its structure.
✨ The nearest support the price has is 816, which is very important, and there is nothing else notable about Total2 yet, and we need to wait until a structure is created that can be analyzed.
🎲 The only opinion I can give for now is that the 816 area is very important, and reaching this area in Total2 could end its downward trend, which is more like a prediction than an analysis and is a gut feeling and currently has no logical reason.
📅 USDT.D Analysis
Let's move on to the analysis of Tether dominance, which is very similar to Total2 but seems like a reverse of it.
👀 Yesterday, the trigger at 5.53 activated simultaneously with 965 in Total2, and the dominance moved upward. There's not much I can analyze about this chart, and the main resistance is in the area of 6.34, which acts like the 816 in Total2.
❌ Disclaimer ❌
Trading futures is highly risky and dangerous. If you're not an expert, these triggers may not be suitable for you. You should first learn risk and capital management. You can also use the educational content from this channel.
Finally, these triggers reflect my personal opinions on price action, and the market may move completely against this analysis. So, do your own research before opening any position.

Yen Fluctuates on Global Tariff VolatilityThe yen fluctuated on Monday, rising to 145 per dollar before easing to 147, as global trade tensions and reciprocal tariffs triggered market volatility. Fears of a global recession drove demand for safe havens like the yen, Swiss franc, and bonds. Japan’s February wage growth offered some optimism, and the Bank of Japan is still expected to raise rates this year despite ongoing uncertainty.
Key resistance is at 147.00, with further levels at 152.70 and 157.70. Support stands at 145.60, followed by 143.00 and 141.80.
