Japan's Tariff Worries and BOJ Rate Hike HintsThe Japanese yen remained weak around 150.7 per dollar on Tuesday, near a three-week low, as the U.S. dollar gained strength. Trump's plan to impose tariffs on autos, pharmaceuticals, and other sectors raised concerns for Japan’s export-driven economy.
BOJ minutes from January showed officials remain open to future rate hikes depending on wage and inflation trends, with one member suggesting a possible increase to 1% in late fiscal 2025. Still, the BOJ kept rates steady at 0.5% last week, maintaining a cautious stance with global tensions.
Key resistance is at 151.70, with further levels at 152.70 and 154.00. Support stands at 147.00, followed by 145.80 and 143.00.
Dailyanalysis

TradeCityPro | Bitcoin Daily Analysis #43👋 Welcome to TradeCity Pro!
Let's dive into the analysis of Bitcoin and other key crypto indices. As usual, I want to discuss the futures triggers for the New York session.
⏳ 1-Hour Timeframe
In the 1-hour timeframe, as you can see, Bitcoin finally moved, activating our trigger, and it reached its target. Now, let's analyze today's triggers.
🔄 Yesterday, the breakout of the 84734 range box was activated, and the price made an upward move.
✔️ Currently, the price has reached 86876 and has been rejected from this area but is still above it. If it can stabilize above this area, the next price leg could start.
💥 The RSI oscillator has significant resistance at 78.58, and breaking this area could introduce a lot of momentum into the market, potentially starting a robust upward leg.
⚡️ Additionally, this oscillator has important support at 70, and if it can maintain above this area, the likelihood of breaking 86876 increases.
🔽 For short positions, we need to wait for the price momentum to turn bearish before entering in line with the trend direction.
🧩 If the price does not stabilize above 86876 and moves downward, with confirmation from Dow Theory or the activation of a fake breakout trigger, you can enter a short position.
👑 BTC.D Analysis
Let's move on to the analysis of Bitcoin dominance. Yesterday, dominance was supported at 61.35 and moved up to 61.80, which helped Bitcoin rise more than altcoins.
🧲 Currently, dominance has been rejected from 61.80 and is moving downwards. I believe a range has formed between 61.35 and 61.80, and breaking this box in either direction could determine the next leg of dominance.
📅 Total2 Analysis
Moving on to Total2, yesterday the price broke the 1.05 area and moved upwards, even surpassing 1.07. Currently, I have moved the 1.05 area to 1.06 because it is more accurate, and the price has moved away from it.
⭐ The next resistance for the price is at 1.09, and it seems that Total2 could move up to this area.
📅 USDT.D Analysis
Finally, let's look at the Tether dominance analysis. Yesterday, the 5.25 trigger in dominance was activated, and we observed a clean pullback in dominance that brought it down to 5.13.
✨ The next support for dominance is at 5.08, and we need to see if it can stabilize below this area or not.
❌ Disclaimer ❌
Trading futures is highly risky and dangerous. If you're not an expert, these triggers may not be suitable for you. You should first learn risk and capital management. You can also use the educational content from this channel.
Finally, these triggers reflect my personal opinions on price action, and the market may move completely against this analysis. So, do your own research before opening any position.

Silver's Limited Rebound at $33.06Posting a modest rebound after last week’s dip, silver currently trades around $33.06 per ounce. The recovery is limited as easing geopolitical tensions compete with the pressure from a strong U.S. dollar. Demand stays strong due to tariff uncertainty and inflation risks, but weak industrial outlook, mainly from China, and hopes for a Russia-Ukraine ceasefire are limiting silver’s gains. Still, tightening supply and global economic concerns are helping keep silver near five-month highs.
If silver breaks above $33.75, the next resistance levels are $34.05 and $34.85. On the downside, support is at $33.10, with further levels at $32.50 and $32.15 if selling pressure increases.

Ukraine Talks and Gaza Tensions Influence XAUUSD Gold dipped to around $3,015 per ounce as hopes for a Russia-Ukraine peace deal grew after talks between Ukrainian and U.S. officials. Further negotiations with Russia are expected later today.
Despite the drop, gold remains supported by the tension over U.S. tariffs and Fed rate cut expectations. The Fed kept rates steady last week while signaling two potential cuts this year. Meanwhile, geopolitical pressures remain high as Israel resumed airstrikes on Hamas targets in Gaza.
Key resistance stands at $3082, with further levels at $3100 and $3,150. Support is at $3000, followed by $2,980 and $2,916.

Dollar Pressure Support GBP/USD at 1.2915GBP/USD is trading around 1.2915, supported by a weaker U.S. dollar and steady investor sentiment. The pound benefits from political stability and steady UK economic expectations with the focus on the upcoming April 2 U.S. tariff announcement. The pair is rebounding from recent lows but remains range-bound as traders await new drivers, especially from U.S. trade actions and global growth indicators.
If GBP/USD breaks above 1.3050, the next resistance levels are 1.3100 and 1.3150. On the downside, support stands at 1.2860, with further levels at 1.2800 and 1.2715 if selling pressure increases.

Yields Weigh on EUR/USD: Euro at 1.0820EUR/USD is trading around 1.0820 on Monday, rebounding slightly from last week’s low of 1.0795. The euro has pulled back from its recent high of 1.0955 with uncertainty over Germany’s fiscal policy and rising global trade tensions.
Caution persists before the April 2 announcement of new U.S. tariffs, which could weigh on the eurozone. Despite the modest recovery, the euro remains under pressure from stronger U.S. Treasury yields and demand for the dollar.
Key resistance is at 1.0860, followed by 1.0950 and 1.1000. Support stands at 1.0800, with further levels at 1.0730 and 1.0670.

BTC/USD 1D Chart ReviewHello everyone, let's look at the 1D BTC to USD chart, in this situation we can see how the price is moving in the designated downward channel, in which the price started to grow again. What's more, we can see consolidations on the EMA Cross indicator and here it is worth watching the movement of the red line to see if it will again go up from the green line, which would confirm the return of the uptrend.
Let's start by defining the goals for the near future that the price must face:
T1 = 85808 USD
T2 = 88093 USD
Т3 = 91127 USD
Т4 = 95106 USD
Now let's move on to the stop-loss in case the market continues to fall:
SL1 = 82854 USD
SL2 = 79859 USD
SL3 = 75171 USD
If we look at the MACD indicator, we can see how it indicates an uptrend, but we still have to wait for a return to a strong main uptrend. The RSI shows rebounds near the middle of the range, which we are approaching again, and it is worth paying attention to how the price will behave now.

TradeCityPro | Bitcoin Daily Analysis #42👋 Welcome to TradeCity Pro!
Let's delve into the analysis of Bitcoin and other key crypto indices. As usual, I will review the futures triggers for the New York session for you.
⏳ 1-Hour Timeframe
In the 1-hour timeframe, as you can see, the price still maintains a range box between 83808 and 84734, and the market volume has decreased even more from yesterday.
📊 The less the volume, the closer we are to a price movement, so again, keep an eye on the market to ensure you don't miss any active triggers.
⚡️ For a short position, you can enter with a break of 83808, and for a long position, with a break of 84734.
👑 BTC.D Analysis
Let's move to the analysis of Bitcoin dominance. Yesterday, the support at 61.43 was broken, and it's moving towards 61.08.
✔️ Currently, I don’t have any specific triggers for confirmation in dominance, but as long as the dominance stays below 61.43, I see it continuing its downward trend.
📅 Total2 Analysis
On to the analysis of Total2, the trigger at 1.05 is about to be activated, and the price could move towards 1.07 with a break of this area.
🔽 The short trigger remains at 1.04 for now.
📅 USDT.D Analysis
Finally, looking at the Tether dominance, this index is still ranging between 5.25 and 5.34.
💫 A break of either of these areas could determine the next leg of the price movement.
❌ Disclaimer ❌
Trading futures is highly risky and dangerous. If you're not an expert, these triggers may not be suitable for you. You should first learn risk and capital management. You can also use the educational content from this channel.
Finally, these triggers reflect my personal opinions on price action, and the market may move completely against this analysis. So, do your own research before opening any position.

TradeCityPro | Bitcoin Daily Analysis #41👋 Welcome to TradeCity Pro!
Let's delve into the analysis of Bitcoin and important crypto indices. Today, as usual, I aim to review the New York session futures triggers for you.
⏳ 1-Hour Timeframe
In the 1-hour timeframe, as you can see, Bitcoin is still in a range box between 83808 and 84734, and the market volume is continuously decreasing.
📊 The market volume has reached its lowest possible level, indicating that a move is imminent, so be alert today as the likelihood of our triggers activating is very high.
🔼 For a long position, entering at a break of 84734 could be beneficial, as breaking this area could start a bullish leg up to 86876.
📉 For short positions, a break of 83808 remains suitable. Yesterday, the price briefly breached this area but seemed to rebound, making it still appropriate for positioning.
👑 BTC.D Analysis
Moving on to Bitcoin dominance analysis, as you can see, dominance was rejected from the high of 61.63 yesterday, then set a lower high compared to this area, and now the floor of 61.43 has been broken.
💫 Currently, with the break of 61.43, dominance could move down to 61.08. However, if the break of 61.43 proves to be a fake-out, the likelihood of breaking 61.63 increases.
📅 Total2 Analysis
Let’s talk about Total2; this index doesn't have a very reliable trigger right now, and you can still enter a position with a break of 1.07, but if the price reacts to 1.05, on a second contact, entering on a break of this area might be viable.
🔽 For short positions, a break of 1.04 is suitable, and you can enter a position with the break of this area.
📅 USDT.D Analysis
Lastly, analyzing Tether dominance, it is still ranging and has formed a box between 5.25 and 5.34.
✔️ For a downward trend in dominance, you can confirm with a break of 5.25, and for an upward trend, a break of 5.34 will serve as your confirmation.
❌ Disclaimer ❌
Trading futures is highly risky and dangerous. If you're not an expert, these triggers may not be suitable for you. You should first learn risk and capital management. You can also use the educational content from this channel.
Finally, these triggers reflect my personal opinions on price action, and the market may move completely against this analysis. So, do your own research before opening any position.

TradeCityPro | Bitcoin Daily Analysis #40👋 Welcome to TradeCity Pro!
Let's delve into the analysis of Bitcoin and important crypto indices. Today, as usual, I aim to review the New York session futures triggers for you.
⏳ 1-Hour Timeframe
In the 1-hour timeframe, as you can see, the price has pulled back to below the 84734 area again today.
🔽 The short trigger we have for today is the break of 83808. With the break of this area, the price could move downwards.
✅ The important supports are at 82459 and 80105, which we can use as targets.
📈 For a long position, entering at a break of 84734 could be beneficial, with a target at 86876.
👑 BTC.D Analysis
Moving on to the Bitcoin dominance analysis, a support was established yesterday at 61.43, creating a price box between 61.43 and 61.63.
💫 To confirm an upward trend in dominance, watch for a break of 61.63, and for a downward trend, a break of 61.43 will serve as a confirmation.
📅 Total2 Analysis
Let’s talk about Total2; this index has broken its support at 1.04, and if Bitcoin also loses its support, it could move down to 1.01 again.
🎲 If you don't have positions open, you might consider looking for altcoins that have not yet lost their support, or wait for Bitcoin.
🔼 For long positions, the trigger for Total2 remains at 1.07.
📅 USDT.D Analysis
Lastly, analyzing Tether dominance, it has come back above 5.26, pulled back to this area, and is poised to potentially initiate an upward leg to 5.46.
✔️ The upward dominance trigger for Tether is a break of 5.31. With the break of this area, we can expect dominance to potentially rise again to 5.46.
📉 For downward dominance, a break of 5.26 is a suitable trigger.
❌ Disclaimer ❌
Trading futures is highly risky and dangerous. If you're not an expert, these triggers may not be suitable for you. You should first learn risk and capital management. You can also use the educational content from this channel.
Finally, these triggers reflect my personal opinions on price action, and the market may move completely against this analysis. So, do your own research before opening any position.

Silver Steadies Near $33.20 After PullbackSilver hovered near $33.20 on Friday morning after two consecutive sessions of decline. The recent upward momentum, initially fueled by China’s stimulus measures, has temporarily stalled. Nevertheless, the potential for further gains remains intact amid persistent uncertainty surrounding former President Trump’s tariff policies and escalating geopolitical risks. In addition, the Federal Reserve’s soft approach to interest rates, even if temporary, continues to support interest in non-yielding assets like silver.
If silver breaks above $33.75, the next resistance levels are $34.05 and $34.85. On the downside, support is at $33.10, with further levels at $32.50 and $32.15 if selling pressure increases.

Gold Nears $3,030 on Fed Cut HopesGold hovered near $3,030 on Friday, close to record highs and heading for a third straight weekly gain. The rally is driven by dovish Fed signals and strong safe-haven demand. The Fed reaffirmed plans for two rate cuts in 2025 amid rising economic uncertainty, while Powell downplayed Trump’s proposed tariffs as temporarily inflationary but saw no urgency to cut rates.
Geopolitical tensions also supported gold, with Israel escalating operations in Gaza, Hamas striking Tel Aviv and the U.S. continuing airstrikes in Yemen. Markets are also watching the April 2 deadline for Trump’s reciprocal tariffs, fueling trade concerns. Gold is up over 15% year-to-date.
Key resistance stands at $3082, with further levels at $3100 and $3,150. Support is at $3000, followed by $2,980 and $2,916.

GBP Retreats as BoE Maintains PolicyThe pound dipped below $1.30, retreating from a four-month high after the BoE held rates at 4.5% and signaled a cautious approach to easing policy, despite recent inflation progress.
Global trade tensions added pressure, with new U.S. tariffs prompting retaliatory moves and raising inflation risks.
UK data showed weak growth, steady 4.4% unemployment, and wage growth easing to 5.8%, in line with forecasts. In the U.S., the Fed kept rates steady but reaffirmed plans for two cuts this year.
If GBP/USD breaks above 1.3050, the next resistance levels are 1.3100 and 1.3150. On the downside, support stands at 1.2860, with further levels at 1.2800 and 1.2715 if selling pressure increases.

Lagarde Flags Slower Growth from U.S. TariffsThe euro fell below $1.085, retreating from its March 18 high of $1.0954, after ECB President Christine Lagarde warned of slower growth risks. Speaking to European lawmakers, she said a proposed 25% U.S. tariff on EU goods could cut eurozone growth by 0.3 percentage points in the first year, or 0.5 points if the EU retaliates. Lagarde added that the main impact would be front-loaded, with limited inflation pressures, suggesting the ECB is unlikely to raise rates in response.
Key resistance is at 1.0860, followed by 1.0950 and 1.1000. Support stands at 1.0800, with further levels at 1.0730 and 1.0670.

Yen Slips to 149 as Inflation EasesThe yen fell to around 149 per dollar on Friday, ending a two-day rally, after Japan’s core inflation eased to 3% in February from 3.2% in January, still above expectations of 2.9%. This marked the second month of stronger inflation, reinforcing the case for future rate hikes.
Earlier, the BoJ held rates at 0.5% and maintained a cautious stance, citing global uncertainties, particularly rising U.S. tariffs. The bank also reiterated its focus on monitoring currency moves. A stronger U.S. dollar further pressured the yen amid global growth and trade concerns.
Key resistance is at 150.30, with further levels at 152.00 and 154.90. Support stands at 147.00, followed by 145.80 and 143.00.

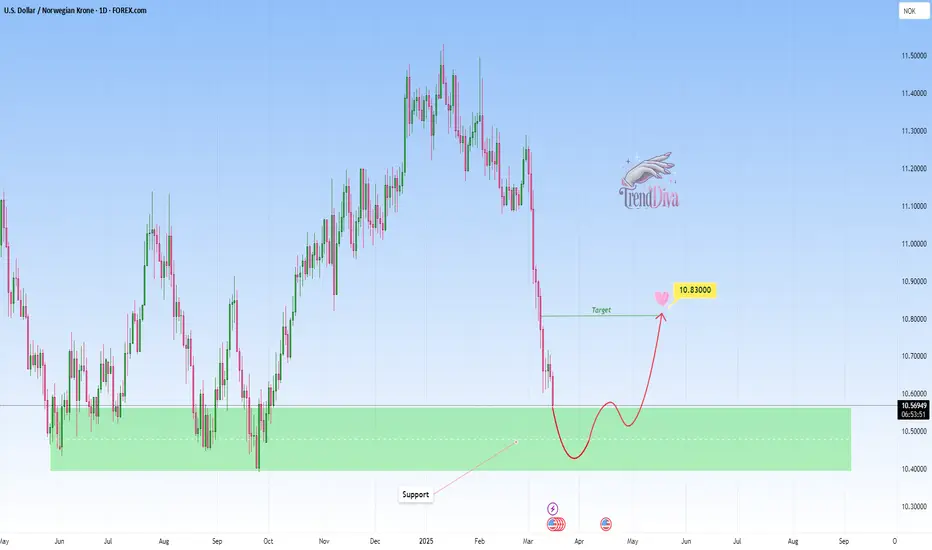
USDNOK - Buy opportunity towards 10,8300?OANDA:USDNOK is testing a clear support area, marked by previous bullish reversals and strong buyer interest. The recent bearish move into this zone suggests a potential buying opportunity if buyers confirm control.
If bullish signals, such as strong rejection wicks or bullish candlestick patterns, emerge, I anticipate an upward move toward 10,8300. If the support fails to hold however, further downside could be expected.
Remember, always confirm your setups and trade with solid risk management.
TradeCityPro | Bitcoin Daily Analysis #39👋 Welcome to TradeCity Pro!
Let's delve into the Bitcoin and key crypto indexes analysis. As usual, I want to review the New York session futures triggers for you.
⏳ 1-hour timeframe
As you can see in the 1-hour timeframe, Bitcoin broke the 84734 resistance yesterday and the price moved upwards. We had some triggers before breaking this area, which I hope you opened positions with and made some profits.
✅ Currently, the price has reached the 86876 area, got rejected, and has returned to 84734. Given the low volume of the red candles, we can consider this movement a correction and a ranging box might form between 84734 and 86876.
⚡️ For today, the best long trigger is breaking 86876, which the price has already hit once. If it can break this area in subsequent contacts, we can enter a position.
🔽 For short positions, the first trigger is the break of 84734, but it’s a risky trigger and I prefer to wait until the price makes a significant trend change before entering a position.
👑 BTC.D Analysis
Moving on to the Bitcoin dominance analysis, yesterday, as Bitcoin's price increased, dominance broke through 61.49 and moved downward, which helped altcoins move higher.
💫 However, as dominance reached 61.08, the market momentum completely changed, and dominance returned above 61.49. Now, after the trend line break, with the break of 61.63, we can confirm a fake breakout.
🧩 For dominance to move downward, the break of 61.49 is still appropriate, and a break of this area can still confirm a downward trend in dominance.
📅 Total2 Analysis
Moving on to the Total2 analysis, yesterday’s trigger at 1.04 was activated, and I moved this area to 1.05 today because the price reacted better to it.
⭐ If you had opened a position with the break of 1.04, you could have made a good profit as the price reached 1.07.
🔑 Currently, the price is ranging between 1.05 and 1.07, and you can open positions if any of these areas break.
📅 USDT.D Analysis
Finally, looking at the Tether dominance, the chart is very similar to Total2 but in reverse.
✨ A break of 5.26 confirms an upward trend, and a break of 5.13 confirms a downward trend in dominance.
❌ Disclaimer ❌
Trading futures is highly risky and dangerous. If you're not an expert, these triggers may not be suitable for you. You should first learn risk and capital management. You can also use the educational content from this channel.
Finally, these triggers reflect my personal opinions on price action, and the market may move completely against this analysis. So, do your own research before opening any position.

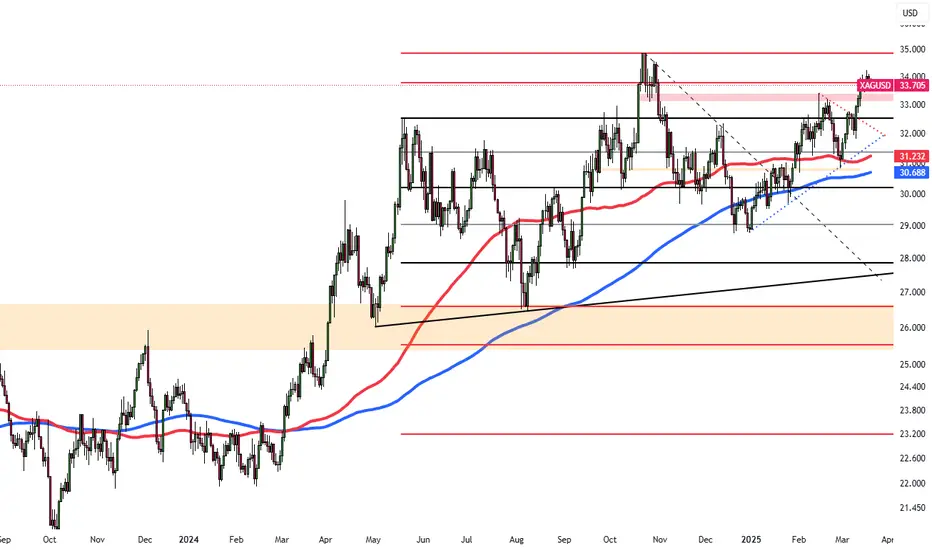
Silver Holds Near $33.60 as Fed Signals 2025 Rate CutsSilver hovered near $33.60 after the Fed held rates at 4.25%-4.5%, signaling 50 bps cuts by 2025. Despite trade-war fears and Trump’s policies, silver remains near a five-month high.
Lease rates surged as stockpiles shrank, especially in London, with silver flowing to the US for higher prices, widening market price gaps. Spot silver is up 17% this year, outperforming other commodities.
Tariffs strain silver transfers from Canada and Mexico, tightening supply and fueling fears of a prolonged “silver squeeze.”
If silver breaks above $34.05, the next resistance levels are $34.85 and $35.00. On the downside, support is at $33.80, with further levels at $33.15 and $32.75 if selling pressure increases.
Gold Holds Near Record $3,050Gold hovered near a record $3,050, supported by Fed rate cut expectations and safe-haven demand. The Fed reaffirmed plans for 50 bps cuts this year amid rising economic uncertainty, driving gold.
Middle East tensions escalated as Israel resumed ground operations in Gaza after an airstrike ended a two-month ceasefire. The US continued strikes on Houthi targets, with Trump warning Iran over future incidents.
Trade concerns persisted ahead of new tariffs in April, following the US’s 25% duty on steel and aluminum in February.
Key resistance stands at $3082, with further levels at $3100 and $3,150. Support is at $3000, followed by $2,980 and $2,916.

Sterling Stays Firm as Fed Highlights GrowthGBP/USD held near 1.3000 as sentiment stayed upbeat after the Fed reaffirmed 2025 rate cuts, though delayed. Markets still expect a 25 bps cut in June, with Powell highlighting strong US growth and a healthy labor market.
The Fed lowered its 2025 GDP forecast to 1.7% from 2.1% and acknowledged trade policy risks but sees inflationary effects as short-lived.
Focus now shifts to the BoE’s Thursday rate decision, with no changes expected. On Friday, the UK’s GfK Consumer Confidence is projected to fall to -21.0 from -20.0.
If GBP/USD breaks above 1.3050, the next resistance levels are 1.3100 and 1.3150. On the downside, support stands at 1.2860, with further levels at 1.2800 and 1.2715 if selling pressure increases.

ECB Rate Cut Hopes Fade, EUR/USD Nears 1.0900EUR/USD fell for a second day, nearing 1.0900 in the Asian session. The pair found support as the dollar weakened on falling Treasury yields after the Fed reaffirmed plans for two rate cuts. However, uncertainty over Trump’s tariff policies kept sentiment cautious.
In Europe, German lawmakers approved a debt plan by likely Chancellor Friedrich Merz to increase growth and defense spending. A shift from Germany’s conservative fiscal stance could drive inflation and influence ECB policy.
Investors await ECB President Lagarde’s speech on economic and monetary affairs in Brussels on Thursday.
Key resistance is at 1.0950, followed by 1.1000 and 1.1050. Support stands at 1.0880, with further levels at 1.0800 and 1.0730.

TradeCityPro | Bitcoin Daily Analysis #38👋 Welcome to TradeCity Pro!
Let's dive into the Bitcoin analysis and key crypto indexes. As usual, I will review the futures triggers for the New York session for you.
✨ Yesterday, our short trigger was activated, and the price moved downward but then moved back up after a few candles.
⏳ 1-hour timeframe
In the 1-hour timeframe, as I mentioned, the trigger at 82066 that I specified for you yesterday was activated, but I personally opened my position at the break of 82459 because there was good downward momentum in the market, and the candle that broke this area was very strong.
🔄 The position I opened went to a risk-to-reward of 2 and became risk-free, and then the market moved upwards, now reaching 83806.
💫 Today, for opening positions, our long trigger is exactly 83906, and if the price breaks this area, we could see the next upward leg. I prefer that the price reacts to this area once and then breaks through it.
✔️ However, be aware that there is another important area at 84573 and a significant range has formed between 83906 and 84573. If you want to open a position confidently, wait until 84573 is also broken so the price can fully exit this range.
⚡️ A break of 62.94 in the RSI can be a good confirmation of momentum. As you can see, the volume is gradually increasing, which is suitable for a long position.
🔽 For short positions, you can still enter with a break of 82459. It's better to wait for the price to react to this area once and look for a break on the second contact.
👑 BTC.D Analysis
Let's move on to the analysis of Bitcoin dominance. As you can see, a descending triangle has formed, and the price has a downward trend line that has caused it to set a lower high every time it reaches 61.49, and now there is a very high chance of breaking this area, which could start a new downward leg in dominance.
👀 On the other hand, if the trend line breaks, dominance could move back up to 62.03. If this happens, money will move out of altcoins and into Bitcoin.
📅 Total2 Analysis
Let's move on to the analysis of Total2. This index still hasn't exited its ranging box and is moving between 1.01 and 1.04.
🔼 You can open a long position with a break of 1.04 and a short position with a break of 1.01.
📅 USDT.D Analysis
Let's look at the USDT.D analysis. Yesterday, the 5.43 area was broken, but like Bitcoin, after a few candles, this area was faked, and the price returned to the box between 5.28 and 5.43.
🔑 For confirming a downward trend in Tether dominance, you can confirm with a break of 5.28. For an upward trend in dominance, you should wait until the price creates a new structure.
❌ Disclaimer ❌
Trading futures is highly risky and dangerous. If you're not an expert, these triggers may not be suitable for you. You should first learn risk and capital management. You can also use the educational content from this channel.
Finally, these triggers reflect my personal opinions on price action, and the market may move completely against this analysis. So, do your own research before opening any position.

TradeCityPro | Bitcoin Daily Analysis #37👋 Welcome to TradeCity Pro!
Today, we're going to analyze Bitcoin and other important crypto indices. In this analysis, as usual, I want to examine the futures triggers for the New York session.
⏳ 1-hour timeframe
In the 1-hour timeframe, as you can see, after breaking 83806, a downward movement occurred, but afterward, it moved upwards again and now has formed a box between 82066 and 83806.
⚡️ Today, we have triggers for both long and short positions because the price has created a good structure for opening positions, and since it's the beginning of the week, volume could enter the market.
✔️ Additionally, we have an ascending trend line that started from the base at 77598 and the price has touched it several times. If this trend line breaks, the price could start a new downward leg.
🔼 For long positions, the first trigger we have is 83806, which could coincide with an RSI of 54.70. However, this trigger is risky and the main trigger for breaking is 84817.
📉 For short positions, a good trigger was created yesterday at 82066. Breaking this area could start the next downward leg to 80105. This trigger is also a trigger for breaking the trend line, and breaking this area could start the next downward leg to 80105. The main trigger is the break of 80105 itself.
👑 BTC.D Analysis
Let's move on to the analysis of Bitcoin dominance, as you see, dominance has rejected from the ceiling of 62.03 again and is moving downward. Currently, dominance has again reached 61.53.
🎲 If 61.53 breaks, we can expect dominance to move downward, and on the other hand, if 62.03 breaks, the price can move upward.
✨ In general, a new range box has been formed again, and breaking the floor or ceiling of this box can determine the next price leg.
📅 Total2 Analysis
Let's move on to the analysis of Total2, this index rose from 1.01 yesterday and is moving towards 1.04 again.
💫 The long trigger for today is the break of 1.04, although we should wait until the price reacts to this area once so that the exact number of resistance is revealed, and we can open a position with its break.
🔽 For short positions, you can enter a very good and suitable short position with the break of 1.01.
📅 USDT.D Analysis
Let's move on to the analysis of Tether dominance, like Total2, its triggers have not been activated yet and nothing new can be said about it.
🔑 A breakout above 5.43 indicates an upward move and a break below 5.28 indicates a downward move
❌ Disclaimer ❌
Trading futures is highly risky and dangerous. If you're not an expert, these triggers may not be suitable for you. You should first learn risk and capital management. You can also use the educational content from this channel.
Finally, these triggers reflect my personal opinions on price action, and the market may move completely against this analysis. So, do your own research before opening any position.
