Gold's Record Week: $2,980 MilestoneGold surged above $2,980 per ounce, hitting a record and heading for a 2% weekly gain as risk aversion and Fed rate cut expectations grew. Trump escalated trade tensions, threatening a 200% tariff on European wines after the EU's 50% tax on U.S. whiskey.
February's PPI and CPI data showed easing inflation, increasing Fed flexibility for rate cuts, and raising gold's appeal. Strong ETF inflows and continued central bank purchases, with China extending its buying for a fourth month, further supported prices.
Key resistance stands at 3000, with further levels at 3045 and 3100. Support is at 2980, followed by 2916 and 2885.
Dailyanalysis

Euro Climbs on German Deal, Awaits Fitch RatingThe euro climbed toward $1.09, nearing its highest since early November, as Germany agreed on debt reform and increased spending. Chancellor-elect Friedrich Merz secured a deal with the Green and Social Democrat parties ahead of next week’s parliamentary vote.
Markets await Fitch’s rating decision on France, which is due after Friday’s close. Meanwhile, trade tensions rose as Trump threatened a 200% tariff on European wines in response to the EU’s tax on American whiskey. On geopolitics, Trump called his talks with Putin on Ukraine “very good,” expressing optimism for a resolution.
Key resistance is at 1.0950, followed by 1.1000 and 1.1050. Support stands at 1.0800, with further levels at 1.0730 and 1.0650.
Yen Gains on Rate Hike ExpectationsThe Japanese yen traded around 148.6 per dollar on Monday, near a five-month high, as expectations for BOJ rate hikes remained strong. However, the central bank is expected to keep its policy unchanged in this week’s meeting.
Major Japanese firms approved wage hikes for the third year, boosting consumer spending and inflation, and potentially allowing future rate increases. The yen also gained from dollar weakness as US economic concerns and trade policies pushed investors toward safe-haven currencies like the yen and Swiss franc.
Key resistance is at 149.20, with further levels at 152.00 and 154.90. Support stands at 147.00, followed by 145.80 and 143.00.

TradeCityPro | Bitcoin Daily Analysis #36👋 Welcome to TradeCity Pro!
Let's dive into the Bitcoin analysis and key crypto indices. In this analysis, as usual, I want to review the futures triggers for the New York session.
⏳ 1-hour timeframe
In the 1-hour timeframe, as you can see, after breaking 83806, a downward movement occurred but then it moved upwards again, now forming a box between 82066 and 83806.
✔️ Today we have triggers for both long and short positions because the price has formed a good structure for opening positions, and since it's the beginning of the week, volume can enter the market.
🎲 We also have an ascending trendline that originated from the bottom at 77598, which the price has hit several times. If this trendline breaks, the price can start a new downward leg.
🔼 For long positions, our first trigger is 83806, which may coincide with an RSI of 54.70. However, this trigger is risky and the primary trigger for a breakout is 84817.
📉 For short positions, a good trigger was formed yesterday at 82066. Breaking this area could initiate the next downward leg to 80105. This trigger is also a trendline break trigger, and breaking this area could start the next downward leg to 80105. The primary trigger for this is also the break of 80105.
👑 BTC.D Analysis
Let's move on to the Bitcoin dominance analysis. As you can see, dominance was rejected from the ceiling of 62.03 and moved downward. Currently, dominance has again reached 61.53.
💥 If 61.53 breaks, dominance can move downwards and conversely, if 62.03 breaks, the price can move upwards.
📊 Overall, a range box has been formed again, and breaking the floor or ceiling of this box can determine the next price leg.
📅 Total2 Analysis
Moving on to the Total2 analysis, this index rose from 1.01 yesterday and is now moving towards 1.04.
💫 Today's long trigger is the break of 1.04, but we need to wait until the price reacts to this area once to get the exact resistance number and open a position with its breakout.
🔽 For short positions, you can enter a very good and suitable short position with a break of 1.01.
📅 USDT.D Analysis
The dominance of Tether has formed a large range box between 5.28 and 5.56, and currently, the price is near the bottom of the box. There is also a resistance line at 5.43 within the box.
⚡️ Today, for confirming a downward trend in dominance, you can use the break of 5.28, and for an upward trend, you can confirm with the break of 5.43.
❌ Disclaimer ❌
Trading futures is highly risky and dangerous. If you're not an expert, these triggers may not be suitable for you. You should first learn risk and capital management. You can also use the educational content from this channel.
Finally, these triggers reflect my personal opinions on price action, and the market may move completely against this analysis. So, do your own research before opening any position.

EURGBP nearing resistance – Drop toward 0.8370 next?OANDA:EURGBP is getting close to a key resistance level that has previously acted as a strong barrier, triggering bearish momentum in the past -
This zone is once again a potential point of interest for those looking for short opportunities. Given this, how price reacts here could set the tone for the next move.
If signs of rejection appear: such as long upper wicks, bearish candlestick formations, or a slowdown in bullish momentum, a move toward the 0.83700 is highly possible . However, a decisive breakout above this resistance may invalidate the bearish bias and lead to further upside. Price action at this level will be critical in determining the next move.
Just my perspective on key levels, always confirm setups and maintain solid risk management.

TradeCityPro | Bitcoin Daily Analysis #35👋 Welcome to TradeCityPro!
Today, we're diving into the analysis of Bitcoin and major crypto indices. As usual, I will review the New York session's future triggers for you.
⏳ 1-Hour Timeframe
In the 1-hour timeframe, as you can see, the trigger I set yesterday at 83979 was activated, and with the area's breach, it seems like the next bearish leg might commence.
💫 I've moved yesterday's trigger down to 83806, and we'll see if it reacts to this in the future.
💥 Currently, the RSI is entering the oversold territory, and with the entry of bearish momentum, the price could move down to 80105. The main price support remains at 77598.
📊 Today, I don't have any specific triggers yet and we need to wait for the price to establish a new structure. For short positions, you can utilize the triggers available in the lower timeframes.
📈 For long positions, like shorts, you must wait for the price to form a new structure. However, if the price sharply moves upwards, the long trigger will be at 84817.
👑 BTC.D Analysis
Moving to the Bitcoin dominance analysis, BTC.D has formed a range between 61.53 and 62.03 and is currently moving towards the upper boundary of this box.
⭐ If this upward movement occurs, altcoins will likely fall more than Bitcoin, and if the altcoin short trigger activates, you can enter a position.
✔️ A major confirmation of upward movement will be with a break of 62.03, and a downward trend confirmation will be with a break below 61.53.
📅 Total2 Analysis
Moving on to Total2, yesterday's trigger at 1.04 was activated but it turned out to be a fake break, and the price has since returned below this area, now touching 1.01.
⚡️ For short positions, look for a break below 1.01, and for long positions, you can still take confirmation from 1.04.
📅 USDT.D Analysis
Finally, looking at the Tether dominance, similar to Bitcoin, its trigger has been activated, breaking the area of 5.33, and the price is trending upwards.
🎲 A confirmation of an upward movement will be with a break above 5.56, and a confirmation of a downward trend will be with a break below 5.28.
❌ Disclaimer ❌
Trading futures is highly risky and dangerous. If you're not an expert, these triggers may not be suitable for you. You should first learn risk and capital management. You can also use the educational content from this channel.
Finally, these triggers reflect my personal opinions on price action, and the market may move completely against this analysis. So, do your own research before opening any position.

TradeCityPro | Bitcoin Daily Analysis #34👋 Welcome to TradeCityPro!
Let's dive into the analysis of Bitcoin and other important crypto indices. As usual, I want to review the New York session's futures triggers for you.
⚡️ Yesterday, one of our triggers was activated, which I will mention in this analysis.
⏳ 1-Hour Timeframe
As you can see in the 1-hour timeframe, yesterday's trigger at 83979 was activated, and the candle closed above this level. However, it seems like the upward momentum ended there, and the price gradually started to move downward.
💫 The decline was due to the falling dominance of Bitcoin, which failed to continue its upward movement as dominance dropped.
✨ Currently, the price has returned below the 83979 level, which appears to be a fake-out. If the price stabilizes below this level, there is an increased likelihood that it will retest the 80105 support. The primary support is still at 77598.
🔽 For a short position, with the activation of the fake-out trigger of 83979 in lower timeframes, you can enter a position. Other triggers like breaking 80105 may not occur today since it's Saturday and the market doesn't have enough volume to make significant moves.
📈 For long positions, keep in mind that there is a resistance area from 83979 to 84817. The price must break out of this range, so until a new structure is formed to give a precise resistance figure, the long trigger will be 84817.
👑 BTC.D Analysis
Let's move on to the analysis of Bitcoin dominance. As observed, dominance corrected to the 62 area yesterday and is now moving downward again.
🎲 Currently, the 61.53 zone is critical, and breaking this could lead Bitcoin's price towards 61.08.
✔️ I currently see the momentum of dominance as bearish, so if the market is giving long positions, I prefer to open them on altcoins.
📅 Total2 Analysis
Moving on to the Total2 analysis, yesterday's trigger at 1.01 was activated simultaneously with the break of 83979 in Bitcoin. Given the drop in Bitcoin dominance, altcoins moved higher and offered better positions.
📊 For today, the long trigger for Total2 is at the 1.04 area. As for short positions, since I see the Bitcoin dominance as declining, I prefer to open shorts on Bitcoin. However, you can also open short positions on altcoins with the Bitcoin trigger.
📅 USDT.D Analysis
Let's look at the USDT.D analysis. Yesterday's upward move in dominance was a fake-out, and it returned below 5.49 with a bearish momentum that broke the floor at 5.33 and stopped at 5.28.
⭐ Currently, a very small range box has formed from 5.28 to 5.33, and breaking any of these areas could define the next leg of dominance and its short-term trend.
❌ Disclaimer ❌
Trading futures is highly risky and dangerous. If you're not an expert, these triggers may not be suitable for you. You should first learn risk and capital management. You can also use the educational content from this channel.
Finally, these triggers reflect my personal opinions on price action, and the market may move completely against this analysis. So, do your own research before opening any position.

Gold Rallies Past $2,980 as Trade and Inflation Risks MountGold surged above $2,980 per ounce on Friday, hitting a record high and poised for a 2% weekly gain amid risk aversion and rising Fed rate cut expectations. Trump escalated trade tensions, threatening a 200% tariff on European wines after the EU imposed a 50% tax on U.S. whiskey. February's PPI and CPI data signaled easing inflation, increasing Fed flexibility for rate cuts and boosting gold’s appeal. Strong ETF inflows and continued central bank purchases, with China extending its buying for a fourth month, further supported prices.
Key resistance stands at $2,985, with further levels at $3000 and $3,050. Support is at $2,930, followed by $2,900 and $2,860.

Sterling Struggles Amid Risk Aversion and US Tariff ThreatsGBP/USD extends its decline for the second consecutive session, hovering around 1.2940 during Friday's Asian trading hours. The currency pair faces difficulties as the Pound Sterling (GBP) weakens due to a negative risk sentiment, which has been further worsened by worries over global trade following US President Donald Trump's threat to impose a 200% tariff on European wines and champagne, creating market instability.
If GBP/USD breaks above 1.2980, the next resistance levels are 1.3050 and 1.3100. On the downside, support stands at 1.2860, with further levels at 1.2760 and 1.2660 if selling pressure increases.

Yen Slips Against USD as Tariff Concerns Increase the DollarThe yen fell below 148 per dollar on Friday, reversing gains as trade tensions increased the dollar. Trump reaffirmed plans for reciprocal tariffs starting April 2. Despite this drop, the yen remains near a five-month high, backed by expectations of BOJ rate hikes. Japanese firms agreed to wage increases for a third year, aiming to offset inflation and labor shortages. Higher wages may spur spending and inflation, giving the BOJ room for future hikes. While rates are expected to remain unchanged next week, policymakers may pursue hikes later this year.
Key resistance is at 149.20, with further levels at 152.00 and 154.90. Support stands at 147.00, followed by 145.80 and 143.00.

TradeCityPro | Bitcoin Daily Analysis #33👋 Welcome to TradeCityPro!
Let's dive into the Bitcoin analysis and other key crypto indices. Today, I'm bringing you the analysis earlier than usual and will be looking at the triggers for both the London and New York sessions.
⚡️ Yesterday, one of our triggers was activated but unfortunately hit the stop loss. However, we have another trigger today, so let's go ahead and analyze it.
⏳ 1-Hour Timeframe
In the 1-hour timeframe, as you can see, yesterday's trigger at 81466 was activated and you could have opened a position with it. I personally opened a position on Ethereum, and my position is near the stop loss. Bitcoin was supported at the 80105 area and has moved back above 81466.
📊 The market volume has significantly decreased in bullish candles, indicating that this upward movement might just be a deep correction because if the 81466 area was going to break definitively, we would have seen significant buying momentum and volume enter the market, but that didn't happen and this upward movement is accompanied by severe trend weakness.
🔽 Currently, for a short position, with the break of 80105, you can open a position. This area is one where the price reacted yesterday after significant bearish momentum, so it's a suitable demand zone and breaking this area could see the price move towards the target of 77598.
📈 For long positions, the main trigger remains 83979, and breaking this area could bring significant momentum and volume into the market. Potential targets for a long position are 86440 and 91558.
👑 BTC.D Analysis
Let's move on to the analysis of Bitcoin dominance. Yesterday, dominance continued to decline, dropping to 61.53 but is currently forming green candles and moving upwards slightly.
💥 There hasn't been much structure created yet, and we can't give a trigger for the dominance to turn bullish yet, but breaking the 61.53 area could initiate the next bearish leg.
📅 Total2 Analysis
Moving on to the analysis of Total2, yesterday's Total2 trigger was not activated and the same triggers we have for altcoins are still suitable.
The reason for this is that Bitcoin's dominance was bearish, which led to Bitcoin dropping more than altcoins, and the short trigger for it was activated, but Total2 remains above this area.
✔️ For a short position, you can enter if the break below 984 occurs, and for long positions, breaking 1.01 would be suitable.
📅 USDT.D Analysis
Finally, let's look at the analysis of Tether dominance. As you can see, yesterday its trigger was activated, and a fake break occurred.
🎲 However, as you can see, after the 5.49 area was faked, the price was rejected with a green candle, and it reacted to this area, so I still keep the USDT.D resistance area at 5.49 and will wait to see how dominance reacts to different areas.
🧲 The bearish confirmation of Tether dominance is clear, and with a break of 5.33, we can confirm it. For the dominance to turn bullish, the area is still 5.49, but wait until the price shows a reaction to this area to fine-tune your main trigger.
❌ Disclaimer ❌
Trading futures is highly risky and dangerous. If you're not an expert, these triggers may not be suitable for you. You should first learn risk and capital management. You can also use the educational content from this channel.
Finally, these triggers reflect my personal opinions on price action, and the market may move completely against this analysis. So, do your own research before opening any position.

TradeCityPro | Bitcoin Daily Analysis #32👋 Welcome to TradeCityPro!
Let's dive into the analysis of Bitcoin and major crypto indices. As usual, I want to review the futures triggers for the New York session for you.
🧩 Yesterday, the short trigger I had set for you was activated, but the price couldn't stabilize above this trigger and was rejected from the 83979 area.
⏳ 1-Hour Timeframe
In the 1-hour timeframe, as you can see, the price has been rejected from the 83979 area and has formed a small box between 81466 and 83979. Currently, the price is being rejected from the box's ceiling again.
💥 The previous candle that the price formed is very interesting and attractive and can introduce a lot of downward momentum into the market. In this case, the price could move down to the support at 81466, and breaking this support would be a good trigger for a short position.
✔️ If the 81466 area is broken, the price will set a ceiling consistent with the previous ceiling, and in this case, we can prepare for the next downward leg. The first floor that the price has and can be used as a target is 77598.
💫 The RSI oscillator is also in an important area, and if it stabilizes below 44.69, downward momentum can enter the market, and the probability of breaking 81466 will increase. The market volume has been ranging so far, but the volume of the last candle that the price formed is very in favor of the sellers, and this matter, in the case of breaking the RSI trigger, the likelihood of breaking 81466 and a market crash will increase significantly.
🔼 For a long position, the best trigger would be 83979. The price has reacted several times to this area, and as long as Bitcoin is below this area, we can say its trend is still downward.
👑 BTC.D AnalysisLet's go to the analysis of Bitcoin dominance. Finally, the dominance was rejected from the ceiling of 62.25 and today, as you can see during the London session, it is decreasing and has dropped to 61.67.
🎲 Currently, the main confirmation of the dominance downturn is taken from 61.08, and the risky trigger for the downturn is 61.67. If these areas are broken, the dominance will move towards lower targets, and more money will enter altcoins.
☘️ For dominance to rise, the situation is quite clear. If it is supported from 61.67, dominance can move upwards, and the main confirmation of the uptrend will be with the break of 62.25.
📅 Total2 Analysis
Let's go to the analysis of Total2, we have a very important resistance in Total2 at the area of 1.01, and the price has shown a lot of reaction to it and now is being rejected from it with two strong bearish candles.
⭐️ If 1.01 is broken, you can enter a long position, but in my opinion, with this rejection that Total2 is receiving from this area, the likelihood of it turning bearish and activating the trigger at 984 increases.
📅 USDT.D Analysis
Let's look at the analysis of USDT.D, like Bitcoin, this index is also in a ranging box between 5.33 and 5.49, and breaking either of these areas could be a good trigger for the next leg of USDT.D.
🧲 If 5.33 is broken, the trend-breaking trigger will be activated, and dominance could become bearish, which in this case, Bitcoin and Total2 will move upwards. If 5.49 is broken, dominance will rise, and more money will enter Tether.
❌ Disclaimer ❌
Trading futures is highly risky and dangerous. If you're not an expert, these triggers may not be suitable for you. You should first learn risk and capital management. You can also use the educational content from this channel.
Finally, these triggers reflect my personal opinions on price action, and the market may move completely against this analysis. So, do your own research before opening any position.

Lower US Inflation Drives Gold's SurgeGold surged to around $2,940 per ounce on Thursday, nearing record highs as escalating trade tensions boosted safe-haven demand. Trump threatened more tariffs on EU goods after retaliatory measures from the EU and Canada, while Commerce Secretary Lutnick confirmed planned trade protections on copper.
Meanwhile, US inflation data came in lower than expected, easing concerns and giving the Fed more room for a less restrictive policy. However, the long-term impact of tariffs remains uncertain, with inflation risks still looming.
Key resistance stands at $2,955, with further levels at $2,980 and $3,000. Support is at $2,860, followed by $2,830 and $2,790.

GBP/USD Climbs to 1.2960, Dollar Under PressureGBP/USD trades around 1.2960 in Thursday’s Asian session, extending gains for a third day as the US Dollar weakens with recession fears linked to Trump’s policies.
The dollar faces further pressure after February inflation slowed more than expected, raising speculation of an earlier Fed rate cut. Headline inflation fell from 0.5% to 0.2% monthly and from 3.0% to 2.8% yearly, while core inflation dropped to 0.2% monthly and 3.1% yearly. Markets now await US PPI and jobless claims data for further economic signals.
If GBP/USD breaks above 1.2980, the next resistance levels are 1.3050 and 1.3100. On the downside, support stands at 1.2860, with further levels at 1.2760 and 1.2660 if selling pressure increases.

Yen Supported by BOJ TighteningThe Japanese yen stabilized around 148 per dollar on Wednesday, recovering after two days of declines as a weaker US dollar offset trade conflict concerns. Trump vowed more tariffs after the EU and Canada retaliated against his steel and aluminum duties, escalating tensions.
The yen remained supported by expectations of further BOJ rate hikes, driven by strong wage growth and inflation. Japanese companies approved significant wage increases for the third year, boosting consumer spending and giving the BOJ more flexibility for future hikes.
Key resistance is at 149.20, with further levels at 152.00 and 154.90. Support stands at 147.00, followed by 145.80 and 143.00.

Fed Expectations Increase Silver PricesSilver surged to nearly $33 as the US Dollar fell sharply, with the DXY dropping to 103.35, its lowest in four months. Concerns over Trump’s tariff policies and their impact on the US economy fueled the dollar’s decline, supporting demand for silver.
Investors now await US CPI data for February, which could influence Fed rate expectations. A slower inflation rate may increase the likelihood of a May rate cut, with odds rising to 51% from 37% in a day, further supporting Silver’s appeal as a non-yielding asset.
If silver breaks above $32.75, the next resistance levels are $33.15 and $33.80. On the downside, support is at $31.00, with further levels at $30.20 and $29.75 if selling pressure increases.

Recession Fears Support Gold's StabilityGold held steady above $2,910 per ounce, maintaining a 1% gain. Investor sentiment shifted after Trump reversed his plan to double tariffs on Canadian steel and aluminum, just hours after the announcement. Ontario Premier Doug Ford also paused a 25% surcharge on US electricity exports.
Trade uncertainties and US recession fears continued to support gold, though geopolitical tensions eased as the US restored military aid to Ukraine following a 30-day ceasefire agreement with Russia. Markets now focus on upcoming US CPI data for clues on the Fed’s rate outlook.
Key resistance stands at $2,923, with further levels at $2,955 and $3,000. Support is at $2,860, followed by $2,830 and $2,790.

Dollar Weakness Supports GBP Near HighsThe British pound held around $1.29, near a four-month high, as dollar weakness persisted on US economic concerns and tariff risks. Sterling was supported by expectations that UK rates will stay higher for longer, with traders pricing in only 52bps of BoE cuts in 2025.
UK’s monthly GDP data for January and the Office for Budget Responsibility’s economic and borrowing forecasts on March 26 are now awaited, which could impact market sentiment.
If GBP/USD breaks above 1.2950, the next resistance levels are 1.2980 and 1.3050. On the downside, support stands at 1.2860, with further levels at 1.2760 and 1.2660 if selling pressure increases.

Eurozone Spending Plans Boost EuroThe euro surged past $1.09, its highest in four months, gaining 5% since early March. This rally was driven by Eurozone plans to expand deficit spending, stimulating growth prospects. Germany pushed for a €500 billion infrastructure fund, while France and Italy supported joint EU funding for economic and military initiatives.
The ECB signaled a shift toward a less restrictive policy after last week’s rate cut, suggesting the easing cycle may be nearing its end. Meanwhile, US economic concerns pressured the dollar, further lifting the euro.
Key resistance is at 1.0950, followed by 1.1000 and 1.1050. Support stands at 1.0800, with further levels at 1.0730 and 1.0650.

Yen's Rise and the Risk of Currency VolatilityThe Japanese yen strengthened to 147 per dollar on Tuesday, its highest in five months, as US recession fears drove investors to long-term trusted assets. Trump's reluctance to dismiss recession risks, along with trade policy uncertainty, added to yen demand.
Japan's economic outlook weakened as Q4 GDP growth was revised down to 2.2% from 2.8%, reflecting weak private consumption. Despite this, the BOJ is expected to keep rates steady in March, with potential hikes later. Finance Minister Shunichi Kato cautioned against excessive currency volatility amid the yen’s rapid gains.
Key resistance is at 149.20, with further levels at 152.00 and 154.90. Support stands at 147.00, followed by 145.80 and 143.00.

TradeCityPro | Bitcoin Daily Analysis #30👋 Welcome to TradeCityPro!
Let's dive into the analysis of Bitcoin and key crypto indices. As usual, today I will review the futures triggers for the New York session.
✨ Yesterday, our short trigger was activated, and we were able to open a good position. We also have a trigger today, so let's go through the analysis to check these triggers.
⏳ 1-Hour Timeframe
As I mentioned yesterday, if the break of the 83151 area was fake, you could have entered a position at the trigger of 821288, which indeed happened. This trigger was activated, and the price moved down to the area of 77598. Currently, the price has moved up again and has made a correction up to the 821288 area again.
💥 This trigger was for one-time use, and we opened a position with it yesterday, so I have removed it from the chart since we no longer need to use it and the price has not reacted to it anymore.
✅ Currently, I am waiting to see what new structure the price will form, from which area it will reject, and what structure it will create. For now, to consider a long position, we must first wait for this new structure to form. If this structure does not emerge, you can enter a long position if 83151 breaks again.
🔽 For short positions, the situation is quite clear: if the floor of 727598 breaks, you can enter a short position targeting 72753. An important note about the recent upward movement is that market volume is decreasing, indicating a weakness in the trend, and it seems that the power still lies with the sellers.
💫 The RSI has risen above the area of 50. If it goes back below 50, you can take that as a confirmation of momentum for a short position.
👑 BTC.D Analysis
Let's move on to the analysis of Bitcoin dominance. Finally, dominance has exited the small range box that was formed between the areas of 61.07 and 61.61, and it broke this box upwards as the market fell.
🎲 This situation caused the altcoins and indices like Total2 to fall more than Bitcoin itself. As you can see, dominance has approached the very important resistance area of 62.19. If dominance can stabilize above this area, the next resistance for dominance will be 62.66.
🧩 The trigger for Bitcoin dominance turning bearish is still the area of 61.61 for now.
📅 Total2 Analysis
As you can see, our trigger in the area of 1.01 was activated yesterday, and Total fell to $953 billion, finally falling below $1 trillion after a long time.
☘️ Currently, after the breakdown and the price reaching a lower support, we witnessed a reaction from the buyers that caused the price to rise slightly. Now it seems that the price is setting a lower high compared to its previous high. If this event occurs, with the break of the area of 953, we can open a short position.
⭐️ However, for long positions, I am currently waiting for the chart to form a new structure. If there is a sudden upward movement without significant structure formation, the only trigger for a long position remains the break of 1.01.
📅 USDT.D Analysis
Let's move on to the analysis of Tether dominance. As you can see, Tether dominance also experienced a breakout yesterday, breaking the area of 5.49 and moving upwards. The resistance that was above dominance was at 5.86, which dominance did not reach but came close before moving downwards again.
🧲 Currently, it seems that dominance has re-entered below the area of 5.49. If it can consolidate below this and break its ascending trendline, we can say that the increase in Tether dominance will finally halt. In this case, dominance could move lower, and the market might undergo a slight bullish correction.
❌ Disclaimer ❌
Trading futures is highly risky and dangerous. If you're not an expert, these triggers may not be suitable for you. You should first learn risk and capital management. You can also use the educational content from this channel.
Finally, these triggers reflect my personal opinions on price action, and the market may move completely against this analysis. So, do your own research before opening any position.

Brent Crude Struggles at $69 as Global Demand Risks MountBrent crude hovered around $69 per barrel on Tuesday as concerns grew that U.S. tariffs could slow economic growth and weaken oil demand. Tariffs imposed by President Trump on major suppliers like Canada and Mexico, along with China’s retaliatory measures, heightened fears of a global slowdown.
China’s deepening deflationary pressures further weighed on crude prices despite stimulus efforts. On the supply side, Russia’s Deputy PM Alexander Novak confirmed OPEC+ plans to boost production in April but noted the decision could be reassessed if market conditions shift.
Technically, the first support is at $68.1, with subsequent levels at $65 and $63.6. On the upside, the initial resistance is at $70.2, followed by $73.3 and $75.80.

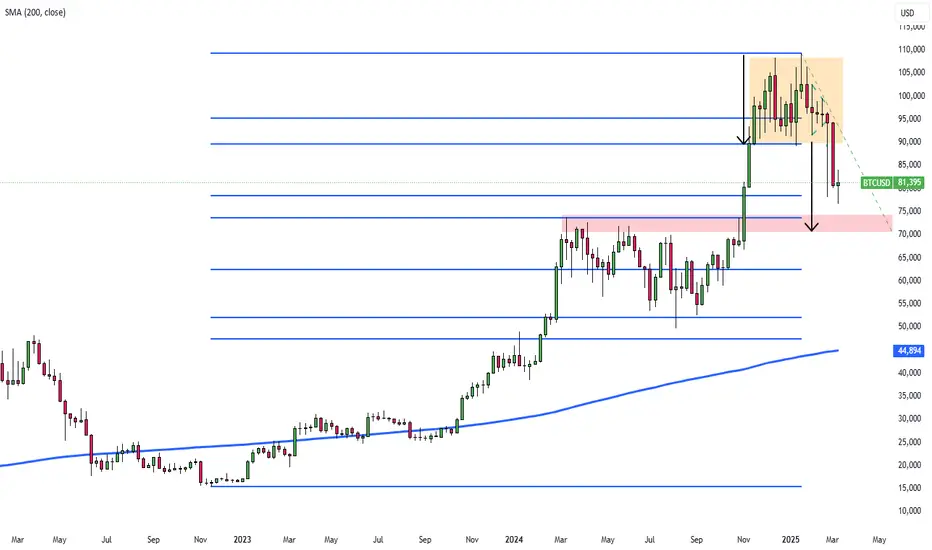
Bitcoin Drops 27% from Record High Amid Market SelloffBitcoin fell to $78,000 on Monday, down 27% from its all-time high, as crypto and stock markets lost a combined $6 trillion. Crypto market capitalization dropped 4% to $2.67 trillion, its lowest since November 9, shedding $1.2 trillion since December 17. Bitcoin hit a multi-month low, falling from its January peak of $107,000. Stocks mirrored the decline, with the S&P 500 losing $1.4 trillion—its worst single-day drop since 2022. The sharp selloff reflects a shift from risk assets, with the Fear and Greed Index plunging to 14, a two-year low, signaling extreme risk aversion. This contrasts with last year’s post-Trump election rally, where the index peaked at 92.
Technically, the first support for BTC is at $78k, with subsequent levels at FWB:73K and $65k. On the upside, the initial resistance is at GETTEX:89K , followed by $95k and $100k.