Why Ethereum Could 10x in the Next Few Years🚀
1. Ethereum ETF Approval
ETFs are approved in the U.S. (similar to the Bitcoin ETFs in early 2024), institutional money will flood in.
Grayscale, BlackRock, and others have already filed.
Ethereum’s price jumped significantly after similar events in the past.
2. Deflationary Supply (Post-EIP-1559)
Since EIP-1559, ETH has been burned with every transaction.
Combined with Proof-of-Stake (The Merge), ETH is now net deflationary during periods of high network activity.
3. Layer 2 Ecosystem Is Exploding
Rollups (Arbitrum, Optimism, Base, zkSync) are scaling Ethereum.
These L2s settle on Ethereum L1, driving fees and activity.
Vitalik’s "rollup-centric roadmap" is playing out — this benefits ETH long-term.
4. Real Yield from Staking
Ethereum now offers a real, sustainable yield from staking (~3–5%).
Institutions love yield. ETH becomes more like a productive asset, not just a speculative token.
5. Ethereum as the Base Layer of Web3
DeFi, NFTs, gaming, DAOs — Ethereum is still the dominant smart contract platform.
The most secure, battle-tested, and widely adopted chain.
Developers and enterprises continue to build on Ethereum over competitors.
6. Macro Tailwinds
As the U.S. moves toward looser monetary policy, risk assets (including crypto) historically benefit.
Crypto adoption is growing globally — from Latin America to Asia — and Ethereum is often the entry point.
DEFI

Solana Daily Outlook | Key Levels & Market Momentum👀 Welcome to my Trading View Analysis and Trading Channel Here , we share the latest market analysis, trading signals, and key insights together .
Ready for smarter trades ? ⭐️
⚡️Today , we're going to analyze the SOL( Solana ) coin together on the daily timeframe and find triggers for our positions .
💠 🔍Daily Technical Overview
Solana (SOL) recently broke out of its descending trendline on the daily chart, leading to an impressive 30% price surge. This breakout marked a key shift in market sentiment and highlighted a fresh wave of buyer interest.
Currently, SOL is moving through a distribution phase, where price consolidates and profit-taking occurs. All eyes are on the $152.55 resistance level – a breakout above this zone, backed by solid volume, would present a strong long entry opportunity.
📊 🧠 Fundamental Insights
Solana isn’t just showing strength technically – the fundamentals are also aligning for a bullish outlook:
✅ After a 65% correction, buyers are returning to accumulate at discounted levels.
✅ Ecosystem growth continues, with strong developer activity and use case expansion.
✅ Trading volume is on the rise, supporting the price recovery.
📰 🔥 This Week’s Positive Solana News
Here are the major developments from the past week that are giving Solana a strong boost:
📈 Price Forecast: Analysts now project that SOL could reach $155–$160 by the end of May, with potential upside toward $180 in the near term.
🏦 Institutional Investment: Upexi Inc. has announced plans to allocate $100 million toward purchasing Solana tokens — a major show of confidence.
📊 ETF Filing: Franklin Templeton has filed for a Solana-based ETF to track SOL’s price, which could open the door for more mainstream investment.
🇺🇸 US Government Involvement: Reports suggest the U.S. government is considering Solana as part of its strategic digital asset reserve, highlighting its growing legitimacy.
📝 Conclusion
🚀 Trendline breakout = bullish confirmation
📌 Consolidation = distribution zone
📊 Break above $152.55 = long setup
📉 Previous 65% correction = attractive accumulation zone
📰 Positive news flow = fundamental support for continued growth
I love you all so much . 👀
don't forget about capital management and risk management .
Be careful with your positions . 🥇

Chainlink Trend update on 06/May/2025Chainlink market update on 06/May/2025. Currently, it break 13.8$ and keep our eye to see whether it touch 12.8$ zone and reverse or not.
#Chainlink #Defi

TradeCityPro | LDO: Watching for Breakout in DeFi Leader’s Range👋 Welcome to TradeCity Pro!
In this analysis, I’m going to review the LDO coin — one of the well-known DeFi projects within the Ethereum ecosystem with a significantly high TVL.
✔️ This project’s token currently has a market cap of $748 million, placing it at rank 86 on CoinMarketCap.
⏳ 4-Hour Timeframe
As you can see on the 4-hour chart, after a downtrend, LDO formed a bottom around the 0.676 zone and managed to rally up to 0.868.
🔍 Currently, the price is consolidating below that resistance in a ranging box. A breakout from either direction of the box could determine the next trend.
⭐ If the box breaks upward and the 0.868 level is breached, we can consider the prior downtrend over, and the price would be forming a new bullish structure. However, there is another resistance at 0.904 right above, and there’s a possibility of rejection from that level after the 0.868 breakout.
📈 For a long position, I personally plan to enter upon the breakout of 0.868. While it’s possible that the price might reverse from 0.904, I prefer having an earlier entry and using a more accessible trigger.
🔽 On the other hand, if the box breaks to the downside, the price might revisit the 0.676 support and potentially start a new bearish leg in line with the longer-term downtrend.
📉 The first short trigger is the break of 0.818 (the lower boundary of the box), but there’s another minor support at 0.795, which may cause a bounce.
👀 I personally prefer to wait for the 0.795 level to break for a short entry, given that market momentum is currently bullish, and I prefer a more reliable trigger for shorts.
📊 Volume within this range has been decreasing, which is normal in such consolidation phases. The longer the price stays in this range, the lower the volume tends to be — and typically, a breakout will lead to a sharper move.
The RSI oscillator also has a support zone at 43.17. If this level is broken, it could signal incoming bearish momentum and increase the probability of a downside breakout.
📝 Final Thoughts
This analysis reflects our opinions and is not financial advice.
Share your thoughts in the comments, and don’t forget to share this analysis with your friends! ❤️

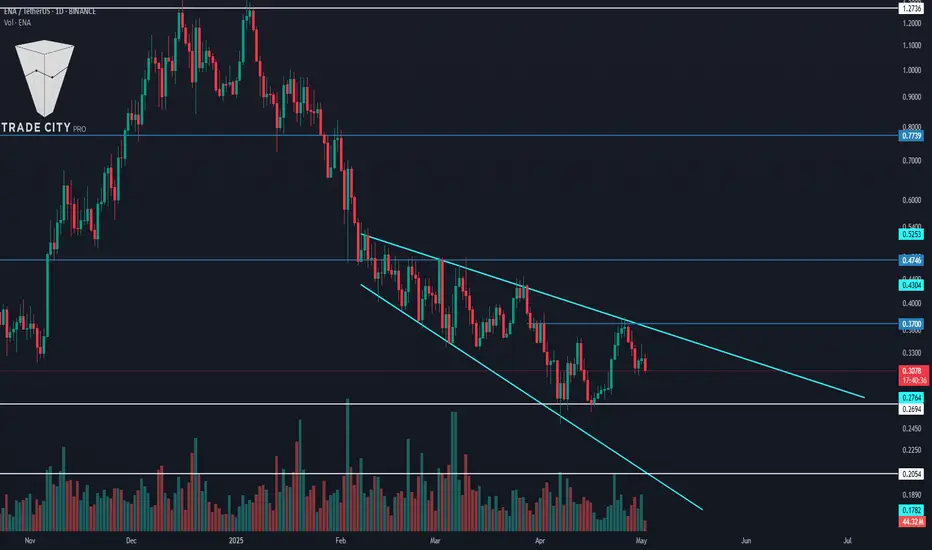
TradeCityPro | ENA: Expansion Pattern Near Critical Break Levels👋 Welcome to TradeCity Pro!
In this analysis, I want to review the ENA coin for you. The Ethena project is one of the DeFi projects in crypto that has attracted a lot of hype in this category.
💥 ENA coin, with a market cap of $1.7 billion, ranks 50th on CoinMarketCap.
📅 Daily Timeframe
As you can see on the daily chart, there is an Expanding Triangle, and the price is fluctuating within this pattern.
📚 One key characteristic of an Expanding Triangle is that while the price is within the triangle, it tends not to respect static levels such as supports and resistances. Currently, the price is within the triangle and, as you can see, it doesn’t respond significantly to static zones.
📈 For this coin to become bullish, the triangle must break to the upside and the triangle trigger at 0.37 should be activated. In that case, the price can move upward and begin a bullish trend. Full confirmation of the bullish reversal will come with price stabilization above 0.4746.
✔️ For continued downward movement, the first trigger is the break of 0.2694. If you already hold this coin, you can use this level as a stop-loss — and once the price closes below it, you can trigger your stop-loss.
📊 For short positions, the break of 0.2694 is a valid trigger, but the issue is that it activates before the triangle breaks, and I personally prefer not to open a position within an Expanding Triangle — I’d rather wait and enter after it breaks.
🔽 Another trigger for a bearish move is the break of 0.2054. This is the main support for ENA, and if it breaks, the price will register a new All-Time Low.
📝 Final Thoughts
This analysis reflects our opinions and is not financial advice.
Share your thoughts in the comments, and don’t forget to share this analysis with your friends! ❤️
TradeCityPro | ENSUSDT Huge Breakout Coming? 👋 Welcome to TradeCityPro Channel!
Let’s dive in and analyze one of the DeFi coins, ENS, together. It’s been performing well recently and has some exciting news!
🌐 Bitcoin Overview
Before starting the analysis, I want to remind you that, as per your request, we’ve moved the Bitcoin analysis from the main section to a separate daily analysis. This allows us to discuss Bitcoin’s status in more detail and analyze its charts and dominance together.
This is the general analysis of Bitcoin dominance, which we promised to cover separately and analyze in longer timeframes.
📊 Weekly Timeframe
In the weekly timeframe, ENS is one of the bullish coins in the market with a promising outlook. It began its main upward movement before the start of 2025, back in late 2023.
After breaking the 9.99 level, we entered the main uptrend, and we can say that we broke the market cap ceiling, achieving a new ATH market cap.
We’re also riding a bullish curved line that acts as support. If this line is broken, it signals a weakening of the main uptrend. A drop below 15.90 would indicate a trend change in the MWC (Market Wide Correction).
Currently, our key weekly support has shifted. We were supported at 13.15, easily moving past this level. Our spot exit trigger is now 13.15, whereas last week it was 15.90.
📈 Daily Timeframe
In the daily timeframe, after a rejection from the ATH at 47.68, we entered a range box between 30.75 and 37.77. After some weak movements toward resistance, we saw a corrective wave.
Following a daily engulfing candle that covered the previous three candles, we experienced a sharp downward wave to 13.49. After that, seller pressure seemed to fade, and buyers stepped in. After a fake breakout at 13.49, we saw a move up to 18.41.
Additionally, the trendline formed during the recent declines in this chart was broken after the support at 13.49. However, since the trigger hasn’t been activated yet, we’re not acting on this trendline for now. But if 18.41 is broken, you could consider a risky spot buy.
✍️ Final Thoughts
Stay level-headed, trade with precision, and let’s capitalize on the market’s top opportunities!
This is our analysis, not financial advice always do your own research.
What do you think? Share your ideas below and pass this along to friends! ❤️

HolderStat | Tracking a true ETH strategist📈 Almost $8 million made on ETHUSDT deals.
💡 Ethereum maximalist who staked his entire balance via Lido for liquid staking.

DeFi Index Completes Irregular Flat Correction; Bulls Back?DeFi Index may have a completed irregular flat correction within an uptrend, which may cause another rally this year, according to Elliott wave theory.
Cryptocurrencies are recovering and DeFi Index is now bouncing back above EW channel, so a five-wave impulse into wave (C) of an irregular (A)(B)(C) flat correction in blue wave B can be finished. It means that a higher degree blue wave C can now be in play, which can rally this year all the way back to March 2024 highs. Is this the beginning of an ALTseason?
A basic bullish irregular flat correction is a three-wave (A-B-C) pattern where wave B exceeds the start of wave A and wave C dips below wave A before the overall bullish trend resumes.

TradeCityPro | TON: Eyeing Breakout in Telegram’s Hottest Token👋 Welcome to TradeCity Pro!
In this analysis, I want to review the TON coin for you. This coin is for the Telegram social network, and in 2024, due to airdrops like Notcoin and Hamster that trended, it became very hyped and widely talked about, and the TON blockchain experienced significant growth.
🔍 Currently, the NFT market has also launched on this network, which has prevented this coin from dropping. This coin, with a market cap of $7.78 billion, is ranked 18th on CoinMarketCap.
⏳ 4-Hour Timeframe
In the 4-hour timeframe, as you can see, after the downtrend that the price had, there was a bullish move following the news of Pavel Durov going to Dubai and leaving France, and now the price is in a correction phase again.
⚡️ Currently, a 4-hour range box has formed, with the bottom of this box at the 2.851 zone and the top at 3.216. There's also a mid-line within this box at 3.044, which the price has broken and is moving toward the 3.216 ceiling.
✔️ If the price movement continues toward the top of the box with this momentum and high buying volume, the likelihood of breaking the 3.216 area will increase significantly. So I suggest that with the breakout of this level, you try to have a long position open.
📉 For a short position, if the price gets rejected from the top of the box, you can enter a trade with a trigger on a lower timeframe. Otherwise, the first trigger is the break of 3.044, and the second trigger is the break of 2.851.
🔼 For a long position, the RSI oscillator is near the Overbought area, and if it enters Overbought, we can expect a sharp bullish move.
📊 Market volume is currently in favor of buyers and is increasing. If volume increases and RSI enters Overbought, you can place a stop buy order above the 3.216 level so that if there is a sharp breakout of this level, your position gets triggered as well.
📝 Final Thoughts
This analysis reflects our opinions and is not financial advice.
Share your thoughts in the comments, and don’t forget to share this analysis with your friends! ❤️

TradeCityPro | MNTUSDT The Best Coin for Short Positions👋 Welcome to TradeCityPro Channel!
Let’s dive into the analysis of the popular DeFi coin that’s active on the Mantle chain—where they’re running multiple airdrops and utilizing it for fees. Let’s break it down and analyze it together!
🌐 Overview Bitcoin
Before starting the analysis, I want to remind you again that we moved the Bitcoin analysis section from the analysis section to a separate analysis at your request, so that we can discuss the status of Bitcoin in more detail every day and analyze its charts and dominances together.
This is the general analysis of Bitcoin dominance, which we promised you in the analysis to analyze separately and analyze it for you in longer time frames.
📊 Weekly Timeframe
After hitting 1.4077, which was our previous ATH, there were practically no buyers present here, preventing us from breaking this key ceiling and moving upward.
Additionally, after the rejection from this high and an engulfing of the previous two candles, it’s safe to say our upward movement has concluded, and we’re now heading into at least a period of correction. This has already started as we’ve entered a resting phase from the prior trend.
However, after breaking 0.9030 coinciding with the news of the Bybit hack and the theft of Ethereum and its coins by North Korean hackers we experienced a sharp drop. Given that Bybit held a large volume of this token, the decline was even more pronounced.
📉 Daily Timeframe
In the daily timeframe, after the rejection from 1.4077 and a deep drop, we moved upward again. This time, we hit resistance at 1.2353 multiple times, but nothing happened buyers couldn’t push above this level.
With this lack of buying pressure, sellers stepped into the market. We then formed a support at 1.0102, but after breaking it along with the hack news we saw a sharp drop down to 0.06552! This level is highly significant!
It’s important because this was previously a key resistance, and after breaking it earlier, we kicked off our main uptrend. So, it’s a critical support now, and it won’t break easily! However, if this support does fail, we’ll likely see a drop to 0.5340.
For buying, it’s not a good time yet. But if we get support at 0.6552 with a strong daily candle, we could consider a buy. Alternatively, wait for a box formation and structure. Our current entry trigger would be a break above 0.8464. For selling, my stop loss would be below 0.5340.
🕓 4-Hour Timeframe
In the 4-hour timeframe, after a rejection from 0.8492, we moved down to 0.6539, where we’re currently ranging around this support. A break of this level could set up an excellent short position opportunity.
For a short position, breaking below 0.6539 offers a clean and complete trigger, allowing us to capitalize on this move.
For a long position, we have a couple of scenarios: a fake breakout of the critical 0.6539 support or a break above the 0.6716 trigger could justify opening a long. While there are better coins for longs, a break of the ceiling with higher highs and lows could also warrant a long position.
✍️ Final Thoughts
Stay level-headed, trade with precision, and let’s capitalize on the market’s top opportunities!
This is our analysis, not financial advice always do your own research.
What do you think? Share your ideas below and pass this along to friends! ❤️

TradeCityPro | AAVE: Key Triggers in DeFi Lending Giant's Trend👋 Welcome to TradeCity Pro!
In this analysis, I want to review the AAVE coin for you. The AAVE project is one of the largest DeFi projects, operating in the lending sector, and holds the highest TVL among all projects in this category.
✔️ Currently, the coin of this project has managed to achieve a $2 billion market cap and with this market cap, it ranks 39th on CoinMarketCap.
📅 Daily Time Frame
In the daily time frame, as you can see, after a long-term uptrend that reached up to 383.59, the price entered a corrective phase and, following the break of the 278.56 zone along with a descending trendline, dropped to the 124.31 level.
💫 The 124.31 support is a very strong one, and the price has reacted well to it. The buying candle volume has increased after the price reached this zone, which indicates the strength of this support.
💥 If this support breaks, the price could begin its next bearish leg. The next support that AAVE has in this time frame is at 77.45, which could prevent further decline in case of a sharp bearish move.
📈 For a long position or spot buy, we first need to wait for the descending trendline to break, and for the price to form a higher low and high above this trendline to confirm a trend reversal.
🔼 Currently, the main bullish trigger is at the 194.97 level, and if this level breaks, the price could move back toward the 278.56 and 383.59 zones.
📉 For a futures position, the 148.17 level is a suitable trigger and can offer a risky long position. However, the spot buy and main position trigger is the 194.97 level. A break of the 50 level on RSI would bring bullish momentum into the market and can serve as a good confirmation for a long position.
🧩 For a short position, breaking the 124.31 level is a good trigger, and if this level breaks and RSI enters the oversold zone, the price could make a sharp bearish move.
📊 But more important than all is the market volume, which currently doesn’t have a clear trend. We’ll have to see whether, upon breaking 124.31 or 148.17, sufficient volume enters the market or not.
📝 Final Thoughts
This analysis reflects our opinions and is not financial advice.
Share your thoughts in the comments, and don’t forget to share this analysis with your friends! ❤️

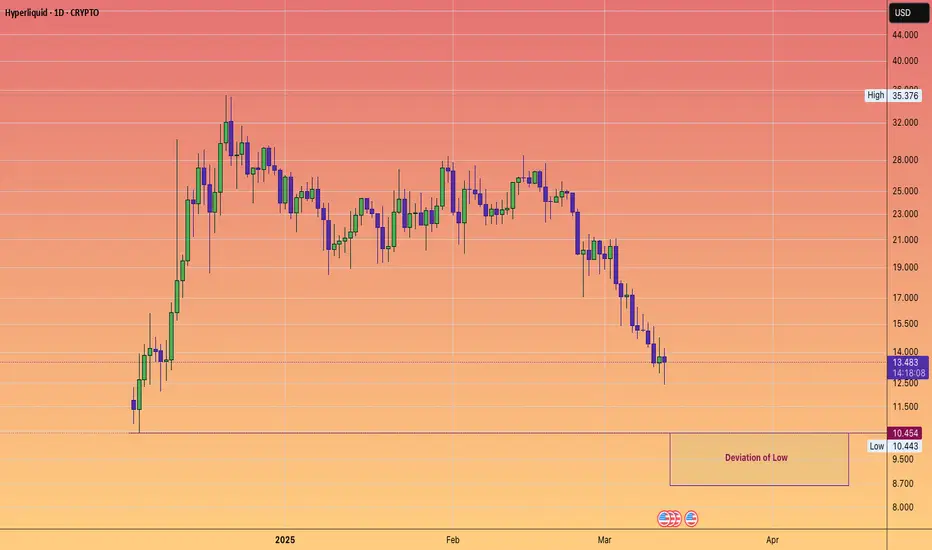
HYPERLIQUID LIQUIDATION SYSTEM EXPLOITED#HYPE is facing price declines following rumours of a malicious actor siphoning funds from the pool and taking advantage of the liquidation process.
While decentralised finance offers incredible opportunities, the actions of a single individual can lead to significant losses as investors pull their capital.
Let's hope Hyperliquid can enhance their security measures to prevent such incidents in the future.
TradeCityPro | SUI: Analyzing the Shift from Hype to Stability👋 Welcome to TradeCity Pro!
In this analysis, I will review the SUI coin. This project gained significant hype in 2024 and experienced a substantial upward movement.
🔍 However, in the past few months, after reaching a price ceiling of 5.2689, it entered a corrective phase, and it can be said that its hype has completely dissipated and no longer carries much excitement.
📅 Daily Time Frame
As you can observe in the daily time frame, the price had a strong upward trend and, after breaking and pulling back to the 1.8392 area, it undertook the next upward leg up to 5.2689. During this movement, a severe divergence occurred in the RSI, which influenced the market when it was activated by breaking 50.
✔️ The upward movement accompanied by a trendline, was broken after being rejected from the 5.2689 area. The trigger for this trendline was the 4.0866 area, which was activated and confirmed the trend change after a pullback to this trigger and the break of the 3.6402 support.
🔽 Currently, after the break of 3.6402, a bearish trendline has formed, and the price has reacted to this area several times. Meanwhile, the price has also reacted to a significant support area around 1.8392. This area, actually a range between 1.6462 and 1.8392, is one of SUI's most crucial supports and could prevent further price drops.
✨ For the coin to become bullish again, the main trigger we have is breaking the bearish trendline, and I believe for buying in the spot market, the primary trigger will be breaking this trendline. There is also a significant resistance at 2.7830, which is the main trigger for breaking the trendline.
📈 If the price makes a lower high and low and breaks the support area it currently holds, the trendline trigger will shift to 2.2495, allowing us to enter earlier. A break of 50 in the RSI will also be a suitable trigger for entering a bullish momentum.
🛒 Alternatively, if you trade reactively, the price's reaction to this support area and breaking short-term resistances in lower time frames could be suitable for risky spot buying.
📊 Currently, the market volume has been more favorable to sellers, with volume increasing during price drops and decreasing during corrections, indicating the strength of the bearish trend. However, after the price reached the support area and reacted to it, we've seen two strong bullish candles with significant volume, which could be the first signs of a trend change.
📉 For the price to turn bearish and start the next bearish leg, as mentioned, breaking the support area and the 1.6462 trigger would be suitable, and in this case, the price could start the next bearish leg.
📝 Final Thoughts
This analysis reflects our opinions and is not financial advice.
Share your thoughts in the comments, and don’t forget to share this analysis with your friends! ❤️

TradeCityPro | CAKE: Slicing Through the Market's Range Box👋 Welcome to TradeCity Pro!
Let's dive into the analysis of Bitcoin and key crypto indices, focusing today on the CAKE coin, as requested in the comments. This coin holds a market cap of $511 million, ranking 93rd on CoinMarketCap.
📅 Weekly Timeframe
In the weekly timeframe, as you can see, there's a very large range box existing from 1.093 to 4.753. This box represents a substantial range, and the price has been in this box for almost three years.
🔍 There's a significant area within this box at 1.549, which currently acts as a very important support. The price has hit this level several times but has yet to break through it.
⚡️ In this timeframe, indicators are not very useful because it's a ranging trend, and in ranging trends, these tools don't perform well. The best tool we can use to analyze a ranging market is support and resistance.
📊 Currently, there is a support at 1.549, as mentioned, which the price has hit several times and has been supported by. If this support breaks, there's another very important support at 1.093, which will be the last support area for the price.
🛒 For buying this coin in spot, there is a very strong supply zone near 4.753. I recommend waiting until this area is broken to start the main bullish trend. This break would signify a potentially strong upward move, so entering before this break could expose you to unnecessary risks given the current ranging conditions.
📝 Final Thoughts
This analysis reflects our opinions and is not financial advice.
Share your thoughts in the comments, and don’t forget to share this analysis with your friends! ❤️

TradeCityPro | XVS: Tracking Its Trajectory in the DeFi Space👋 Welcome to TradeCity Pro!
In this analysis, I want to review the XVS coin, which you requested in the comments. This project is one of the DeFi projects with a market cap of $72 million, ranking 346th on CoinMarketCap.
📅 Weekly Timeframe
In the weekly timeframe, as you can observe, the price started a downtrend after reaching a peak in 2021, and this trend is still ongoing.
✨ Currently, there is a consolidation box from 3.34 to 17.61, and the price has been fluctuating between these two areas for almost three years.
✔️ In the previous weekly candle, the support at 5.45 was broken, and now the price is moving towards the support at 3.34. This support is very crucial, and its breach could trigger another sharp drop.
🔽 There is also a descending trend line that the price has touched twice, and after being rejected by this trend, a significant amount of selling volume entered the market and induced a momentum that led to the breach of the 3.34 support.
📈 For XVS to turn bullish, the only trigger we have for now is the break of the trend line and the activation of its trigger. The trend line trigger is currently at 9.09. However, if the price creates a new structure, we might confirm a bullish turn sooner.
🛒 For buying in spot, the first trigger is the break of 9.09, which is considered a risky trigger in this timeframe. The main trigger is after 17.61.
⚡️ However, as I have mentioned in recent Bitcoin analyses, altcoin triggers and even the Total2 in spot don't currently hold much significance. For buying altcoins in spot, we should wait until Bitcoin dominance turns bearish.
📅 Daily Timeframe
Let's move to the daily timeframe to observe the details of the price movement more closely.
🧩 In this timeframe, we have a curved trend line that the price has hit several times and fallen.
⭐ Currently, after breaking 4.95, we can apply a Fibonacci Extension to find potential support areas. The price has reached the 0.618 level and has tested it. This area might be able to prevent further price falls. Otherwise, the next supports will be at the 0.786 and 1 Fibonacci levels, with the 1 area overlapping with the 3.34 support.
💥 The RSI oscillator is close to oversell and if this oscillator break the 30 level,it will support the bearish movement.
🔼 For buying or a long position, a suitable trigger is the 6.25 area, which is both a significant support and the last peak formed after breaking the 4.95 floor. The main trigger for the start of the primary bullish trend will be at 11.79.
📝 Final Thoughts
This analysis reflects our opinions and is not financial advice.
Share your thoughts in the comments, and don’t forget to share this analysis with your friends! ❤️

TradeCityPro | RUNE: Decoding Its Descent in DeFi Markets👋 Welcome to TradeCity Pro!
In this analysis, I want to discuss the RUNE coin, which was requested in the comments of yesterday's analysis. This project is one of the DeFi projects, with a market cap of $383 million, ranking 118th.
📅 Weekly Timeframe
In the weekly timeframe, as you can see, it has started a downward leg from the peak of 6.894 and is moving downwards, reaching the area of 1.110.
✔️ Currently, it seems that the downward momentum has slightly decreased, and the price is moving downward more slowly. The RSI oscillator is also near the 30 area, ready to enter into Oversell and introduce a new downward momentum into the market.
💫 If this occurs and the price consolidates below 1.110, the next support will be 0.816, which is a very important floor, and if this area breaks, the last support the price will have is 0.386.
🔑 On the other hand, if the price is supported at 1.110 and breaks the trend line that the price has, we can confirm a trend change and the start of a new upward trend. The main trigger will still be 6.894.
📅 Daily Timeframe
In the daily timeframe, the price has a range box between 1.091 and 1.504, and after the downward leg following the break of 3.210, it has now entered a ranging phase and is ranging in this area.
🔽 For a short position, given that the price has hit a lower high compared to 1.504, the likelihood of breaking the floor of the box is high, and with the break of 1.091, we can enter a short position.
📊 An important point is that the market volume in this range box has decreased significantly and keeps decreasing. With the entry of volume in any direction, the market can start moving in that direction.
📈 If buying volume enters the market, the first long trigger is the break of the 1.504 area. This area overlaps with the 0.236 Fibonacci, and breaking this area, the next important levels are 0.382, 0.5, and 0.618 Fibonacci.
📝 Final Thoughts
This analysis reflects our opinions and is not financial advice.
Share your thoughts in the comments, and don’t forget to share this analysis with your friends! ❤️

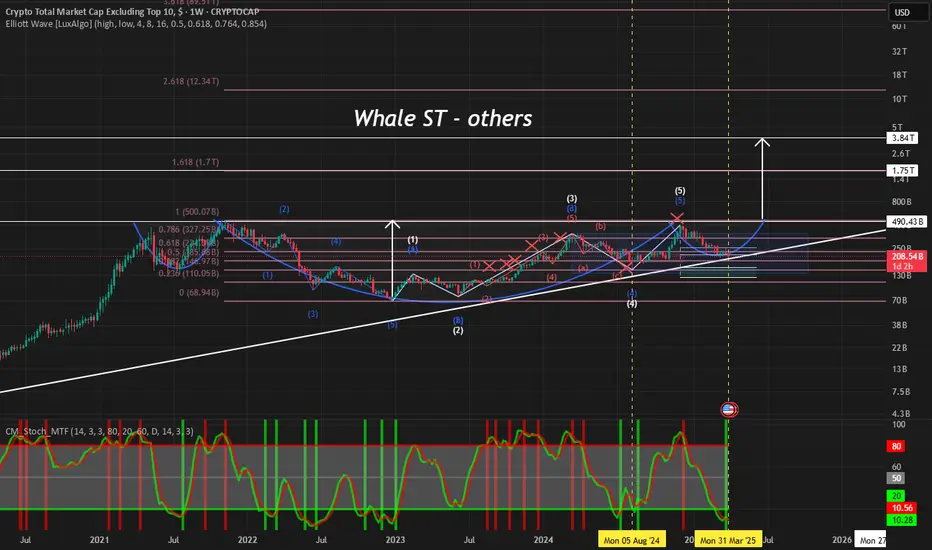
$others @whalest_The Others chart has not yet seen its old peak. I think the big rise will start soon. This chart represents other altcoins except for big projects. There will be exciting times soon.
From MAGA to DEFI: The Trump Crypto ConnectionThe relationship between decentralized finance (DeFi), the Trump family, and Kevin O’Leary in 2025 centers around their public involvement in the crypto and blockchain space, particularly highlighted by their participation in events like DeFi World 2025 and specific DeFi projects tied to their names or influence.
The Trump family, notably Donald Trump Jr. and former President Donald Trump, has increasingly engaged with DeFi and cryptocurrency. Donald Trump Jr. spoke at the DeFi World 2025 Conference in Denver on February 26, alongside Kevin O’Leary, signaling a growing interest in blockchain’s potential to shape finance. Posts on X from DeFi confirm their appearances, with Trump Jr. scheduled at 3:00 PM and O’Leary at 3:45 PM, reflecting a shared platform to promote DeFi’s future. Beyond this event, the Trump family is linked to World Liberty Financial (WLFI), a DeFi project launched in September 2024. WLFI aims to democratize crypto lending and borrowing while reinforcing the U.S. dollar’s dominance, operating on Aave’s v3 protocol.
Although Donald Trump and his family are not direct operators of WLFI, the project leverages the Trump brand, with 70% of its token supply held by insiders and 75% of revenues directed to DT Marks DEFI LLC, a Trump-connected entity. Trump himself has pushed pro-crypto policies, including banning central bank digital currencies and exploring a national crypto stockpile, aligning with DeFi’s ethos of decentralization.
Kevin O’Leary, a Canadian investor and “Shark Tank” star, has been a vocal DeFi advocate since at least 2021, when he invested heavily in DeFi Ventures (later renamed WonderFi), targeting 4.5–8% yields on crypto assets. His participation in DeFi World 2025 alongside Trump Jr. underscores his ongoing commitment. O’Leary sees DeFi as a way to bypass financial middlemen, predicting it could transform trading within years. His practical involvement contrasts with the Trump family’s more symbolic and policy-driven engagement, though both share a bullish stance on crypto’s future.
I`m extremely bullish on this coin at this level.

$AVAX: Avalanche – Snowballing Gains or Melting Away?(1/9)
Good evening, everyone! 🌙 CRYPTOCAP:AVAX : Avalanche – Snowballing Gains or Melting Away?
With AVAX at $23.07, is this blockchain beast a sleeper hit or a slippery slope? Let’s avalanche into it! 🔍
(2/9) – PRICE PERFORMANCE 📊
• Current Price: $ 23.07 as of Mar 25, 2025 💰
• Recent Move: Up from $18, below $40 highs, per data 📏
• Sector Trend: Crypto volatile, AVAX rides the waves 🌟
It’s a rollercoaster—hold tight for the drop! ⚙️
(3/9) – MARKET POSITION 📈
• Market Cap: Approx $9.56B (414.78M tokens) 🏆
• Operations: Scalable L1 for DeFi, dApps, subnets ⏰
• Trend: $1.121B DeFi TVL, whale buys, per posts on X 🎯
Firm in L1 race, but market’s a blizzard! 🚀
(4/9) – KEY DEVELOPMENTS 🔑
• Whale Action: 500K tokens moved, per posts on X 🌍
• DeFi Strength: $1.121B TVL holds firm, per data 📋
• Market Vibe: Bearish Fear Index (34), yet resilient 💡
Snowballing quietly amid crypto storms! ❄️
(5/9) – RISKS IN FOCUS ⚡
• Market Correction: Bearish pressure could sink it 🔍
• Competition: Solana, Ethereum vie for dApps 📉
• Macro Woes: Trade tensions, rates shake things ❄️
It’s a chilly slope—brace for ice! 🛑
(6/9) – SWOT: STRENGTHS 💪
• Scalability: 4,500 TPS, beats rivals 🥇
• DeFi Base: $1.121B TVL, solid ecosystem 📊
• Adoption: Enterprise use grows, per data 🔧
Got a snowy peak of potential! 🏔️
(7/9) – SWOT: WEAKNESSES & OPPORTUNITIES ⚖️
• Weaknesses: Volatility, high off $59 peak 📉
• Opportunities: Whale buys, subnet growth 📈
Can it snowball or melt under pressure? 🤔
(8/9) – POLL TIME! 📢
AVAX at $23.07—your take? 🗳️
• Bullish: $30+ soon, whales fuel it 🐂
• Neutral: Steady, risks balance out ⚖️
• Bearish: $18 looms, correction hits 🐻
Chime in below! 👇
(9/9) – FINAL TAKEAWAY 🎯
AVAX’s $23.07 price tags a volatile gem 📈, with DeFi strength but market risks 🌿. Dips are our DCA jackpot 💰—buy low, ride high! Gem or bust?

CAKEUSDT (PancakeSwap): Sweet Gains or Stale Trade?(1/9)
Good afternoon, everyone! ☀️ CAKEUSDT (PancakeSwap): Sweet Gains or Stale Trade?
With CAKE at $2.599, is this DEX token a tasty treat or a flat pancake? Let’s flip the details! 🔍
(2/9) – PRICE PERFORMANCE 📊
• Current Price: $ 2.599 as of Mar 25, 2025 💰
• Recent Move: Consolidating $2.6-$2.8, up from $2.34, per data 📏
• Sector Trend: Crypto steady, DeFi mixed amid trade tensions 🌟
It’s a flip-flop—value might be cookin’! ⚙️
(3/9) – MARKET POSITION 📈
• Market Cap: Approx $760M (292M circulating) 🏆
• Operations: Leading BNB Chain DEX, yield farming, staking ⏰
• Trend: Deflationary model burns 102% minted, per data 🎯
Firm in DeFi, but volatility’s the spice! 🚀
(4/9) – KEY DEVELOPMENTS 🔑
• Recent Surge: Up 45% earlier in March, per X posts 🌍
• Platform Updates: Expanded NFT marketplace, per web data 📋
• Market Reaction: High volume ($230M daily), showing interest 💡
Adapting to DeFi trends, cooking up growth! 🍳
(5/9) – RISKS IN FOCUS ⚡
• Regulatory Risks: Crypto scrutiny could hit DEXs 🔍
• Market Volatility: Crypto swings could drag price down 📉
• Competition: Other DEXs like Uniswap challenge, per data ❄️
It’s a risky recipe—watch the heat! 🛑
(6/9) – SWOT: STRENGTHS 💪
• DEX Leader: Top on BNB Chain, strong user base 🥇
• Deflationary Model: Burns tokens, potentially boosts value 📊
• High Volume: $230M daily, per data, shows activity 🔧
Got a sweet spot in DeFi! 🏦
(7/9) – SWOT: WEAKNESSES & OPPORTUNITIES ⚖️
• Weaknesses: Price volatility, regulatory fears 📉
• Opportunities: DeFi adoption, new features like lending 📈
Can it rise or get burned? 🤔
(8/9) – POLL TIME! 📢
CAKE at $2.599—your take? 🗳️
• Bullish: $3+ soon, DeFi booms 🐂
• Neutral: Steady, risks balance gains ⚖️
• Bearish: $2 drops, market sours 🐻
Chime in below! 👇
(9/9) – FINAL TAKEAWAY 🎯
CAKE’s $2.599 price reflects consolidation, with strengths in its platform and deflationary model, but risks from market volatility and competition persist. DCA-on-dips could be a strategy to average in over time, banking on long-term growth. Gem or bust?

Trading opportunity for RONUSDTBased on technical factors there is a Buy position in :
📊 RONUSDT
🔵 Buy Now
🪫Stop loss 0.6950
🔋Target 0.9900
📏 R/R 1,8
💸RISK : 1%
We hope it is profitable for you ❤️
Please support our activity with your likes👍 and comments📝

FireHoseReel " XVSUSDTWelcome to FireHoseReel ! ❤️
Today we're gonna dive into the XVS coin and break down what the project is all about. Stick with us
This coin has shot up 40% after breaking its upward channel, and then it had a solid climb but pulled back 50% because of profit-taking and heavy selling. It created a key demand zone, and a lot of market makers, retail traders, and exchanges have been buying in the $4.70 to $5.30 range. The next targets for this coin could be $11.50 and $12, and we could see a price increase of up to 90% !
XVSUSDT is the trading pair for the Venus token (XVS) against Tether (USDT). Venus is a decentralized finance (DeFi) protocol built on the Binance Smart Chain (BSC) that allows users to borrow and lend cryptocurrencies.
With Venus, users can supply assets to the platform to earn interest or take out loans using their crypto as collateral. The XVS token serves as the governance token for the Venus protocol, allowing holders to participate in decision-making processes related to the platform’s development and operations.
Hope you guys found these analyses useful! Wishing you all the best 🔥 Don't forget about money management and risk management. Love you all, friends ❤️

Trading opportunity for PENDLEUSDTBased on technical factors there is a Buy position in :
📊 PENDLEUSDT
🔵 Buy Now
🪫Stop loss 1.800
🔋Target 2.550
📏 R/R 2
💸RISK : 1%
We hope it is profitable for you ❤️
Please support our activity with your likes👍 and comments📝
