ETH/USD Weekly TA Cautiously BearishETH/USD Weekly cautiously bearish. *With the merge finally expected to be deployed on Ropsten Testnet around June 8th and then hopefully on the Ethereum Mainnet within the following few months, Terra collapsing and Solana network outages... there is reason for bullishness, but with fears of full blown recession being staked by the US economy being in stagflation it's generally advised to be risk off unless you're an investor with a long time horizon.* Recommended ratio: 30% ETH, 70% cash. Price is currently testing $1944 support which is just above the critical uptrend line from June 2020 ($1800). Volume is currently lower than last week's and on track to favor sellers for a seventh consecutive session. Parabolic SAR flips bullish at $3917; this margin is mildly bullish. RSI is trending down slight at 34.60 and is still technically testing 37.35 but if it doesn't bounce here then it will likely test the lower trendline of the descending channel from August 2020 at ~32. Stochastic remains bearish and is currently trending down at 3.51 as it will look to touch max bottom in the current or next session. MACD is currently forming a new ATL at -232.81 with no sign of trough formation. ADX is currently trending up slightly at 22 as Price continues to fall, this is mildly bearish. If Price is able to defend support at $1944 then it will likely consolidate before retesting $2361 resistance. However, if Price breaks down here, it will have the uptrend line from June 2020 at $1800 as the last line of support before potentially testing the lower trendline of the descending channel from October 2021 at $1407 support. Mental Stop Loss: (two consecutive closes above) $2361.
DEFI

ETH/USD Daily TA Neutral BearishETH/USD Daily neutral with a bearish bias. Weak Head and Shoulders formation from March 2021 still in play -- equity markets and crypto markets are still highly correlated, equity markets have been bullish this week so be ready for it to carry over into cryptos . Recommended ratio: 47% ETH, 53% cash. Price is currently trending down at $2050 after being rejected by the 50/50 uptrend line from February 2017 ($2100) as resistance on the first test. Volume has dropped back to being moderately low and has favored buyers in four of the past five sessions, indicating that there is a bit of support at $1941. Parabolic SAR flips bearish at $1700, this margin is neutral at the moment. RSI is currently trending up at 33.60 as it approaches 36.91 resistance. Stochastic remains bullish and is currently trending up at 35; it is still technically testing 22.98 resistance. MACD remains bearish and is currently trending sideways (slightly up) at -254; it will need to break above -208 to crossover bullish. ADX is currently trending up slightly at 46 as it continues to trend toward a peak formation, which would in this case signal a potential incoming retracement or reversal. If Price is able to close above the 50/50 uptrend line from February 2017 ($2117) for two consecutive sessions, the next likely target would be a test of $2408 minor resistance. However, if Price continues to fall here it will likely retest $1941 support before potentially heading lower to $1426 support. Mental Stop Loss: (two consecutive closes above) $2117.

ZKTUSDT hidden gem on Layer 2. Major updates are here!Fundamental Analysis #ZKTUSDT
zkTube has Rebranded to ZKTMETA :
Key Takeaways
By merging its metaverse operation systems with its industry-leading Layer-2 network, ZKTMETA is turning the dream of a rich metaverse into the average consumer’s reality
The project is all set to facilitate metaverse games with the sophistication of epic proportions thanks to the raw power, affordability, and security of its Layer-2 network
At the same time, it’s empowering creators by laying the groundwork for them with the metaverse operation system. This will undoubtedly accelerate the pace of innovation as more and more creators bring their diverse imaginations to the table
The potential of ZKTMETA is already being realized in the form of its first metaverse game known as MetaTube.
1.Building a Metaverse Operation System on Layer 2
2.Why Layer-2 is the Right Choice ?
3.The Future of Metaverse is Here
4.The First Metaverse Game on ZKTMETA
Checkout their official twitter updates @zkTubeOfficial
Technical Analysis
1.Breakout from 13-21-55 EMA and retesting the level and show's perfect time to enter.
2.Breakout from descending triangle and retesting shows momentum .
3. Etherscan shows major coin holder's are accumulating in dip.
#ZKTMETA #ZKTUSDT #metaverse #blockchain

it was end of the 2nd wave?butterfly harmonic pattern:
X=$1.47
A=$0.0054
AB=0.78 XA
BC=0.88 AB
0.78 BC=$0.193
0.88 BC$0.285
0.78 XA=$0.443
1.13 BC=$0.74
0.88 XA=$0.776
1.13 XA=$3
1.6 BC=$4.97
1.27 XA=$6.74
1.41 XA=$14.46
2 BC=$22.13
1.6 XA=$46.8
2.24 BC=$56.5

Why I believe Bitcoin is due for further correction?Hey Crypto Community!
Following the UST/LUNA and related FUD events last week Bitcoin has dropped from $35,000 all the way down to $25,200. It has re-bounced back to $30,000 level on the following day and is currently trying to re-test significant resistance level of $30,000.
It is important to monitor crypto markets tomorrow and see at which level Bitcoin weekly candle will close. Should Bitcoin price end its week below the
$30,000 price level, there will be a high probability of downtrend continuation.
Why I believe that we will see Bitcoin sliding towards lower levels?
1. RSI indicator on a weekly timeframe is still in a bearish divergence and has not reached the bottom of its oversold territory.
2. 200 Daily Moving Average has been a strong support level during the bear market and indication of Bitcoin bottom.
Therefore, I expect Bitcoin price to go to its lower price levels. It looks like its due for another leg down and is very close near its capitulation.
In my next idea I will be sharing few macro indicators that already signalling the beginning of Bitcoin capitulation and BUY zone. I will share the best Bitcoin BUY signals.
Stay Crypto!
Please don't forget to "Like" this idea and follow to see my updates and ideas.

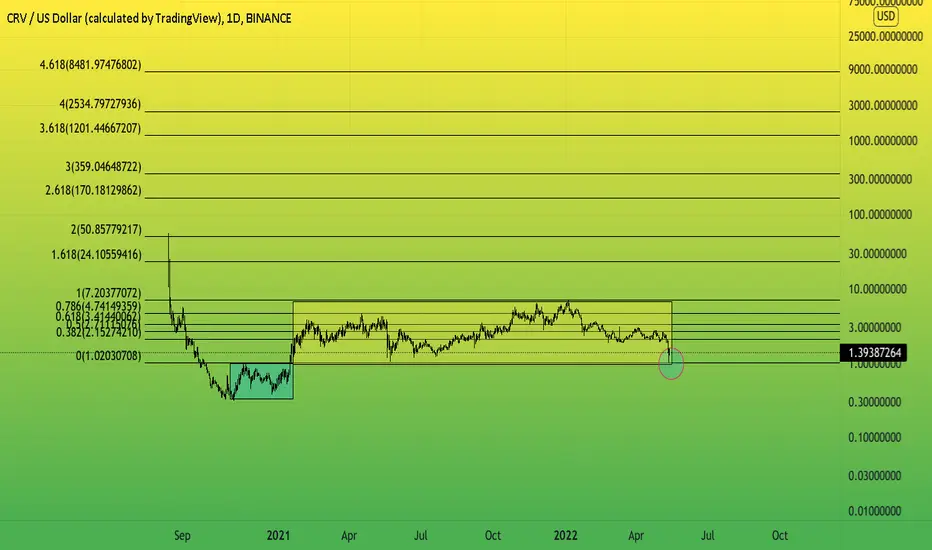
$CRV vs $TSLAthe pattern of consolidation
the flush before the move
for me CRV is the tesla of finance
not financial advice

LUNA PONZI PLAYED OUT PERFECTLYThis LUNA chart that I charted back in February speaks for itself.
Head & Shoulders target met, Diamond Top pattern hit.
BTC dumped November, LUNA went onto pump and make ATH.
The fake out is the best I have ever seen as I said in previous post.
LET me be clear, I do not follow the news so I did not no what happened with LUNA until my girlfriend told me to check the charts when I was at work.
I was not surprised because the charts show you the news before it happens days, weeks, months in advance.
One ENTITY and one person making the moves is called a Composite, which makes this a centralised project (centralised finance).
I hope this chart shows people to remove emotion and zoom out.
NOT FINANCIAL ADVICE.

LUNA Daily Analysis 5.11.2022🔴 This coin with a 60$ billion market cap is moving towards zero with a 97% correction.
🟢Experience in the crypto market has shown that when the market is willing to pour, the word price floor does not have as much meaning as it does in the rising waves of the ceiling. So do not enter the purchase until the return pattern is seen in the currency in the hope that the currency is on the floor and do not risk your entire capital for a small profit.
💎Seeing the chart above, those who are familiar with the word loss limit and have strictly observed it will smile.

LUNA 1 DAILY ANALYSIS (UPDATE)📆🟡 LUNA/USDT (TERRA)
📊 Time Frame: Daily
➖➖➖➖➖➖➖➖➖➖➖➖➖➖
💎 Investment Opporutunity
🟢 BUY : 30$ - 35$
🟢 BUY : 22$ - 28$
🎯TP1: 43$ - 50$
🎯TP2: 60$ _ 75$
💹 Stop loss: One Daily Candle Below 20$
✍ Analysis Method : ICT+ Trend Analysis
📊 Analyzed By Hossein
📆05.10.2022

Muh Alts :-(It's that time of the year everyone. First targets are half off. This was a low risk trade at the .618 retrace. If stopped out, will look for shorts at .786 / .887 of the move.
Technical Analysis : As the market giveth, it will also taketh
Fundamentals Analysis : #elon2021

DeFi (TOTALDEFI)• Break of trend signs of weakness Posting chart idea following the video I made on this.
It is expected to see several DeFi projects to let go some of the 2021 gains and possible 2020. But we are not there... just yet.
This chart is one of major reason I could see Bitcoin also get a huge cut like piercing bellow 30k.

$GAL/USDT 1h (#KuCoin) Descending channel breakoutProject Galaxy is the new Binance Launchpool and just regained 50MA support, looks ready for another leg-up!
⚡️⚡️ #GAL/USDT ⚡️⚡️
Exchanges: Binance, KuCoin
Signal Type: Regular (Long)
Current Price:
10.750
Entry Zone:
10.678 - 10.002
Take-Profit Targets:
1) 12.353
2) 14.375
3) 16.397
Stop Targets:
1) 8.582
Risk/Reward= 1:1.15 | 1:2.3 | 1:3.45
Expected Profit= +19.47% | +39.02% | +58.58%
Possible Loss= -17.00%
Fib. Retracement= 0.5 | 0.702 | 0.883
Margin Leverage= 1x
Estimated Gain-time= 1 week
Tags: #GALUSDT #Galaxy #Web3 #MVB #Oracle #Creation #DeFi #BSC
Website: galaxy.eco
Contracts:
#ERC20 0x5fAa989Af96Af85384b8a938c2EdE4A7378D9875
#BEP20 0xe4Cc45Bb5DBDA06dB6183E8bf016569f40497Aa5

BTC AT 28K IS INEVITABLE. By wasting so much time staring at my chart since the start of the year. Trying to figure out when will be the next pump. Well folks, i therefore conclude that, we will not see something like that again till NOVEMBER 2022. So hold tight, uninstall every crypto related apps and book trip to Himalayas or any sacred places. Retreat, train train train, mentally, physically and psychologically. Good day everyone.

beautiful flagSushi has a low risk to reward ratio at this price.
Fibo extension levels:
1 (1-a-b)=$4
1 (C-1-c)=$196

thorchain in the 2nd wavecrab harmonic pattern:
X=$45.2
A=$0.004
AB=0.38 XA
BC=0.38 AB
1.6 BC=$0.32
2 BC=$0.54
2.24 BC=$0.74
2.6 BC=$1.21
3.6 BC=$4.55
0.78 XA=$6.17
4.23 BC=$10.28
0.88 XA=$15.65
1.13 XA=$151
6.85 BC=$323
1.27 XA=$567
1.41 XA=$2047
1.6 XA=$14167

Avax Long positionAvax 1 D timeframe chart is showing signs of momentum and strengh. Great opportunity to go long on avax.
-Rsi bullish divergence;
-Volume decreasing;
-Geting close to a huge support zone.

AVAX Investment Opporutunity📆🟡 AVAX/USDT (Avalance)
📊 Time Frame: 4H
➖➖➖➖➖➖➖➖➖➖➖➖➖➖
💎 Investment Opporutunity
🟢 BUY : 50.5$ - 55.5$
🟢 BUY : 40.5$ - 45.5$
🎯TP: 64$ - 72$
💹 Stop loss: One Daily Candle below 38$
✍ Analysis Method : ICT+ Neural Network
📆05.07.2022

ETH/USD Daily Neutral BearishETH/USD Daily TA neutral with a bearish bias. Recommended ratio: 35% ETH, 65% cash. Price is currently retesting $2684 minor support after being rejected by the uptrend line from 01/22/22 at ~$2900 as resistance. Volume remains moderately low and has favored sellers in two consecutive sessions, if bulls can't defend this minor support then three consecutive seller dominant days is likely. Parabolic SAR flips bullish at $2960. RSI is currently trending sideways at 55.31 just above 36.91 support. Stochastic is on day 2 of being bearish and is breaking down below 46.76 resistance after briefly breaking out above it; it is currently trending down at 29.77 with no signs of trough formation and the next support (minor) is at 17.81. MACD remains bearish after a failed attempt at a bullish crossover and is currently retesting -90.80 support. ADX is currently trending up slightly at 26 as Price continue to see selling pressure, this is bearish. If Price is able to defend support at $2684, then the next likely target is a retest of $3000 resistance (which would also be the largest supply zone). However, if Price breaks down here, then it will likely retest $2544 support before potentially retesting $2408 minor support. Mental Stop Loss: (two consecutive closes above) $3000.

DeFiChain Looks Extremely BullishOn the USD pair (left) three breakout attempts including current can be identified, the current one presents a nice bullflag to buy into on this daily timeframe
I dont have much to say about the BTC pair


Defi is forming a triple bottom⁉️💎In one of our last Defi analyses we have shown the formation of the double bottom. After the price bounced off the 8500 resistance area for the second time, we can witness a potential formation of a triple bottom.
💎The critical support lies at 5590, which is confirmed by the 88.6% Fibonacci retracement level. As of yet, Defi respected the support while trading at the bottom of the 5590 - 8770 range. This might be the beginning of a new cycle, based on the previous market waves.
💎We must start to see is ...

DEFI TOTAL BullishDEFI TOTAL looks extremely bullish as it sits above this yellow long term trend line and post moving out of a rising wedge that will end up playing in the bullish favor
Triangles like this have been seen before and are in green
