GRTUSDT bounced on 0.618 Fibonacci level 🦐$GRT.X is inside a descending channel. IF the price will have a breakout upward and retest 4h resistance as new support, According to Plancton's strategy (check our Academy), we can set a nice order
–––––
Follow the Shrimp 🦐
Keep in mind.
🟣 Purple structure -> Monthly structure.
🔴 Red structure -> Weekly structure.
🔵 Blue structure -> Daily structure.
🟡 Yellow structure -> 4h structure.
⚫️ Black structure -> <4h structure.
Here is the Plancton0618 technical analysis, please comment below if you have any question.
The ENTRY in the market will be taken only if the condition of the Plancton0618 strategy will trigger.
Descending

Are we Going to hit All time High with DASH?After Almost two years DASH Has broke out his Weekly And Yearly Dynamic descending Line and Now we Have really nice pullback to the line with strong Engulfing Candle in weekly Time Frame ,ADX indicator also has passed the 20 period and it could be considered as good sign.
we could be hopeful that, price will break the mid line of Ascending Weekly Channel in few weeks ,than should deal with strong resistance zone between 150 and 170 $. if price could break this zone we will have really good Potential to reach 500 and 1000$ in medium period and hopefully ATH in few months.

Can USDCAD break the upper structure?here we have a nice descending and condensing structure. a quick look at the MACD shows us that this sell off looks to be tiring.
We have already seen a break of the larger structure, now we need to see that the smaller patterns bottom holds, and find a break of the upper structure to look for long opportunities. Smaller targets are potential for now and can easily move should this smaller correction continue to form. If we see a new low form, then the larger targets will move down a little in ratio to the new low. Fibs will show us this and i will reapply them should I need to.

AUDCHF on a retracement move 🦐AUDCHF after breaking above the weekly structure couldnt create new highs.
The price lost the bullish momentum and now is melting below the support area below a descending trendline.
IF the market will close the candle below, at the retest we can set a nice short order according to Plancton's strategy.
–––––
Follow the Shrimp 🦐
Keep in mind.
🟣 Purple structure -> Monthly structure.
🔴 Red structure -> Weekly structure.
🔵 Blue structure -> Daily structure.
🟡 Yellow structure -> 4h structure.
⚫️ Black structure -> <4h structure.
Here is the Plancton0618 technical analysis , please comment below if you have any question.
The ENTRY in the market will be taken only if the condition of the Plancton0618 strategy will trigger.


Closer look at Ascending/Descending structure price action
Hello everyone:
Let's take a closer look at the Ascending/Descending channel structure in the market.
Typical ascending channel will happen at the top of the overall price action, and once the correction is finished, we have a high probability to see the price reverse.
Whereas a descending channel structure will form at the bottom of the overall price action, and once correction is complete, we are likely to get a reversal from the bottom.
Smaller chances these channels will appear in an impulsive move as a continuation correction, but not as frequently as appear as a reversal correction.
These channel correctional structures are forming because there's currently a close number of buyers and sellers in the market that continue to go against each other, hence price isn't in the “impulsive” phrase, rather just in the “correctional” phrase. But, we know from the nature of the market, once the correctional channel completes, we have a high probability of entering the impulsive phrase, and the reversal move is likely to be sharp and fast.
The key is to identify these Ascending/Descending channels on the higher time frame analysis, and go down to the lower time frame to confirm the reversal price action. This will allow you to get maximum R:R. You want to find reversal price action on the LTF to give your extra confluence and confirmation that the Ascending/Descending channel is finished correcting, and an impulsive phrase will enter the market.
As always, feel free to ask me questions or comments.
Thank you


ETH/USDT Descending triangle?Greetings!
chart is speaking it self!!
as you can see in the chart . Ethereum is in a descending triangle and this can lower the price
As you can see, we have a divergence shown in the chart that shows the price falling
And as you can see, there is a hidden divergence that has pushed up price today
Line 390 is an important line that if the price can break this line, the price will grow well.
If the downtrend line does not break, the price will go down.
Remember that Trend is our friend and we have to hold his hand and go with it.
if you liked this idea or have your opinion on it, write in the comments,We will be glad.
Have a nice day.

HERE'S WHAT TO LOOK OUT FOR ON OMG (altcoin investment)Drop a like if this helps you out, its free! :)
All explanations on the chart.
This is an investment not a trade.
Don't expect 100% returns in the next 2 days. This is a long term investment plan and one that has a lot of upside potential

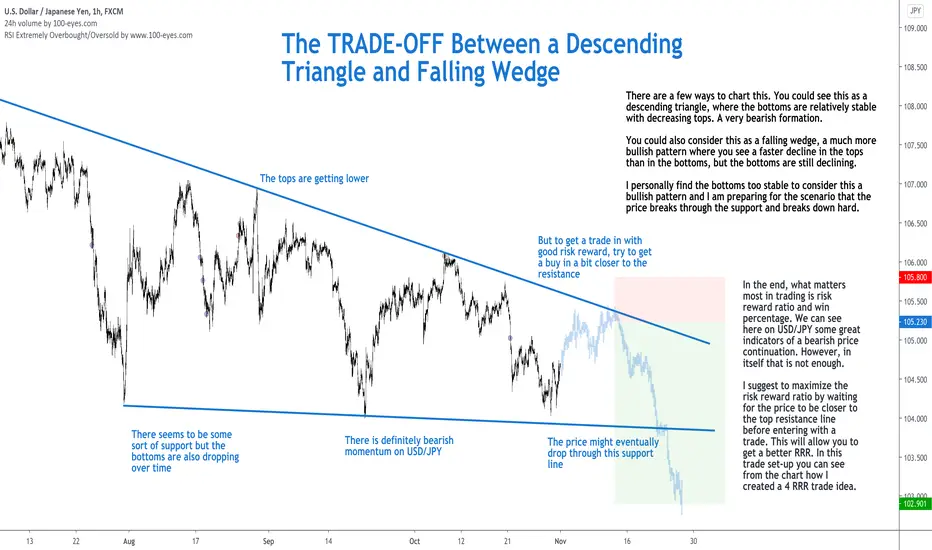
The TRADE-OFF Between a Descending Triangle and Falling WedgeThere are a few ways to chart this. You could see this as a descending triangle, where the bottoms are relatively stable with decreasing tops. A very bearish formation.
You could also consider this as a falling wedge, a much more bullish pattern where you see a faster decline in the tops than in the bottoms, but the bottoms are still declining.
I personally find the bottoms too stable to consider this a bullish pattern and I am preparing for the scenario that the price breaks through the support and breaks down hard.
In the end, what matters most in trading is risk reward ratio and win percentage. We can see here on USD/JPY some great indicators of a bearish price continuation. However, in itself that is not enough.
I suggest to maximize the risk reward ratio by waiting for the price to be closer to the top resistance line before entering with a trade. This will allow you to get a better RRR. In this trade set-up you can see from the chart how I created a 4 RRR trade idea.
Follow me for consistent high quality updates, with clear explanations and charts.
Please like this post to support me.
- Trading Guru
--------------------------------------------------------------
Disclaimer!
This post does not provide financial advice. It is for educational purposes only!
DOT broke out of descending wedgePretty self-explanatory. First target is around 5.5 USD
I will look to take profits there and then see how it goes.

Gold Seems to be forming a descending triangle. Cautiously LongGold appears to be forming a descending triangle pattern as we look past end of September to mid-October. I'm a gold bull but this pattern has me cautious and so I am approaching the metal with 3 things in mind:
1. I will take a daily close below $1840 as a bearish sign with a downward target of $1767
2. A weekly close above $1860 towards US Election day would support the return of bullish sentiment
3. $2300 target before year-end

EURUSD video top-down AnalysisHello everyone, here is the top-down analysis for EURUSD, feel free to request any pair/instrument or ask any questions in the comment section below.
Best of luck!

XAUUSD - GOLD video top-down AnalysisHello everyone, here is the top-down analysis for GOLD, feel free to request any pair/instrument or ask any questions in the comment section below.
Best of luck!

OMGBTC is trying to break a daily resistance 🦐OMGBTC is trying to break a daily resistance after a huge imoulse.
The price bounce on 0.786 Fibonacci Level and it's inside a descending channel.
IF the price will break a daily resistance
According to Plancton's strategy, we can set a nice order
–––––
Follow the Shrimp 🦐
Keep in mind.
🟣 Purple structure -> Monthly structure.
🔴 Red structure -> Weekly structure.
🔵 Blue structure -> Daily structure.
🟡 Yellow structure -> 4h structure.
Here is the Plancton0618 technical analysis, please comment below if you have any question.
The ENTRY in the market will be taken only if the condition of Plancton0618 strategy will trigger.

J835 #SA #Banks index broke a descending triangle today.SA Banks going lower quite a bit in the near future becomes a greater possibility:
1. DOLLAR seems to make a short term correction so we might see a weaker RAND which in turn is not good for banks.
2. The recent bank results were not good regarding provisions.
3. And then obviously the descending triangle.
If the triangle plays out chances are good I will do a short term long-trade in either ABG or NED.

XLM - XLMBTC Descending Triangle Imminent Breakout [Daily]XLM - XLMBTC Descending Triangle Imminent Breakout On The Daily Time-Frame.


XRP Bullish Descending Broadening Wedges XRP is not my favorite project but my investments are diversified and I think XRP is a category in and of itself (I'm here for the tech and wealth). This is not financial advice, only my opinions based off my personal research.
Firstly I love Descending Broadening Wedges, they are very effective for calling bottoms, I have a chart where I called the absolute bottom of CRO which has been one of the top performers of 2020. I called CRO breaking out before it was announced as one of Teekas top 5 coins, and I did it with the pattern I am outlining now.
Now what I am seeing is a set of Descending Broadening Wedges, a smaller one within a larger one. I am also seeing our price action on top of a important support, which is between .17458-.16656 (.16656 being the .236 of a down fib I plotted and the area I would put my stop loss under). It is interesting that our 1D candles have closed above the top of this support of .17458 ,which shows to have been a strong support historically, because our indicators also look bouncy in this area.
The RSI hit 30.87 (Oversold),Our Stoch RSI has created a descending wedge and has flipped bullish to give us a hard buy signal today, MACD still shows selling pressure because it is reflecting the sell pressure we have already received (but I assume will flip soon).
From a bearish prospective our price action is trading bellow the EMAs and we have been in a down trend for years, but I have some interesting information that indicates the bottom could be in for XRP. First on June 13 2020 the Poloniex BTC/XRP chart hit one of the strongest historic XRP supports and wicked extremely hard upward. Second if we do bounce significantly from this area through the major resistances above (The EMAs and tops of the Descending Broadening Wedges) then we will probably rocket upward based off the TA projections (1st Target .25 area / 2nd Target .30 area/ 3rd Target .34763/ 4th Target .49342). Third many things are happening within the Ripple/XRP world, some things I cannot bring up (Political moves being made within banks/Gov to garner Ripple/XRP support) not to mention the COVID19 need for digital currency, and lastly China/USA competition to be the first to control the 4th industrial revolution (CBDC, Reserve Currency, etc.). *Side Note watch BoA :)*
(SHORT/ MEDIUM TERM) Oh yeah I really think institutions are looking for a back up plan, I think that they will use cryptocurrencies as a back up for when and if the stock market takes another drastic plunge. Meaning I could see institutions going deep into crypto and marketing cryptos on their platforms for retail traders and speculators to make Wall Street Money while stocks take a dive. Tons of money could flow into the crypto world, I don't see this as the endgame for XRP but I see it as the means to their end.

BajfinanceFalling wedge on 2hrs chart of bajfinance show reversal. Wedge breakout confirms the uptrend. Targets on chart

USDCAD: Future possibilitiesUSDCAD is consolidating in it's current position. Some interesting things to keep an eye on: The trend has technically broken through the overall descending (purple) trend line. Typically this is a bullish move, but we must first establish a higher high. If we maintain the 1.35 support but continue to get lower highs, we'll likely see another move like the last descending triangle as shown in yellow. If the price establishes a higher high, this could confirm trend reversal.

FURTHER DECLINE ON BITCOIN!!?Bitcoin continues to resist Bullish actions. Price rejected my 1HR Descending Channel Resistance Line & is currently testing a keyzone. I expect for prices decline.

AUDJPY for a quick 30 PIP drop into Frankfurt and London Descending wedge for 30 pip set SL at either daily risk or a few pips above the downward trendline.
