Disney: Bullish Consolidation Analysis 1H (Apr. 21)X FORCE GLOBAL ANALYSIS:
In this analysis, we explore the bullish probabilities for Disney's case (DIS) based on its bullish consolidating technicals and strong fundamentals.
Technicals
- We see a textbook ascending triangle pattern, which is a bullish consolidation pattern
- An ascending triangle pattern in a downtrend signals a potential bullish trend reversal
- We can count Elliott Triangle Waves (ABCDE), and see that wave E has completed forming as well
- The Relative Strength Index (RSI) shows great strength on the daily, creating higher lows and higher highs
- The Moving Average Convergence Divergence (MACD) also shows increasing bullish histograms on the daily as a sign of momentum
Fundamentals
- When Disney is not aggressively investing into its direct-to-consumer business, it has generated close to $8 billion of free cash flows.
- Disney's balance sheet is strong and affords Disney plenty of flexibility
- With that said, half of Disney’s operating income is generated from its Parks, Experiences and Products segment
- Considering the Parks closed so far and the potential closure of others will have a substantial effect on Disney’s near-term overall profitability
- However, Disney's fundamentals remain exceptionally strong, and the long term picture still remains intact
What We Believe
We believe that Disney is an impressive business, with broad diversification, expected to grow consistently over the medium-term. While this company was hit by the Corona Virus (COVID-19) more severely so than other companies, technicals demonstrate potentiality for a breakout, leading to a small bullish rally.
Trade Safe.
DIS

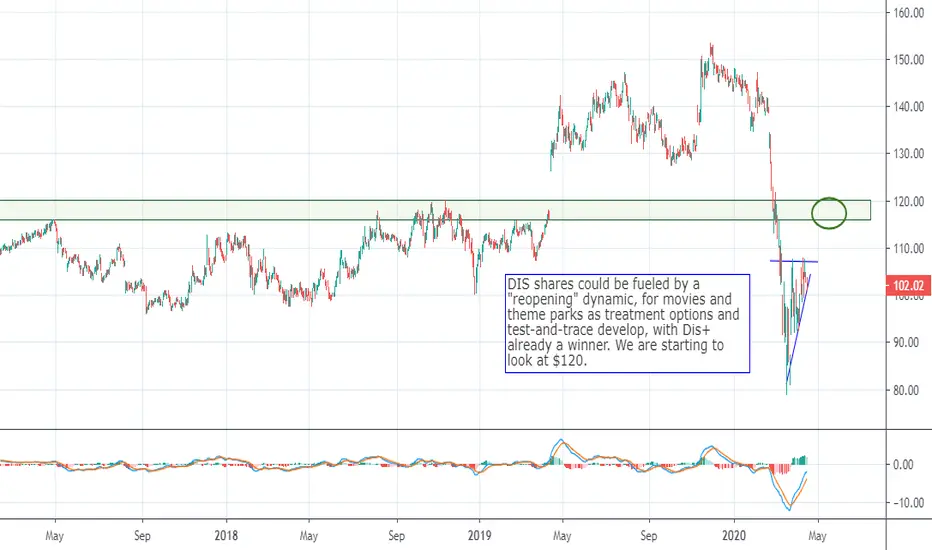
$DIS Could be Shaping Up to Extend the BounceDIS shares could be fueled by a "reopening" dynamic, for movies and theme parks as treatment options and test-and-trace develop, with Dis+ already a winner.
We are starting to look at $120.
Walt Disney Company (DIS) - Opportunity to SELLHey everyone, here's the analysis on DIS. Hit the LIKE button, follow us & leave a comment on ideas you would like to see next!
Summary:
Current price could drop from our R1 zone to our S1 zone, presenting us with a good opportunity to sell.
Action:
Sell Limit: 109.65 - 112.00
Stop Loss: 123.00
Take Profit: 96.40
Analysis:
On the monthly chart, R1 zone was a key breakout zone along with a strong fibonacci confluence and a pullback of our trend line. There is limited upside in the current price and it could drop to our S1 zone, as illustrated by the yellow dotted lines. If the S1 zone does not hold, we could see price drop lower to our S2 zone before a bounce there.
Disclaimer: There is a very high degree of risk involved in trading and investing. Past results are not indicative of future returns. Trading BEAN and all individuals affiliated with this site assume no responsibilities for your trading and investment results. All contents featured here are solely for educational purposes and ARE NOT investment or trading advices. Please do your own due diligence and trade at your own risk.

If you a 5/15 Put on DIS @$90NYSE:DIS Price would have to stay below projected RED line. Theta (Time Decay) will especially erode contract in the last 11 trading days. 23.8% success. Would not advise naked put, but vertical spread.


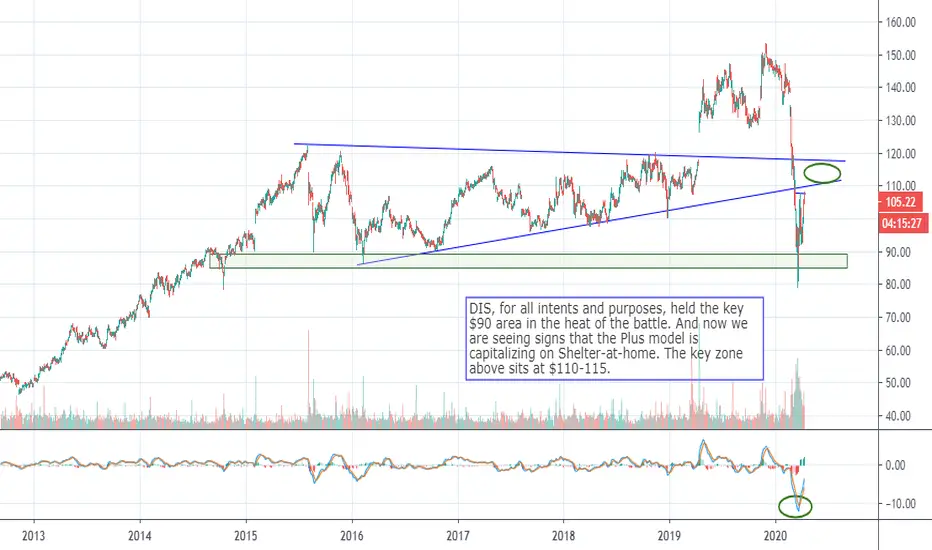
$DIS Approached Key Test After Hot Plus UpdateDIS , for all intents and purposes, held the key $90 area in the heat of the battle. And now we are seeing signs that the Plus model is capitalizing on Shelter-at-home. The key zone above sits at $110-115.
DIS update Watched at open the price dip into demand and entered a long position. Took half of my positions off when it came up to a small supply and to lock in profits. Still looking for a longer term target price of 110.
Looking at after hours, glad I kept some of my position on! Will have to see if it holds. If it does, will be hitting my price target of 110 a lot quicker than anticipated!

DISIf DIS holds the 97.50 demand area, I’m entering some long positions with a target of 110. It has tested the above supply few times now and I think it has a good chance of buyers overcoming sellers on the next attempt.
As always, going to watch how price acts and ideally would like price to dip into the demand zone to grab some more buyers.

Disney Under 100 - Corona Virus Won't Kill Star Wars Disney PlusThe parks are closed and ESPN is running Rudy over and over again as most Major League sports are on hiatus .
People instead of looking for a pure cruise play rebound Like $RCL should probably gobble up the opportunity to own $DIS sub 100.
Disney has a more diversified business and assets here is a list .
#DisneyPlus and Marvel assets alone make $DIS very compelling here.
In short the Corona Virus wont kill Star Wars
en.wikipedia.org


DIS / Setup ReadyWave 5 confirmed (beware that we could still be within the B leg of a triangle 4 - which wouldn't change your plan much if your are already in).


"Disney: top and bottom analysis" by ThinkingAntsOkWeekly Vision:
- Price broke the Ascending Trendline.
- Price bounced on the Support Zone and made a pullback to the TL.
- Now, it has potential to move down towards the next Support Zones.
Daily Vision:
4H Vision:
Updates coming soon!

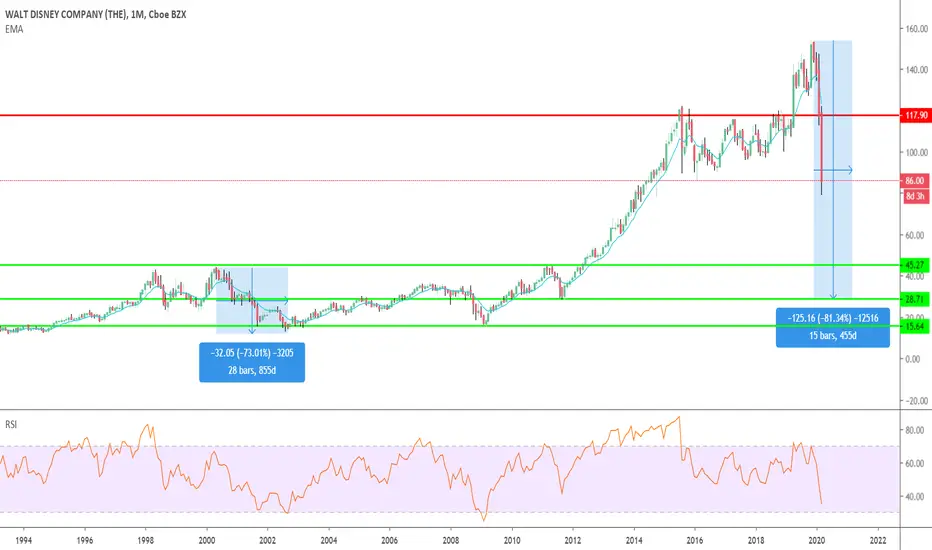
Dis - Looking for Disney to repeat the 2000-2003 crashHello everyone, as we can see, 2000 - 2003 crash was around 70%, this crash is the biggest one in many many years, so we are expecting a bigger drop to around 30$. Right now we will see some rebound, but untill 2021 March - May, I am bearish.
$DIS True Bullish Divergence (?)We can see on Disney monthly chart that as the price returning at the level of 85$ in the Rsi chart the line is going down and down. So as it appears we might see a true bullish divergence. In addition that $85 level is a strong support zone and the volume in the last candle was very strong i think that the trend might changes and reverses from that point.
(But is also the coronovirus matter in the other hand so..)


wait for the scripts sell signal and ride DIS downscripts have been flagging downside for a while, after 1 glorious long call in 1999 is it time for Disney to topple over and drop 100?
both scripts are preparing sells, to make use of these calls see tradingscripts.best

$700 in 15mins on SPY and DISNice comeback from yesterday's carnage. Going to be more conservative throughout the rest of the day.

"Disney: two possible scenarios" by ThinkingAntsOk4H Chart Explanation:
- Price is on the Ascending Trendline.
- Two possible paths from here: a) breakout and continue the down move. b) up move towards the All Time Highs.
- Wait for a confirmation that indicates which of the two scenarios is the correct.
Weekly Vision:
Daily Vision:
Updates coming soon!

WALT DISNEY COMPANY (DIS) WeeklyDates in the future with the highest probability for price direction reversals

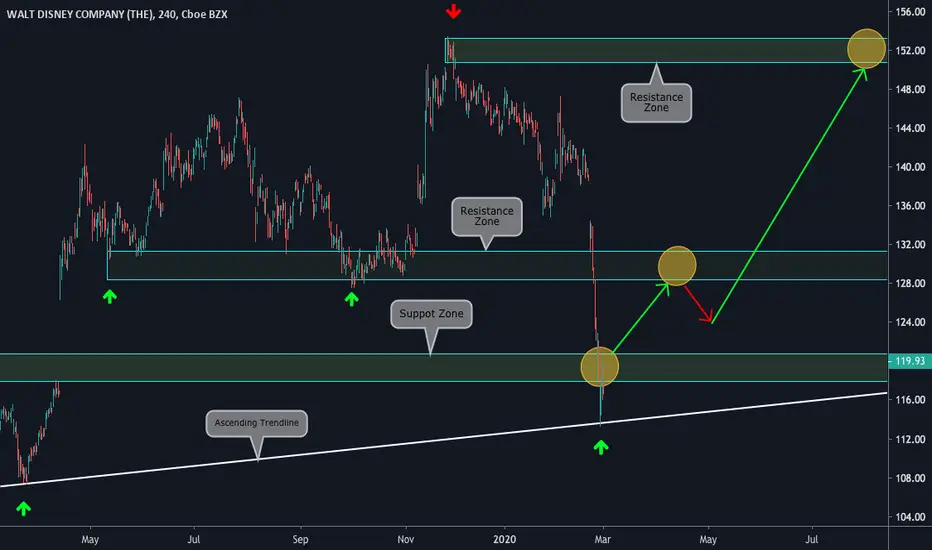
"Disney: Top and Bottom Analysis" by ThinkingAntsOk4H Chart Explanation:
- Price is on an important Support Zone + Weekly Ascending Trendline.
- Expect price to bounce from here towards the next Resistance Zone.
- If price breaks it, potential to move up towards the All-Time Highs Resistance Zone.
Weekly Vision:
Daily Vision:
Updates coming soon!