Played exactly the same as predicted last week. KSE100 Closed at 114113.94 (02-05-2025)
Played exactly the same as predicted last week.
Now seems like Hidden Bullish Divergence is appearing.
Important Supports :
S1 around 113100 - 113400
S2 around 110500 - 110800
Important Resistances :
R1 around 114630 - 115120
R2 around 117000 - 117500
Divergence


BTC Potential Breakout, Daily DivergenceBTC on the daily has the opportunity to expand way upwards over the next month - a divergence on the daily evidently takes longer to play out but RSI could easily reach 80 off the back of the structure.
I have been shorting, confidently, for a good few weeks now, with longs in between, but I'm starting to feel like I should flip long.
Solana is also trying to reclaim the daily/weekly range - things to think about for sure.
Good luck out there!

Bearish Divergence has appeared.Bearish Divergence has appeared.
Immediate Support lies around
203 - 208
Next Support lies around 178 - 188
Bullish Momentum will resume once
it will cross 222.


MARA...Poised to turn ??MARA Holdings, Inc. is a digital asset technology company, which engages in mining cryptocurrencies with a focus on the Bitcoin ecosystem.
They have a current P/E of 8.18 and a slightly positive seasonal rating.
Generally there is a fairly good correlation with BTC.
Technically I see several patterns at present:
1. A Bullish Wolfe Wave
2. A Complete ABCD pattern
3. A Longer term Harmonic Bullish Crab pattern.
4. Positive RSI divergence appears to be present,
I point this out being fully aware of the present chaos the market is in.
Specifically :
1. With a Tariff Policy probably formulated from a CHATGPT search by a DOGE junior staffer.
2. Where s 401(K)s risks becoming a 201(K)s.
3. Where the Waffle House appears not to care and but can shift and change policy at any point.
4. Analysts estimated are positive (insert)
That said and with a stronger BTC and a generally positive market shift, I believe MARA will participate.
Note: There is a longer term crab pattern in play which suggests we may bottom out around the $7 area.
We need clarification and a reversal of currently ill advised and destructive tariff policy.
I will entertain a long position if we close above the $11.60 area with volume, a stronger BTC a positive market outlook and tariff nullification.
My Targets are marked. Analysts targets ate an insert.
Q4 and Full year earnings are set for early May. Q3 exceeded expectations
This is not Investment advice. Do your own due diligence.
S.

After Making HH, now towards HL.
After Making HH, now towards HL.
Bearish Divergence is there, so dragging
the price down.
115 - 118 can be a Good Support level.
Couple of Green candles may confirm HL
at this area.
However, if 110 is broken, we may
witness further Selling pressure.

Crypto Bulls Awaken – Is This Just the Beginning?In the past 48 hours, the crypto market has brought joy to traders and investors who managed to buy near the bottom.
(Sorry to the cryptobros still holding floating losses—your time will come too! 😊)
Some of you might be thinking it's too late to ride this bull run. But if you zoom out and look at the bigger picture, there's still plenty of room for the bull to run.
Just switch to a higher timeframe like the weekly or monthly chart, and you'll see the potential upside.
One coin that looks particularly interesting is BINANCE:SUIUSDT .
There's been a pullback from 2.1829 - 1.7997, and it's supported by bullish divergence, suggesting a continuation of the impulsive move with 7.6108 as the first major target.
This bullish scenario remains valid as long as the price holds above 1.7174.
You might be wondering,
" So can I just buy/long BINANCE:SUIUSDT now? "
Not yet.
For a better entry and a more favorable risk-reward ratio, I suggest using the daily chart.
Wait for a pullback, then look for confirmation using candlestick patterns.
(I'll cover those patterns in my next post—stay tuned!)

Currently at a Very Strong Support.Currently at a Very Strong Support.
Bullish Divergence has appeared.
Crossing 136 may lead it towards 140 & then 148 - 149
initially.
On the flip side, it should not break 114.50 now.
Otherwise, we may witness further Selling Pressure
towards 88 - 90.

Bearish Divergence has started appearing
Bearish Divergence has started appearing
on Bigger Tf.
Channel Top is also there.
Stay Cautious.
Sudden Spike can be witnessed till 1450 - 1500
but that would be a Risky Trade to take.
So Better to wait till the Bearish Divergence
plays & bring the price down & settle (may be)
around 1000 - 1050

Nifty Closes 1000 Points Higher – Will It Catch Up with BNFIn a strong move, Nifty 50 surged by 1000 points to close at 23,851, compared to last week’s close. The index made a weekly high of 23,872 and a low of 23,207. As highlighted in last week's analysis, a breakout above 23,400 could push Nifty toward 23,900 — a target it missed by just 23 points.
However, an intriguing divergence has emerged between Nifty and Bank Nifty. While Bank Nifty has scaled a new all-time high, Nifty still trades significantly below its previous all-time high of 26,277. This sets the stage for an interesting dynamic: Will Nifty rally to close the gap, or will Bank Nifty face a correction?
What to Expect Next Week?
For the upcoming week, Nifty is expected to trade in a range between 23,200 and 24,414. Despite the bullish signals on the daily and weekly timeframes, the monthly chart remains weak, indicating that volatility is likely to persist until a broader trend confirmation.
S&P 500 Outlook: Bounce or Breakdown?
The S&P 500 index saw a mild pullback, closing around 80 points lower from the previous week’s close of 5,363. Our “sell on rise” strategy mentioned last week worked well, as the index dipped post-rally.
Now, things get technically interesting. On the weekly chart, the S&P 500 is forming a potential bullish W pattern and an inside bar. A breakout above the previous week's high of 5,481 could trigger upward targets of 5,551, 5,637, and 5,679.
However, on the downside, a break below 5,115 would reintroduce bearish pressure, which could have negative ripple effects across global markets.
Key Market Takeaways:
Nifty 50: Strong rally, but still below ATH. Watch 23,200–24,414 range next week.
Bank Nifty: At ATH, diverging from Nifty – crucial to monitor.
S&P 500: At a technical crossroads – potential for breakout or breakdown

No Bearish Divergence yet on Shorter TF.
No Bearish Divergence yet on Shorter TF.
Good Support is around 465 - 467.
However, Crossing 520 with Good Volumes
may lead it towards 600+
Even In worst case, it should not break 400.

No Bearish Divergence on Monthly Tf.No Bearish Divergence on Monthly Tf.
But 39-40 is a Very Strong Resistance
that needs to Cross & Sustain with Good Volumes to
reach 45 - 46 & then 50+
We should not ignore that it has taken Support
from a Very Important Fib level around 32.40
Monthly Closing above 33.60 would be a Very Healthy sign.
So any dip towards 32.50 - 33.50 can be a Buying Opportunity.
However, it should not break 31.80 otherwise we
may witness further Selling Pressure towards 28.50 - 28.70

Short Idea on Silver (XAGUSD)Based On :
- 1h Supply covered by weekly
- POIV divergence
- IQMS Extremes about to flip

Bearish Divergence on Weekly TF.Bearish Divergence on Weekly TF.
Resistance lies around 225 - 235
Currently moving in a Rectangular Channel.
Crossing 222 - 223 will trigger more positivity
towards 235 - 240 initially and then around 250-260.

How Momentum Divergence Reveals Hidden Market Strength and WeaknMost traders watch price action closely: candlesticks, moving averages, trendlines. But there’s a deeper, less obvious layer of information that often signals shifts in direction before price confirms it: momentum.
📌 Quick overview – what you'll learn:
What momentum divergence is (clearly explained)
How it helps predict potential trend shifts
Practical ways to spot and trade divergences
📈 Price vs Momentum: They're Not the Same!
Momentum doesn't simply track price direction. Instead, it measures the strength behind price movements.
Rising prices, falling momentum often signals upcoming bearish reversals.
Falling prices, rising momentum often hints at bullish reversals building beneath the surface.
These subtle divergences are powerful because they reveal hidden market shifts before everyone else notices them.
⚠️ How to Spot Momentum Divergence (Simple Steps):
Step-by-step:
- Find clear price swings:
Clearly defined highs/lows on your chart.
- Check momentum indicators (RSI, MACD, CCI, etc.):
Does the indicator agree or disagree with the price action?
- Spot divergence:
Bullish divergence: Price makes lower lows, indicator shows higher lows.
Bearish divergence: Price makes higher highs, indicator shows lower highs.
- Confirmation:
Always wait for price confirmation like a reversal candle or break of a trendline.
🔥 Why Momentum Divergence Works:
Divergence highlights hidden accumulation or distribution by smart money.
Helps you anticipate reversals before price confirms.
Filters out weak moves and helps you avoid fake breakouts.
📊 Real Example (XAUUSD – April 2025):
Recently in Gold:
Price was dropping steadily, reaching new lows.
Meanwhile, RSI showed clear higher lows – classic bullish divergence.
Result: Price exploded significantly shortly after momentum divergence appeared clearly.
🧠 Trading Tips to Remember:
Divergence signals are stronger near key support/resistance zones.
Use momentum divergence with your existing strategy for confirmation, not isolation.
Always define your risk clearly (set stops above/below recent highs/lows).
🚩 Common Pitfalls to Avoid:
Trading divergence without confirmation: always wait for the market to show its hand.
Ignoring the bigger picture: check higher timeframes for stronger signals.
Overtrading: not every divergence leads to a reversal; quality beats quantity.
🚀 Your Action Plan for Next Week:
Pick one momentum indicator and identify at least 3 divergences on your favorite assets.
Monitor how they play out.
Note down what works best in your trading journal.
💬 Question for you:
What’s your go-to momentum indicator when spotting divergence? RSI, MACD, CCI, or something else? Drop a comment below!
Happy trading!
TrendGo Team

LONG ON GOLD (XAU/USD) GOLD Has given a nice pullback to a supply area and has also given us bullish divergence.
I will be buying gold looking to make over 1000 pips.


LIMIT ORDER - #EOS/USDTLIMIT ORDER - $EOS/USDT
Direction: #Short 🔴
Entry Price: 0.766
Stop Loss: 0.85406
Target 1: 0.70734
Target 2: 0.64868
Target 3: 0.59002
Target 4: 0.53137
Target 5: 0.47271

Buy idea on NZDJPYBased On :
- Cycle analysis and quantitative data
- Poiv divergence on 4H
- Demand zone created by engulfing candle
-All cot operators are in the 156 extremes giving strong buy signal and open interest as well

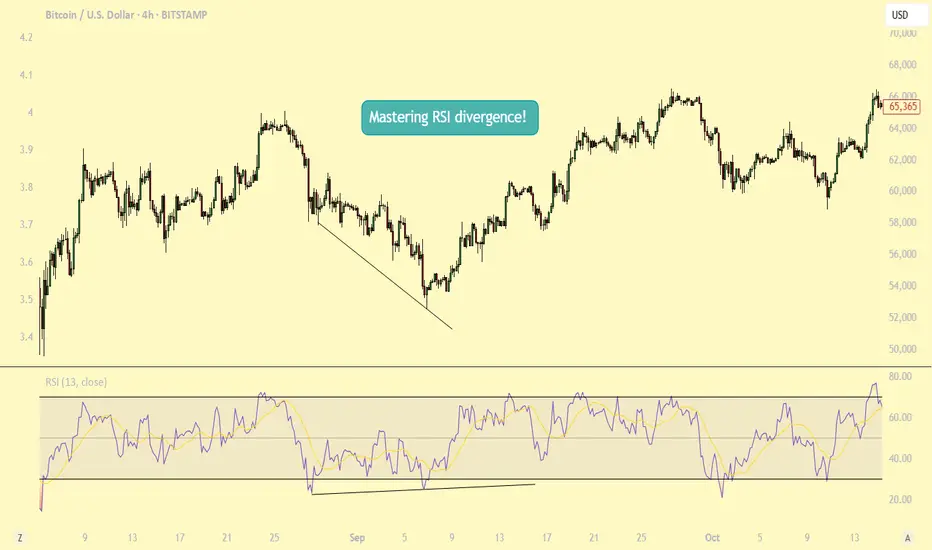
Mastering RSI Divergence: A Complete Guide to Trend ReversalsWhat Are Divergences?
In this guide, we will explore the concept of divergence and how it can be effectively utilized alongside the Relative Strength Index (RSI), one of the most popular momentum indicators in technical analysis. Divergence occurs when the price of an asset moves in the opposite direction of an indicator, such as the RSI. Understanding RSI divergence can be a powerful tool for identifying potential trend reversals or continuations. In this guide, we'll delve into the various types of divergence that can occur with the RSI and how to incorporate them into your trading strategy.
Types of Divergences?
There are three primary types of divergence: bullish, bearish, and hidden divergence. Each signals a distinct market condition and potential outcome, and understanding these nuances is key to using divergence effectively in your trading.
1. Bullish Divergence Bullish divergence happens when the price of an asset makes a lower low, while the RSI forms a higher low. This indicates that although the price is declining, momentum is weakening. The failure of the RSI to confirm the new low in price suggests that selling pressure is diminishing, potentially signaling that a reversal to the upside could occur. Essentially, the market is losing its downward momentum, setting the stage for a potential bullish move.
2. Bearish Divergence Bearish divergence occurs when the price forms a higher high, but the RSI forms a lower high. This indicates that although the price is rising, momentum is weakening. It suggests that the uptrend may be losing steam, signaling that a potential reversal to the downside could be on the horizon. As the price continues higher, but the RSI fails to confirm the new highs, it may indicate that the market is becoming overextended and ready for a correction.
3. Hidden Divergence Hidden divergence differs from regular divergence in that it signals a continuation of the existing trend, rather than a reversal. It typically occurs during pullbacks or retracements in a strong trend. Hidden divergence can appear in both uptrends and downtrends, providing traders with an indication that the prevailing trend is likely to continue after the short-term retracement is over. This type of divergence serves as a confirmation of trend strength and helps traders stay in profitable positions during market pullbacks.
Why Are RSI Divergences a Powerful Tool?
RSI divergence is a powerful tool in trading because it offers early insights into potential trend reversals or shifts in momentum before these changes are fully reflected in price movements. By recognizing divergence, traders can anticipate shifts in market sentiment and make timely decisions. One of the main reasons RSI divergence is so effective is that it serves as an early warning system. It signals when the momentum behind a price trend, whether up or down, is starting to weaken.
For example, in a strong uptrend, if prices continue to make new highs, but the RSI fails to reach new highs, this could signal that the buying momentum is losing strength, even though the price is still rising. This divergence indicates that a reversal or pullback might be imminent, allowing traders to exit their positions or prepare for a potential shift in market direction. Understanding this early warning can provide traders with an edge, helping them avoid being caught in the late stages of a trend and positioning themselves ahead of a change.
How to Trade RSI Divergences?
When the price makes a higher high but the RSI fails to confirm with a higher high, this is known as bearish divergence. While this situation suggests weakening momentum, it doesn’t necessarily mean a correction is imminent. The price may continue to rise for some time, and eventually, the RSI could catch up and make a higher high in line with the price action. Essentially, the market could remain in an uptrend, and the RSI could still align with the price over time.
This highlights the importance of not jumping to conclusions solely based on RSI divergence. Divergence can act as a useful warning, but it should not be relied upon as a definitive signal of a trend reversal. To increase the reliability of the signal, traders should wait for additional confirmation, such as a candlestick pattern indicating a potential trend reversal. Candlestick patterns like engulfing patterns, doji candles, or shooting stars at key support or resistance levels can provide stronger evidence that the trend may be about to change.
Therefore, it’s wise to wait for a more comprehensive confirmation from price action before making a move, rather than acting on divergence alone. Combining RSI divergence with other technical tools, such as candlestick patterns or chart patterns, can help increase the accuracy of your trade decisions.
Conclusion:
Divergence is a powerful tool that provides valuable insights into potential trend reversals or continuations. By understanding the different types of divergence and knowing how to identify them, traders can make more informed decisions. However, divergence should always be used in conjunction with other technical analysis tools to enhance the accuracy of your strategy. With practice, patience, and proper risk management, divergence trading can become a profitable strategy for identifying key market turning points. Whether you are seeking trend reversals or confirming ongoing trends, RSI divergence can be an essential component of your trading toolkit.
Thanks for your support.
- Make sure to follow me so you don't miss out on the next analysis!
- Drop a like and leave a comment!
Buy idea on AMAZON (AMZN)Based On :
- Presidential cycle and quinquennial cycle
- quantitative data
- strong demand zone covered by weekly and 2w as well
- divergence on Poiv (open interest from Nq) and Progo
- Undervalued conditions on weekly timeframe

GOLD - Day Trading with RSI 04/02/2025
Weekly and Daily Timeframes (W & D):
GOLD is still in an uptrend, as the RSI's WMA45 is still hovering near the 70 level, and RSI remains above both of its moving averages.
H4 Timeframe:
This timeframe is currently showing a correction. However, it's not yet considered a downtrend because the WMA45 is still in the high region, close to the 70 level. But, RSI has dropped below the WMA45.
At present, the RSI on H4 is facing dynamic resistance from the WMA45 above and has support around the 4x level (43-48). The corresponding temporary price levels are approximately 3128 (resistance) and 3088 (support).
This end-of-uptrend correction on H4 could lead to high price volatility. GOLD may move within a 300–400 pip range (between the resistance from WMA45 and the RSI support around the 4x zone).
H1 Timeframe:
Currently in a downtrend, as RSI is moving below both of its MAs, and the WMA45 has a noticeable downward slope.
H1 also has RSI support at the 30 level (temporary price ~3086) and resistance at WMA45 above (temporary price ~3130).
Since we’re focusing on intraday trading, priority is given to the H1 trend.
Figure 1
Trading Plan: SELL
Entry Zone:
When RSI on M15 approaches upper resistance: levels 50–55 or 65–70.
Confirm Entry:
Conservative/Safe approach: when M5 ends its uptrend and reverses (see example in Figure 1 – M5 ends uptrend when RSI crosses below both MAs).
Or when bearish divergence appears on M5.
Or even earlier, when there’s divergence on M1 and M5's WMA45 flattens out.
Stoploss:
20–30 pips above M5’s recent peak.
Or if RSI on M5/M15 breaks through its previous high.
Take Profit:
100 pips or R:R >= 1:1.
Or when M5’s downtrend ends (when RSI crosses above both MAs).
You can check out the indicators I use here: www.tradingview.com
