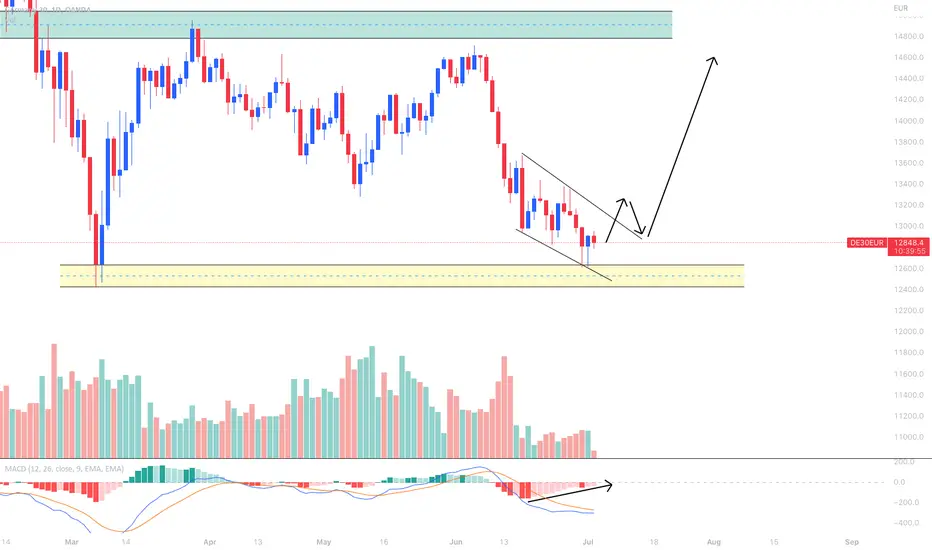
Swing Trading Setup For The DAX 30 – Falling Wedge PatternHi Traders,
Having a look at the DAX30 on the Daily.
We see a potential falling wedge with accompanied divergence across the MACD.
I would like to see a break and retest of this pattern before jumping in.
This is the daily time frame so this would be quite a long swing position.
It's all about patience haha.
Let's see how it plays out.
My target would be previous daily resistance.
Enjoy your Monday!
The Vortex Trader
Divergence
YGG can complete its divergence with another drop to 0.6257Now YGG has a divergence trend and it can make it very deep by another drop to 0.626 and then start a rally trend

21% profit from Sand divergenceSand is in the triangle. it came to its downside with very clearly divergence. Then it went up to its upside of triangle !

The end of the line for now?Bearish divergence, break of parabolic trend on DXY, retested and rejected for now

⚡️ #ATOM/USDT - Potential 200% ⚡️⚡️ #ATOM/USDT - Potential 200% ⚡️
Entry Conditions:
- Double Bullish Divergence
- Flipped Trendline
- Awaiting Pullback To Trendline For Entry
Entry: 5.578 - 7.11
TP1: 8.7
TP2: 12.23
TP3: 17.62
SL: 4.37 or HOLD

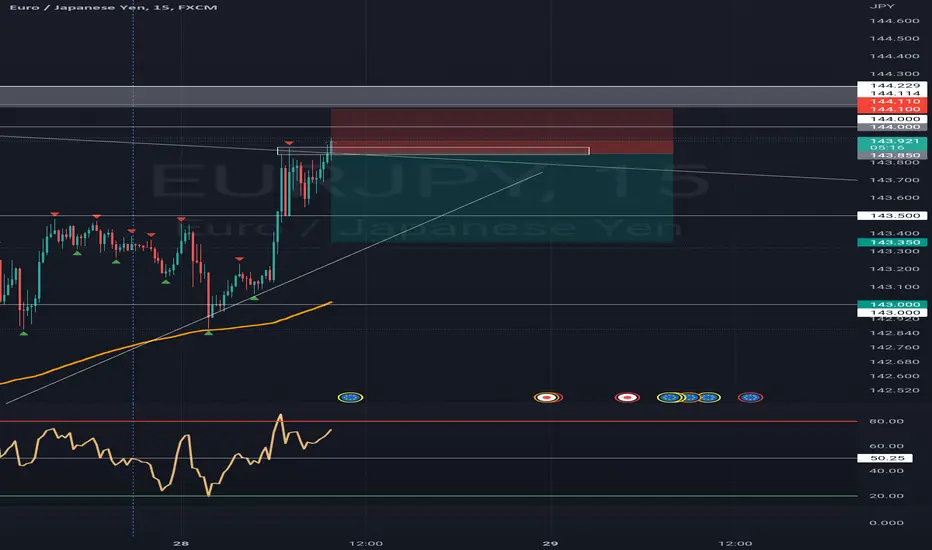
EURJPY short144.110-144.220 are strong resistance levels, those levels even seem pegged if you check H4 properly but let's not dwell on that.
Reasons for this short idea:
1. Divergence from the action of price
2. Price almost at a psychological level
3. EUR fundamentals (news release) are poor as at Frankfurt session
4. RSI at overbought levels
Enter this position with proper risk & money management and do not over leverage your account !.
Bitcoin Future PredictionBINANCE:BTCUSD
Three Bearish Divergence will lead BTC to under 10K
2022 will be the bear market
2023 can see a uptrend
2024 pullback
2025 will be the Bull Run where BTC will cross ATH
2026 200K - 300K

How to Trade Bullish DivergenceAt some point in your trading career, you will hear the term "Divergence Trading". Divergence simply means when the price and indicator are telling the trader two different things. It can be an effective addition to your trading strategy, especially if already using indicators like RSI or MACD to find overbought and oversold levels but should not be replied on by itself and requires practice to get it right.
There are two types of Divergence you want to be familiar with: Regular bullish and bearish divergence and Hidden bullish and bearish divergence. In this educational tutorial, I will cover Bullish Divergence. You should note that the appearance of divergence doesn't happen 100% of the time, but when it does, you can use it for additional confluence (extra confirmation) for entering trades.
Bullish Divergence Overview:
A bullish divergence occurs when prices fall to a new low while an oscillator fails to reach a new low. This situation demonstrates that bears are losing power, and that bulls are ready to control the market again—often a bullish divergence marks the end of a downtrend. Notice in this example of GBPCAD, the price was in a downtrend and eventually came to a low at 5494 and rejected the area. The price shows a decline, while the RSI shows the oscillator moving higher. This is an example of regular bullish divergence, as it signaled a potential trend reversal.
How to Draw Bullish Divergence
You want to draw lines on successive tops and bottoms. Connect the tops and bottoms only, and keep your eyes on the price. If you draw a line connecting two lows on price, you MUST draw a line connecting two lows on the indicator. They have to match! Divergence only exists if the SLOPE of the line connecting the indicator tops/bottoms DIFFERS from the SLOPE of the line connecting the price tops/bottoms.
Popular Indicators to Use When Identifying Divergence
You can use indicators such as RSI, MACD, CCI, or Stochastic to trade divergence. Your selection in one of these indicators will depend on personal preference. I personally prefer the RSI at a 7 period.
If you spot divergence but the price has already reversed and moved in one direction for some time, the divergence should be considered played out.
You missed the boat this time. All you can do now is wait for another swing high/low to form and start your divergence search over.
What is your favorite way to trade Divergence? Let me know in the comments!
Happy Trading! :) - Brian & Kenya, BK FOREX ACADEMY

USD JPY DivergenceHourly Chart
MACD on 0
RSI Momentum is showing Divergence
Fib Level Targets 1 and Resistant at 135.8

Nasdaq 100 reclaims its May lows with positive moment divergenceThe Nasdaq 100 is one of many examples this week that saw a surge back over its May lows, with positive momentum divergence.
We're still in a primary downtrend, so nothing has changed from that perspective, however, with overall market sentiment in the dumps, squeezes like this can be quite extreme.

Hermes International LongHermes, showing bullish divergence on RSI. Has put in a double bottom and bounced off a trendline that's been in place since 2018. Tight stop at 1032 making for nice risk to reward with first TP at 1295 and second at 1550.


cadchf long term + technical analysicscadchf long term + technical analysics
supply and demand
wychoff
2 divergence
elliotwave
all are involve.

⚡️ #XRP/USDT - Potential 550% ⚡️⚡️ #XRP/USDT - Potential 550% ⚡️
Entry Conditions:-
-Bullish Divergence
-Ripple Decision Imminent
-Trendline Breakout
-Flipping LongTerm Resistance
NewSource:-
(u.today)
Entry: 0.2463 - 0.3880
TP1: 0.5545
TP2: 0.8559
TP3: 1.2469
YOLO: 1.6434
SL: 0.1626 or HOLD

eurusd long tern + entry pointeurusd long tern + entry point
elliot wave analysics
supplyand demand
wychoff
all are involve

Ethereum ETHUSDT - Millennium Elliott Wave + 200 weekly MA!- As per my Elliott Wave analysis on the weekly scale, we have 2 impuls waves successfully completed and now we are missing the final impulse wave!
- ABC correction (Wave 4) can be done, because wave 4 should not overlap the first wave.
- 200 weekly moving average is currently acting as a very strong support!
- Also the price is currently sitting on 0.786 fibonacci retracement.
- If you take a look at RSI indicator, you can spot a bearish divergence from previous waves, which helps us to identify the Elliott wave structure.
- Looks like the bear market can be over and we are ready for another massive bull market!
- Check my related analysis for Bitcoin down below!
