Let's learn about flats.good evening,
in preparation for my next few bear posts,
i'd like to talk about the three different types of flats in the markets.
the main reason why i'm bringing this up right now,
is because the USA Indexes are displaying all three of these patterns currently,
so it's important to familiarize yourself with these fractals, for future references.
feel free to share this with your peoples if you find it helpful.
---
regular flats :
• A corrective 3 waves move labelled as ABC
• Subdivision of wave A and B is in 3 waves
• Subdivision of wave C is in 5 waves impulse / diagonal
• Subdivision of wave A and B can be in any corrective 3 waves structure including zigzag, flat, double three, triple three
• Wave B terminates near the start of wave A
• Wave C generally terminates slightly beyond the end of wave A
• Wave C needs to have momentum divergence
Fibonacci Ratio Relationship
• Wave B = 90% of wave A
• Wave C = 61.8%, 100%, or 123.6% of wave AB
---
expanded flats
• A corrective 3 waves move labelled as ABC
• Subdivision of wave A and B is in 3 waves
• Subdivision of wave C is in 5 waves impulse / diagonal
• Subdivision of wave A and B can be in any corrective 3 waves structure including zigzag, flat, double three, triple three
• Wave B of the 3-3-5 pattern terminates beyond the starting level of wave A
• Wave C ends substantially beyond the ending level of wave A
• Wave C needs to have momentum divergence
Fibonacci Ratio Relationship
• Wave B = 123.6% of wave A
• Wave C = 123.6% – 161.8% of wave AB
---
running flats
• A corrective 3 waves move labelled as ABC
• Subdivision of wave A and B is in 3 waves
• Subdivision of wave C is in 5 waves impulse / diagonal
• Subdivision of wave A and B can be in any corrective 3 waves structure including zigzag, flat, double three, triple three
• Wave B of the 3-3-5 pattern terminates substantially beyond the starting level of wave A as in an expanded flat
• Wave C fails travel the full distance, falling short of the level where wave A ended
• Wave C needs to have momentum divergence
Fibonacci Ratio Relationship
• Wave B = 123.6% of wave A
• Wave C = 61.8% – 100% of wave AB
---
-- full credit to elliottwaveforecast for all of these guidelines
DJI

Dow Jones Bear Case.gm,
---
The highest request over the last few weeks = "elo, what's your bear case on the stonk market?".
Well, you guys asked for it...
So I'm here to give you just that.
A face ripping,
soul crushing,
heart wrenching dip;
which takes the average american's 401k,
and turns it into a 201k.
---
Tuesday November 29th 2022 ~ December 21st 2022 = my calculated top.
Estimated to sit between 34,329 ~ 36,697.
.
---
Friday May 12th 2023 ~ Tuesday October 24th = my calculated bottom.
Estimated to sit between 27,317 ~ 23,620
.
---
🔺
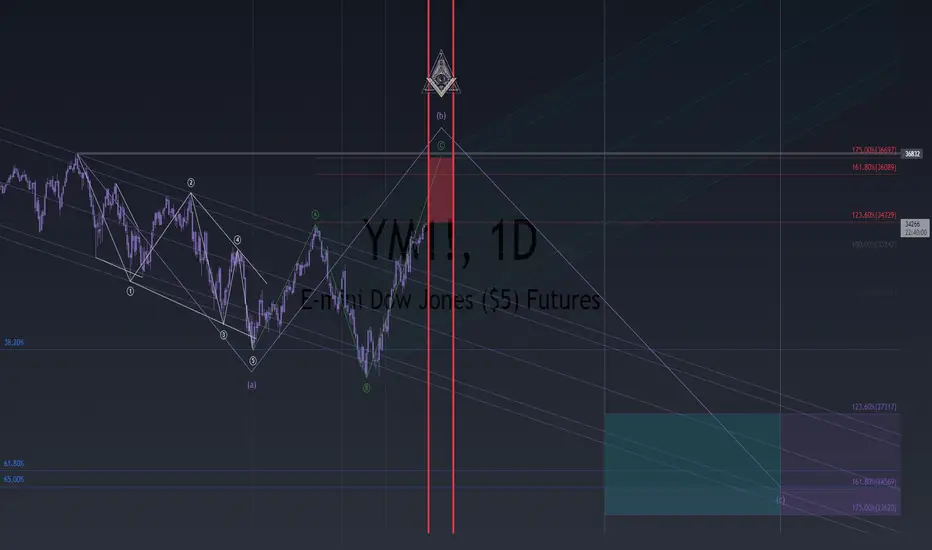
Dow Jones likely putting in a top. 14% downside to followConfluence of many resistances putting in a likely top in Dow Jones as seen in the chart Invalidation of this move would be price action confirmation above 34300 level.

DJI SENDS CLEAR BULLISH SIGNALS|LONG
Hello, Friends!
A recent breakout signals
That the bulls are still strong
And I am growing in confidence
That a bullish surge is coming!
BUY!
✅LIKE AND COMMENT MY IDEAS✅

$GS Classical GartleyX = 2022 High
A = 2022 Low
B = .618 XA
C = .886 XA
D = .786 XA
Price Targets
B: $361.16 (Conservative)
C: $287.36 (Moderate)
Aggressive: $250 - $275

DJI Potential for Bullish Continuation The overall bias for DJI is bullish on the H4 chart. Additionally, the price is above the Ichimoku cloud, demonstrating a bullish market. Looking for an immediate buy entry at swing high 34106. 01 for this trade. At the previous swing low of 33063.05, where my relative safe stop loss is located, The previous swing high, or 35492.22, will serve as the take-profit point.
Please be advised that the information presented on TradingView is provided to Vantage (‘Vantage Global Limited’, ‘we’) by a third-party provider (‘Everest Fortune Group’). Please be reminded that you are solely responsible for the trading decisions on your account. There is a very high degree of risk involved in trading. Any information and/or content is intended entirely for research, educational and informational purposes only and does not constitute investment or consultation advice or investment strategy. The information is not tailored to the investment needs of any specific person and therefore does not involve a consideration of any of the investment objectives, financial situation or needs of any viewer that may receive it. Kindly also note that past performance is not a reliable indicator of future results. Actual results may differ materially from those anticipated in forward-looking or past performance statements. We assume no liability as to the accuracy or completeness of any of the information and/or content provided herein and the Company cannot be held responsible for any omission, mistake nor for any loss or damage including without limitation to any loss of profit which may arise from reliance on any information supplied by Everest Fortune Group.

DJI Potential for Bullish Continuation | 24th November 2022On the H4 chart, the overall bias for DJI is bullish . Furthermore, the price is above the Ichimoku cloud , indicating that the market is bullish . Looking for an immediate buy entry at 34106.01, where the previous swing high is. I have set a relative safe stop loss at 33063.05, where the 78.6% Fibonacci line is. Take profit will be at 35492.22, where the previous swing high is.
Any opinions, news, research, analyses, prices, other information, or links to third-party sites contained on this website are provided on an "as-is" basis, as general market commentary, and do not constitute investment advice. The market commentary has not been prepared in accordance with legal requirements designed to promote the independence of investment research, and it is therefore not subject to any prohibition on dealing ahead of dissemination. Although this commentary is not produced by an independent source, FXCM takes all sufficient steps to eliminate or prevent any conflicts of interest arising out of the production and dissemination of this communication. The employees of FXCM commit to acting in the clients' best interests and represent their views without misleading, deceiving, or otherwise impairing the clients' ability to make informed investment decisions. For more information about the FXCM's internal organizational and administrative arrangements for the prevention of conflicts, please refer to the Firms' Managing Conflicts Policy. Please ensure that you read and understand our Full Disclaimer and Liability provision concerning the foregoing Information, which can be accessed on the website.

S&P repeat of August rally?Pattern looking a lot like August. With many traders taking vacation over the next month and lower volume, this would be a good time to see the market rally.

$VIX filled gap, NOW WHAT?!Buy on rumor
Sell on news
REMEMBER THAT!
Feds gave lil gift - No one wants to rattle this time of year
OK, $VIX did what we expected
GAP FILLED
Now WHAT?
We wait to be sure that "top" is in, again
BUT until we get DIRECTION, can nibble here & there
@ Symmetrical Triangle support
🚨 We break Long Term = NEW BULL
#VIX $SPX $SPY #stocks

Dow Jones Industrial Average Index UpdateFirst, we look at the trade idea I just published for the SPX as these two are closely related.
S&P 500 Index Update
We can see all the same signals...
These things they move in exactly the same way.
Just like Bitcoin and Ethereum (the "Merge"), the same goes for the SPX and DJI.
We have the major downtrend which has already been broken here.
So my speculation about the SPX upward corrention to prolong/go higher is true/possible, as it will follow the DJI.
We can see the DJI having a very strong bullish bias on the daily timerame already trading above MA200 and EMA300.
The next resistance here is showing as the August 2022 high/peak price.
We already see the DJI stopping short of this level today.
If this resistance can be conquered, the doors open for 35,400+ which at the same time tells us that the SPX can also grow.
Now, we see a divergence happening with the RSI, bearish divergence and we also see a potential for a sudden drop.
The weekly and monthly timeframes are full bullish.
The bulls have definitely the upper hand here...
The August 2022 resistance will be the next decision point.
Thank you for reading.
Namaste.

DOW JONES Too close to the August 16 High!It has been almost 2 weeks since Dow Jones (DJI) broke above the top (Lower Highs trend-line) of the Bearish Megaphone pattern that it has been trading in since the start of the year and the beginning of the 2022 correction. At the same time it broke above the 1D MA300 (yellow trend-line), which as we've mentioned numerous times was the barrier for a long-term bullish trend restoration:
The index is now very close to making another major bullish break-out as it is very close to the 34300 Resistance (1) which was formed by the August 16 High, which was rejected on the (former) Lower Highs trend-line and 1D MA300. If broken it will be the first time in 2022 that Dow Jones will break a Lower High. In this case, we will automatically target 35550 (Resistance 2), which was formed by the April 21 (Lower) High.
If the price gets rejected though, the index should seek the short-term Supports of 1) the 4H MA100 (green trend-line), which during the July - August and March - April counter rallies was the supporting level (when broken, the downtrends started) and 2) the 1D MA200 (orange trend-line), which held as Support for the first time in a year on November 10. Keep in mind that during Dow's bull rallies, the 1D MA50 (blue trend-line) is typically the Support.
On the downside, watch the 1W RSI, which has been glued to the top of the Channel Up in the past two weeks. Failure to break above it, should accelerate the sell sentiment towards the 1D MA50. The trigger for that can be a Bearish Cross on the 1D MACD, which is very close to be formed. All prior Bearish Cross in 2022 have kickstarted major sell-offs.
-------------------------------------------------------------------------------
** Please LIKE 👍, SUBSCRIBE ✅, SHARE 🙌 and COMMENT ✍ if you enjoy this idea! Also share your ideas and charts in the comments section below! This is best way to keep it relevant, support me, keep the content here free and allow the idea to reach as many people as possible. **
-------------------------------------------------------------------------------
You may also TELL ME 🙋♀️🙋♂️ in the comments section which symbol you want me to analyze next and on which time-frame. The one with the most posts will be published tomorrow! 👏🎁
-------------------------------------------------------------------------------
👇 👇 👇 👇 👇 👇
💸💸💸💸💸💸
👇 👇 👇 👇 👇 👇

DJI Potential for Bearish Momentum | 23rd November 2022On the H4 chart, the overall bias for DJI is bullish , with price above the Ichimoku cloud . However, we intend to make use of the pullback. As a result, price has tapped into our sell entry at 34281.36, which is the previous swing high as well as the 78.6% Fibonacci line. The stop loss will be set at the previous swing high of 35492.22. The take profit will be set at 32135.41, which corresponds to the 61.8% Fibonacci line.
Any opinions, news, research, analyses, prices, other information, or links to third-party sites contained on this website are provided on an "as-is" basis, as general market commentary, and do not constitute investment advice. The market commentary has not been prepared in accordance with legal requirements designed to promote the independence of investment research, and it is therefore not subject to any prohibition on dealing ahead of dissemination. Although this commentary is not produced by an independent source, FXCM takes all sufficient steps to eliminate or prevent any conflicts of interest arising out of the production and dissemination of this communication. The employees of FXCM commit to acting in the clients' best interests and represent their views without misleading, deceiving, or otherwise impairing the clients' ability to make informed investment decisions. For more information about the FXCM's internal organizational and administrative arrangements for the prevention of conflicts, please refer to the Firms' Managing Conflicts Policy. Please ensure that you read and understand our Full Disclaimer and Liability provision concerning the foregoing Information, which can be accessed on the website.

DJI Potential For Bullish ContinuationOn the H4 chart, the overall bias for DJI is bullish. To add confluence to this, price is above the Ichimoku cloud which indicates a bullish market. Looking for a retracement buy entry at 32818.16, where the 50% and 23.6% Fibonacci lines are located. Stop loss will be set at 31711.78, slightly below where 2 of the 38.2% Fibonacci lines are located. I am looking to take profit at 35411.35, where the previous swing high, 78.6% Fibonacci line and -27.2% Fibonacci expansion line are located.
Please be advised that the information presented on TradingView is provided to Vantage (‘Vantage Global Limited’, ‘we’) by a third-party provider (‘Everest Fortune Group’). Please be reminded that you are solely responsible for the trading decisions on your account. There is a very high degree of risk involved in trading. Any information and/or content is intended entirely for research, educational and informational purposes only and does not constitute investment or consultation advice or investment strategy. The information is not tailored to the investment needs of any specific person and therefore does not involve a consideration of any of the investment objectives, financial situation or needs of any viewer that may receive it. Kindly also note that past performance is not a reliable indicator of future results. Actual results may differ materially from those anticipated in forward-looking or past performance statements. We assume no liability as to the accuracy or completeness of any of the information and/or content provided herein and the Company cannot be held responsible for any omission, mistake nor for any loss or damage including without limitation to any loss of profit which may arise from reliance on any information supplied by Everest Fortune Group.

DJI Potential for Bearish Momentum | 23rd November 2022On the H4 chart, the overall bias for DJI is bullish , with price above the Ichimoku cloud . However, we intend to make use of the pullback. As a result, price has tapped into our sell entry at 34281.36, which is the previous swing high as well as the 78.6% Fibonacci line. The stop loss will be set at the previous swing high of 35492.22. The take profit will be set at 32135.41, which corresponds to the 61.8% Fibonacci line.
Any opinions, news, research, analyses, prices, other information, or links to third-party sites contained on this website are provided on an "as-is" basis, as general market commentary, and do not constitute investment advice. The market commentary has not been prepared in accordance with legal requirements designed to promote the independence of investment research, and it is therefore not subject to any prohibition on dealing ahead of dissemination. Although this commentary is not produced by an independent source, FXCM takes all sufficient steps to eliminate or prevent any conflicts of interest arising out of the production and dissemination of this communication. The employees of FXCM commit to acting in the clients' best interests and represent their views without misleading, deceiving, or otherwise impairing the clients' ability to make informed investment decisions. For more information about the FXCM's internal organizational and administrative arrangements for the prevention of conflicts, please refer to the Firms' Managing Conflicts Policy. Please ensure that you read and understand our Full Disclaimer and Liability provision concerning the foregoing Information, which can be accessed on the website.

DJI Potential for Bearish Momentum | 22nd November 2022On the H4 chart, the overall bias for DJI is bullish , with price above the Ichimoku cloud . However, we intend to make use of the pullback. As a result, we're looking for a sell entry at 34281.36, which is the previous swing high as well as the 78.6% Fibonacci line. The stop loss will be set at the previous swing high of 35492.22. The take profit will be set at 32135.41, which corresponds to the 61.8% Fibonacci line.
Any opinions, news, research, analyses, prices, other information, or links to third-party sites contained on this website are provided on an "as-is" basis, as general market commentary, and do not constitute investment advice. The market commentary has not been prepared in accordance with legal requirements designed to promote the independence of investment research, and it is therefore not subject to any prohibition on dealing ahead of dissemination. Although this commentary is not produced by an independent source, FXCM takes all sufficient steps to eliminate or prevent any conflicts of interest arising out of the production and dissemination of this communication. The employees of FXCM commit to acting in the clients' best interests and represent their views without misleading, deceiving, or otherwise impairing the clients' ability to make informed investment decisions. For more information about the FXCM's internal organizational and administrative arrangements for the prevention of conflicts, please refer to the Firms' Managing Conflicts Policy. Please ensure that you read and understand our Full Disclaimer and Liability provision concerning the foregoing Information, which can be accessed on the website.

DJI Potential For Bullish RiseOn the H4 chart, the overall bias for DJI is bullish. To add confluence to this, price is above the Ichimoku cloud which indicates a bullish market. Looking for a retracement buy entry at 32818.16, where the 50% and 23.6% Fibonacci lines are located. Stop loss will be set at 31711.78, slightly below where 2 of the 38.2% Fibonacci lines are located. I am looking to take profit at 35411.35, where the previous swing high, 78.6% Fibonacci line and -27.2% Fibonacci expansion line are located.
Please be advised that the information presented on TradingView is provided to Vantage (‘Vantage Global Limited’, ‘we’) by a third-party provider (‘Everest Fortune Group’). Please be reminded that you are solely responsible for the trading decisions on your account. There is a very high degree of risk involved in trading. Any information and/or content is intended entirely for research, educational and informational purposes only and does not constitute investment or consultation advice or investment strategy. The information is not tailored to the investment needs of any specific person and therefore does not involve a consideration of any of the investment objectives, financial situation or needs of any viewer that may receive it. Kindly also note that past performance is not a reliable indicator of future results. Actual results may differ materially from those anticipated in forward-looking or past performance statements. We assume no liability as to the accuracy or completeness of any of the information and/or content provided herein and the Company cannot be held responsible for any omission, mistake nor for any loss or damage including without limitation to any loss of profit which may arise from reliance on any information supplied by Everest Fortune Group.
