You want ? A 50% retracement of the entire increase since March 2020
It would make a nice purge of all the bubbles that we have on the
DROP


The dominance BTC is still the king of the crypto.
Then, his dominance could to pump and put altcoins aside.


I'm in fear. Please, protect me.
I'm really in fear now.
I'm afraid he's going to fall and he's not going to get up.


East Tea HorseIn waiting, i gonna to drink a tea in the East America near of Horse.
So, see you next year !


What's up with Tesla (TSLA$)TSLA$ is in a falling wedge pattern (bullish) and just hit a relevant previous ATH which serves as a support zone. Following could happen in the next couple weeks/months: either we are going to see a bullish formation BO with a retest on the relevant previous ATH (rn still support), which we could use to enter a long-position or the support is going to break, which could lead to a major drop of TSLA$s share price to 542$-600$. The next couple weeks/months will show which case will occur.
No financial advise


BAT-USDT will drop with the market (15 min view)Hello traders and investors.
I don't normally post such short TF charts, but I see a good opportunity here.
Ascending channel formed on hourly is looking to be losing strength.
This is a very short-term trade set up🆗
Enter at your own risk.
Target point 💲0.88
🛑🛑🛑This is not financial advice🛑🛑🛑 Above are approximate targets based on fibs etc. I always recommend looking at multiple charts when making a big investment!
Always have a stop loss ✋🛑💲 set
Any thoughts 💭💡, questions 🙋♀️🙋♂️❓, good 👍, bad👎, happy 😄 or sad 😥, in the comments always welcome.
🐶

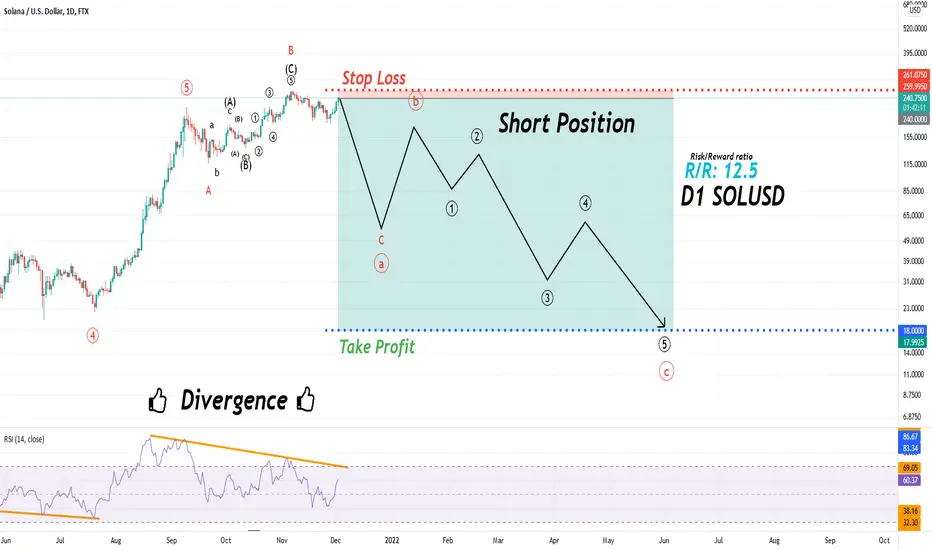
SOLUSD Trend and Wave analysis (Wave Elliot + Divergence) Big drop in prices on cryptocurrencies.
It is in the C wave and initially the price fall with the Elliott wave. In this analysis, it seems that the price will move down. The Stop loss and Take profit are marked on the price chart.
The price trend is down and there is a divergence in the charts. In many cryptocurrencies, the price growth seems to be over.
The wave you see in the future price on the chart is a schematic of a possible price trend and will not be formed just to clarify the possible price movement.
This is a personal analysis and should not be considered a criterion for buying or selling. Please pay attention to the Take profit and Stop loss. Cryptos show emotional and unforeseen price behavior.
I use Elliott and Price Action in my analysis, and my analysis is based on that. The structure of the Elliott wave count is complex and different patterns are formed in the chart, so there is a possibility of a change in the price movement of the price.
ES1!Futs showing me nothing relatively but I do suspect we get a movement in price to the upside of this channel and that'll be the great spot to go short.
Fear is very high now and can suspect a bounce to come soon enough but I have a feeling we have one more move to the downside before we get any more comfortablity or run

xauusd possibilities after the big dropGold might bounce off the trend line to stay within the channel.. Also if it breaks and closes below the channel, it might go down too.. My target will be 1830-1860 level but we will see how it reacts after the drop.. Thanks Mr Powell (Not)

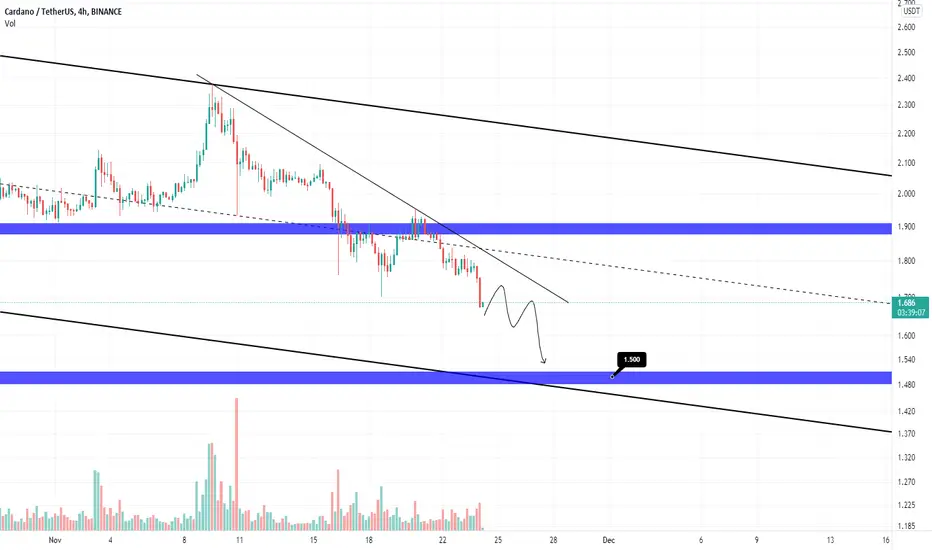
ADA wants drop more, Where is the bottom?ADA Short term Analysis
ADA wants to drop more as we can see, All indicators are in OVER SELL zone!
The drop up to 1.5$ is expected because no more support is before that zone.
1.5$ can be a bottom, We must be patient and track market movements.
WAVES is going to drop hard more!WAVES Mid term Analysis
WAVES has broken a strong trend line which is so bearish for this coin.
We expect to see more drop up to 17$ and 12$ for this coin. Also the best places to buy this coin are these!

ADA entry pointHello everyone,
ADA is going down, it was quite obvious, but now let's talk about entry point.
I think 1.75/1.7 would be a good temporary entry point for ADA. We need to keep in mind that ADA may go even lower, do not rush in!
Have a nice day!
