DXY Will Move Higher! Long!
Take a look at our analysis for DXY.
Time Frame: 2h
Current Trend: Bullish
Sentiment: Oversold (based on 7-period RSI)
Forecast: Bullish
The market is testing a major horizontal structure 102.170.
Taking into consideration the structure & trend analysis, I believe that the market will reach 102.904 level soon.
P.S
The term oversold refers to a condition where an asset has traded lower in price and has the potential for a price bounce.
Overbought refers to market scenarios where the instrument is traded considerably higher than its fair value. Overvaluation is caused by market sentiments when there is positive news.
Disclosure: I am part of Trade Nation's Influencer program and receive a monthly fee for using their TradingView charts in my analysis.
Like and subscribe and comment my ideas if you enjoy them!
DXY

USDCAD → Weak dollar provokes continuation of downtrendFX:USDCAD under the pressure of a weak dollar and downtrend may renew its lows. The fundamental background for the dollar is weak, the market reacts accordingly.
The dollar continues to fall - a reaction to the tariff war. Besides, additional pressure is created by the issue of interest rates reduction.
The currency pair is under the pressure of the downtrend. After a false resistance breakout, the price is consolidating in the selling zone. The trend change is confirmed by the cascade of resistances. Emphasis on the local range 1.4245 - 1.42018. The price exit from the consolidation will provoke the continuation of the fall
Resistance levels: 1.4245, trend boundary
Support levels: 1.4202, 1.415
Possible retest of resistance before further decline. But the price exit from the current range and consolidation of the price below 1.4202 - 1.4205 will provoke the growth of sales and further fall to 1.405 (zone of interest).
Regards R. Linda!

Gold continues to rise and break through!Gold was driven by risk aversion news, and soared more than $100 in a single day yesterday, with a huge positive line on the daily line! At present, it has broken through the 3100 mark. It is difficult for gold to continue to be long and short. The next step is more of a big sweep!
At present, the 3100 mark will be the key to the next long and short positions. It is under pressure to continue to be bearish. The key 3055-50 area below is the long breakthrough point, which is also the support area for the two declines in the US market. Once it breaks down, it indicates that the rise started at 2970 yesterday has ended and returned to the short position.
If gold breaks upward and stands above the 3100 mark with the help of news, the long position will gradually rise to 3115-20 and 3135-40 (last Friday's high point) and even test the historical high of 3167 to build a daily double top!
Intraday operation:
The 3100 mark is used as a long-short boundary. If it breaks through, you can consider short-term long positions. After pulling up, refer to the above target position, which is also a resistance position, and arrange short positions again.

GOLD SELL - POSSIBLE 2ND ENTRYI’m selling XAUUSD here again for my 2nd entry. This is a HIGH RISK trade, due to the huge bullish momentum right now & Tariff wars.
If this ‘Wave 2 Zone’ gets taken out, it’s likely we will see a new ATH coming on Gold.

USDJPY Bullish to $149.500Rather than buying at the top of the ‘Impulse Wave’, wait for a ‘Wave 2’ or ‘Wave B’ correction towards the support zone, so you can buy back at a cheaper price.
⭕️5 Major Wave Bearish Move Complete.
⭕️5 Minor Waves Complete in Wave 5.
⭕️BOS Confirming Bullish Structure Now Valid.

Dollar Index Bullish to $111.350 (UPDATE)Dollar buyers are still holding up nicely. Sellers tried to push price down today but buyers stepped back in again.
We're currently seeing a bullish accumulation take place around 'Major Wave X' support zone.

Short XAU (Gold) Gold Futures are showing a very clean impulsive move through Elliot Wave TA. You can see the running flat on the 2nd wave leading to a very strong move on the Wave 3 major move. The Wave 5 is shorter than the Wave 3 to confirm the possible completion of this 5 Wave move up.
A weaker DXY (USD) is throwing an obstacle to this beautiful setup. Let's see some stability to the bonds market which should lead to stability in the equities market. This should help propel traders taking profits on this Gold rush.

DXY: Will Go Up! Long!
My dear friends,
Today we will analyse DXY together☺️
The recent price action suggests a shift in mid-term momentum. A break above the current local range around 102.250 will confirm the new direction upwards with the target being the next key level of 102.798 and a reconvened placement of a stop-loss beyond the range.
❤️Sending you lots of Love and Hugs❤️

NZDUSD - Golden Opportunity Alert This pair has been consistently breaking lows for a while — but things just got interesting. It’s now sitting at a key yearly support level, and we're still firmly within a large bullish range.
📈 Translation? Now is the time to buy.
This setup is looking like a textbook bounce opportunity. Not only is this one of the cheapest dollar pairs available right now, but with the dollar continuing its broader decline, this could be the best pair to capitalize on in the current market.
⚡ Don’t sleep on this move. Timing is everything.
Let me know what you think — and if this breakdown helped you, drop a comment or share it with someone who needs to see it!

Possible Battle Between USDJPY Bulls and Bears at TrendlineUSDJPY is currently testing its weekly trendline, but recent data from Japan may challenge the possibility of a downward break.
Market turmoil has increased demand for long-term U.S. bonds, and the resulting drop in the TVC:US10Y has kept the TVC:DXY under pressure, conditions that have supported Yen bulls. However, the latest wage data out of Japan may shift the short-term outlook just as the trendline is being tested.
Base full-time wage growth dropped to 1.9% year-over-year, down from 3%. This slowdown may give the Bank of Japan more justification to hold rates steady at its next meeting. If tariff-related panic subsides with any calming news from the White House, USDJPY could see renewed upside potential.
In the short term, two resistance levels are crucial: 146.50 and 147.50. The battle between bulls and bears is likely to play out between these resistance levels and the weekly trendline near 145.

XAUUSD/GOLD Possible Move 09.04.2025📊 Market Context
After a sharp selloff from the $3,160 region to sub-$2,980 levels, the market is now in recovery/consolidation mode.
Market currently hovers around $3,010 after bouncing from below $2,980, indicating buyer interest.
📏 Fibonacci + Support Confluence Zones
Price may pull back and give a buy-the-dip opportunity.
✅ Buy Zone 1 – $2,993–2,997
Reason: Retest of strong horizontal support, Fibonacci .5% area.
Signal to Enter Long: Bullish engulfing / hammer on M5/M15 + RSI divergence.
Target: $3,010 (first), $3,020+ (extended).
🔁 Retest Logic
Wait for price to retest any of these zones on low volume → watch for bullish candle close.
⚠️ Important Notes
Avoid entering mid-range trades at $3,010–$3,015 without pullback confirmation.
Aggressive buys can be scalped on momentum breakouts of $3,020 only if volume supports.
Always monitor for news or sudden volume spikes which can invalidate pullback zones.
Follow, comment, like and join for more like analysis.

Gold: Economic Risks May Drive Prices UpGold Surges Amid Global Uncertainty, Testing Key Resistance
Gold has continued its impressive rebound, climbing steadily from its recent trough at $2,957 to reclaim territory above the psychological $3,000 mark. This upward momentum is being driven by a confluence of macroeconomic factors, including a softening US dollar and a pause in the previously relentless climb of US Treasury yields. With markets recalibrating their expectations around interest rate cuts by the Federal Reserve, investor appetite for safe-haven assets like gold has gained renewed strength.
At the heart of the current rally lies mounting geopolitical tension, particularly the intensifying trade standoff between the United States and China. Washington's proposal to impose 50% tariffs on a broad array of Chinese goods has rattled global markets. In response, Beijing is signaling potential retaliatory measures, further stoking fears of a prolonged economic conflict between the world's two largest economies. These developments are injecting volatility into risk assets and increasing demand for traditional hedges such as gold.
From a technical standpoint, the precious metal is currently grappling with a significant resistance level near $3,013. If the price manages to consolidate above this threshold following the current retracement, it could pave the way for a continued upward drive toward the next resistance zones at $3,033 and $3,057. These levels represent key pivot points that could dictate the short- to medium-term trajectory of gold.
On the downside, immediate support lies at $2,996, with stronger backing at $2,981. These levels may provide a cushion for any near-term pullbacks, especially as traders look for opportunities to re-enter the market during dips.
The broader narrative remains highly fluid, shaped by the ever-changing dynamics of global trade policy and monetary strategy. As the tug-of-war between Washington and Beijing intensifies, markets are left navigating a highly politicized and uncertain environment. With neither side showing signs of capitulation—China maintaining its firm stance, and the US administration likely to resist backing down—the potential for further escalation remains high.
In this context, gold’s appeal as a strategic asset grows stronger. The current setup suggests that the metal may gain additional bullish traction if it finds support around the 0.5 Fibonacci retracement level or holds above $3,013. Investors are keenly watching these technical and fundamental cues, weighing the growing economic risks that could propel gold into a sustained rally.

Weekly Market Analysis - 9th April 2025Here we are with another market analysis. This time, a bit late in the week on a Wednesday, but it is what it is! We have CPI today and PPI tomorrow, so this should be an interesting week. Overall, gut instinct tells me we would be pushing lower for the DXY, but again, i'm not betting anything on it. I trade the candles, I trade the structure, I don't trade guesses.
I hope you find the video analysis useful. Take care this week!
- R2F Trading

Trading Plan for DXY Elliott Wave View:
Large correction marked as Wave 4 in progress.
Inside it, a (A)-(B)-(C) zigzag structure is unfolding.
We’re currently in a sub-Wave B of C, expecting a short dip before a bullish move into the 104.80–105.60 supply zone (red box).
Invalidation level sits at 108.247, confirming the correction is valid below that.
2. Price Levels & Zones:
Strong support zone around 101.50–102.00, projected as a potential base for the next leg up (Wave C).
Resistance (target) is clearly the red supply zone near 105.
---
Correlation with EUR/USD Chart:
If DXY is expected to rise in its Wave C, then EUR/USD should fall (as seen in your earlier chart).
Your EUR/USD analysis targets the 1.06924 demand zone — this lines up perfectly with DXY's Wave C rise.
---
Trading Plan for DXY (or correlation play):
If trading DXY directly (if possible via CFDs):
Buy setup: Wait for minor correction (Wave B) to bottom around 101.80–102.00.
Entry: Near support with confirmation candle.
Target: Red zone 104.80–105.60.
SL: Below 101.50.
For EUR/USD traders:
Watch for EUR/USD Wave B to complete.
Once DXY starts impulsing up (Wave C), EUR/USD will likely drop hard.
That’s your sell opportunity on EUR/USD, aligned with DXY strength.

DXY WILL GO DOWN|SHORT|
✅DXY made a retest of
The horizontal resistance
Of 103.400 and we are seeing
A bearish pullback already
So we are bearish biased and
We will be expecting a
Further bearish move down
SHORT🔥
✅Like and subscribe to never miss a new idea!✅
Disclosure: I am part of Trade Nation's Influencer program and receive a monthly fee for using their TradingView charts in my analysis.

Dollar Index Bullish to $111.350 (UPDATE)Since yesterday's Dollar update, price has moved according to our arrow. We saw a small dip down overnight & now buyers have once again pushed price back into the grey zone.
We are expecting price to remain within this grey zone, seeing it flip from a resistance zone into support. Once price closes above this zone, we'll have extra confirmation that Dollar buyers are ready to push price even higher🚀

This GBP/USD Move Will Catch Most Traders Off GuardGBP/USD has been in a strong uptrend over the past few weeks, with consistent bullish momentum. However, last week we saw the pair move into a period of range-bound consolidation—that is, until geopolitical headlines shook things up.
Following the news of Trump’s tariff announcements, the pair initially spiked aggressively to the upside, only to see a sharp 500-pip drop the next day. While this move might seem like a reversal at first glance, I believe it's a healthy pullback within a broader bullish trend.
Here’s why:
✅ The recent decline cleared out late buyers, creating a potential liquidity zone for institutions.
✅ Prior to the drop, the market took out sell-side liquidity from the range, then quickly reversed — a classic "grab and go" move.
✅ Structure remains intact to the upside, and I believe this pullback presents a high-probability buying opportunity.
📈 I’m expecting GBP/USD to retest and likely break last week’s high, with potential for another 500+ pip move to the upside in the coming sessions.
🛑 As always, manage risk carefully—nothing moves in a straight line, and fundamentals remain a factor.
If you found this insight helpful, give it a boost! 🔥

US DOLLAR at Key Support: Will Price Rebound to 103.350?TVC:DXY is currently testing a key support zone, an area where the price has previously shown strong bullish reactions. The recent price action suggests that buyers may step in and drive the price higher. A bullish confirmation, such as a strong rejection pattern, bullish engulfing candles, or long lower wicks, would increase the probability of a bounce from this level. If buyers regain control, the price could move toward the 103.350 level.
However, a breakout below this support would invalidate the bullish outlook, potentially opening the door for further downside.
This is not financial advice but rather how I approach support/resistance zones. Remember, always wait for confirmation, like a rejection candle or volume spike before jumping in.
Please boost this post, every like and comment drives me to bring you more ideas! I’d love to hear your perspective in the comments.
Best of luck , TrendDiva

We might get a play on Gold soon! Been waiting for price to come for these levels for almost a month now. Now that we are finally here I'm just trying to keep my cool and wait for things to line up inside of the killzone. We could get a nice bullish swing here. We just have to wait for price to show us thats what it wants to do.

SELL GOLDIn todays session we are looking for selling opportunity in this most waited for pair GOLD. It has been extremely bullish. Our entries are at 3160 stops above 3200 and targets as low as 2916. Use proper risk management and wait for confluence.
BEARS INCOMING

Dollar Index Bullish to $111.350 (UPDATE)The DXY wave analysis has been re-counted & bullish bias remains👇
⭕️3 Major Sub-Wave Correction
⭕️3 Minor Sub-Waves Within Major
⭕️Gold Bearish, Which Makes DXY Bullish

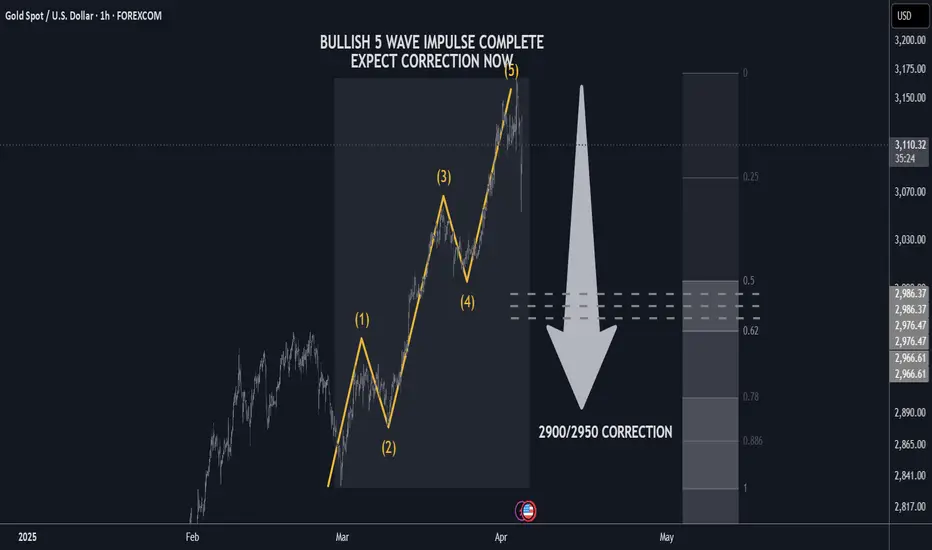
GOLD H1 Update: Expect correction 2900/2950 USD🏆 Gold Market Update (April 3rd, 2025)
📊 Technical Outlook Update
▪️5 wave impulse completed
▪️Expect correction now
▪️Tariffs already priced in
▪️Profit taking in progress now
▪️Price Target BEARS 2900/2950 USD
▪️Strategy: SHORT SELL rips/rallied
▪️target is 2900/2950 USD
📢 Gold Market Update – April 2025
📈 Gold Hits All-Time High!
🚀 Price spiked to $3,167.84/oz after Trump announced sweeping tariffs (10–34%) on global imports.
🌎 Investors rushed to safe-haven assets amid rising trade war fears.
📉 Volatility Followed
💸 Sharp pullback after the surge as markets reacted to global uncertainty.
🔁 Analysts expect more swings as tensions evolve.
🏦 Central Banks Buying More Gold
🛡️ A move to protect against currency risks & inflation fears.
4.8 Gold Bollinger Bands bearish signal appearsRecently, the spot gold price once fell below the psychological barrier of $3,000, triggering technical concerns in the market about whether the gold bull market has reached its peak. On Monday (April 7) in the North American session, spot gold is currently trying to recover to around $3,030, but the technical indicators have shown obvious divergence.
Fundamental analysis
The market's concerns about US inflation continue to ferment, and the intensification of global trade frictions is driving the market's concerns about economic stagflation. The Fed's policy stance has also undergone subtle changes. The market has begun to price in five possible interest rate cuts this year. The CME FedWatch tool shows that the probability of the Fed's interest rate cut in May has soared from 33.3% last Friday to 49.3%.
At present, traders are turning their attention to the US inflation data to be released this week, which will provide important clues for assessing the US economic situation.
Technical analysts' interpretation:
Bollinger band breakthrough signal indicates a short-term correction
On the daily chart, gold prices have formed a clear upward channel since mid-March, but recently touched the upper track of the Bollinger band and began to fall. It is worth noting that the middle track of the Bollinger Band 3006.13 has become a key support level. After breaking through the historical high of 3167.60, the price has shown a typical upward exhaustion pattern. The MACD indicator shows DIFF: 43.46, DEA: 48.65, MACD: -10.39, and the green kinetic energy column has begun to expand, indicating that the short-term downward momentum is accumulating.
RSI indicator shows overbought correction
The 120-minute chart shows that the RSI indicator has fallen from the overbought area to a neutral level of 40.37. At the same time, the CCI indicator has dropped to -45.05, further confirming the trend of short-term overbought correction.
Key support and resistance level analysis
The current gold price faces multiple technical resistances, among which 3055.00 and 3085.00 constitute the main resistance range for short-term rebound. The lower support levels are mainly concentrated at $3005.00 and $2971.31, and these two levels will determine whether the gold price can remain above the psychological level of $3,000. In particular, the $2971.31 level, as a recent low, may trigger a deeper adjustment if it is lost.
From the long-term daily chart, gold prices formed an accelerated upward channel after breaking through $2950.00. The recent high of $3167.60 is just at the upper track of the channel. This trend of peaking and falling is in line with the classic channel trading theory.
Outlook
Bull Outlook: If the US inflation data exceeds expectations, the market's expectations for a more aggressive rate cut by the Federal Reserve will be further strengthened, and gold prices are expected to re-challenge the high of $3167.60 after a correction. Technically, gold prices need to return to above $3055.00 to reactivate upward momentum. The widening of the Bollinger Band width indicates that volatility is increasing, which provides potential trading opportunities for bulls.
Bear Outlook: In the short term, the downward divergence of the upper track of the Bollinger Band indicates that gold prices may face further corrections. The MACD histogram turned green and continued to expand, suggesting that downward momentum is accumulating. If the gold price falls below the key support of $2,971.31, it may trigger a deeper adjustment, and the next target will be $2,950.00 or even $2,920.00.
