3.28 Gold breaks new high again, holding on is the keyGold price hits a new record high of 3086, and today's low is the key
Gold price hits a new record high of 3086, which is in line with our bullish thinking of restarting strength since Tuesday
Now the price has also broken through the upper track of the green channel line. The next focus is on keeping low. Keeping low and breaking high will accelerate. Breaking the low point will easily return to sweeping
Today's low point defense position has two, the first is the early trading low of 3054, because it is a direct rise in the early trading to break the new high, and the afternoon continues to break the new high. In this case, it is particularly important to hold the early trading low ;
The second is the position along the green channel line, 3063-3061, which is also the position of the acceleration starting point
Then, next, hold the position along the green channel line, and switch upwards for at least 50-70 US dollars, corresponding to the resistance of the 3100-3115 area
The key point is to hold low, hold low and break high to see acceleration, and break the low point to turn to sweep
As shown in the figure, this wave of confirmed support began to rise, starting from breaking through the green dotted line suppression. After the breakthrough, repeatedly stepping back to confirm the 3015 upper and lower areas Support, then stand up and stabilize in the 3033-3030 area, and start an upward breakthrough
In the process, it is accompanied by a deep squat of 18-20 US dollars. After the leverage is completed, it will rise by more than 40 US dollars to break the new high
For the market that directly rose in the morning, there was a second sprint to break the high in the afternoon, so refer to 3068-3066 as support to continue to layout the bullish sprint to the 3080-3082 area
The price also accelerated the sprint and rose, and slightly exceeded the range of 3086
: Suppression line Under pressure, enter adjustment, squat 18-20 US dollars, confirm the support and continue to pull up more than 40 US dollars (what needs to be considered and verified at this moment)
For this pressure position, the focus is on the 3082-3085 area (now the excess range has reached 3086), using this as a suppression to find a space range of 18-20 US dollars, corresponding to the 3062-3060 range
The short position in the 3082 area fell to 3072-3070 as expected
Verify the conjecture step by step, time is the best verification tool!
Today is Friday, still the old rules, only provide information reminders for cooperative friends, if you need, you can find us, looking forward to the good news you have received!
DXY

Dollar Bullish To $118?! During the last update I said I remain bullish on the Dollar for the upcoming future & that bias still remains the same. After the strong bullish rally from October - December 2024, The Dollar started off this year with an ease off, seeing prices drop for the first quarter of 2025. However, this cool off has not changed the long term perspective for the Dollar as we still remain bullish. This correction (sell off) this quarter was simply a dip.
The Dollar has completed its Wave D consolidation phase & is now getting ready for further upside towards Wave E. Wave E being priced around $116 - $118.

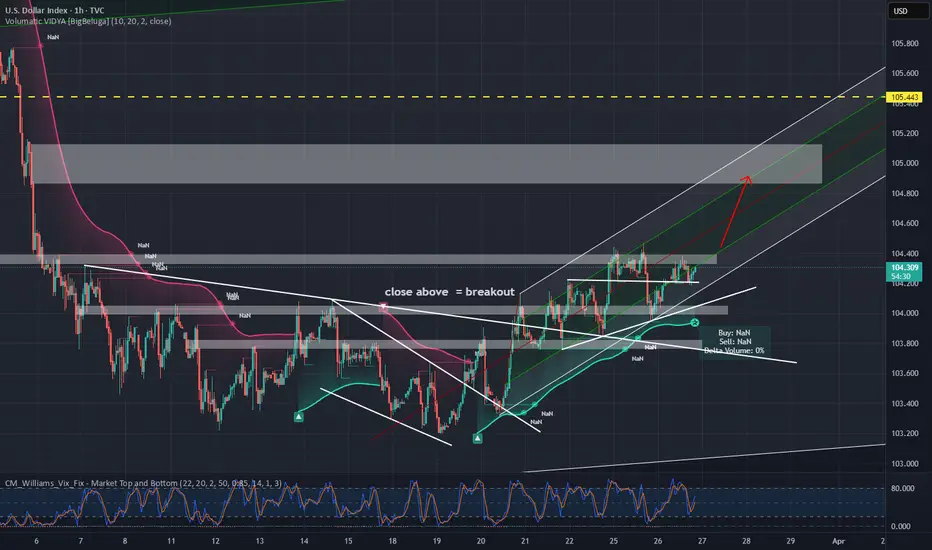
DXY Monthly Analysis: Key Support Holding, Bullish Move Ahead?📊 DXY Monthly Chart Analysis (March 27, 2025)
Key Observations:
Current Price Action:
The U.S. Dollar Index (DXY) is trading near 104.267, with notable resistance ahead.
Price is consolidating within a key demand zone (~102.5–104) after rejecting higher levels.
Technical Levels:
Support Zone: 100.2–104 (Highlighted in purple)
Resistance Zone: 112.5–114.7 (Highlighted in purple)
Major Resistance: 114.77 (Previous high, acting as a supply zone)
200-MA Support: Located below current price, offering a long-term bullish confluence.
Market Structure:
Price remains in a higher time-frame bullish trend but is experiencing a correction.
The "BOSS" level (Break of Structure) suggests a prior bullish breakout.
If the demand zone holds, a bullish continuation towards 112.5–114.7 is possible.
Projected Move:
A bounce from 102–104 could trigger a rally toward the upper resistance zone (~112.5).
A break below 100.2 could indicate a shift in trend and further downside.
Conclusion:
DXY is at a critical decision point. Holding the current support zone (~102–104) could fuel a bullish continuation toward 112–114, while a breakdown below 100.2 would weaken bullish momentum.

DXY:Today's Trading StrategyTrump signed an executive order announcing a 25% tariff on all imported cars, aiming to force the return of many automotive manufacturing and related industries through the "tariff stick." However, the actual situation is more complex. Currently, there are significant issues within the US domestic industrial chain system, with declining quality and craftsmanship, failing to meet the needs of many automotive manufacturing enterprises. As a result, this measure is unlikely to achieve the desired effect and may even harm the US itself. The US Dollar Index is the first to bear the brunt. Upon the market's confirmation that Trump has officially signed the order and tariffs will be imposed, the pressure on the US Dollar Index suddenly emerged, squandering the hard-earned advantages accumulated yesterday. This led to a sharp decline in the US Dollar Index early today.
Regarding today's trading strategy, it is recommended to adopt a trading approach based on the market's oscillatory trend. One can seize the opportunity to sell the US Dollar Index short at highs and buy non-US currencies at lows, as the current market demand indicates that the US Dollar Index cannot truly rise, nor will it experience a significant decline for now. Therefore, it is advisable to find opportunities to sell the US Dollar Index short at highs during the market's oscillation.
Trading strategy:
buy@103.70-103.80
TP:104.50-105.00
Get daily trading signals that ensure continuous profits! With an astonishing 90% accuracy rate, I'm the record - holder of an 800% monthly return. Click the link below the article to obtain accurate signals now!

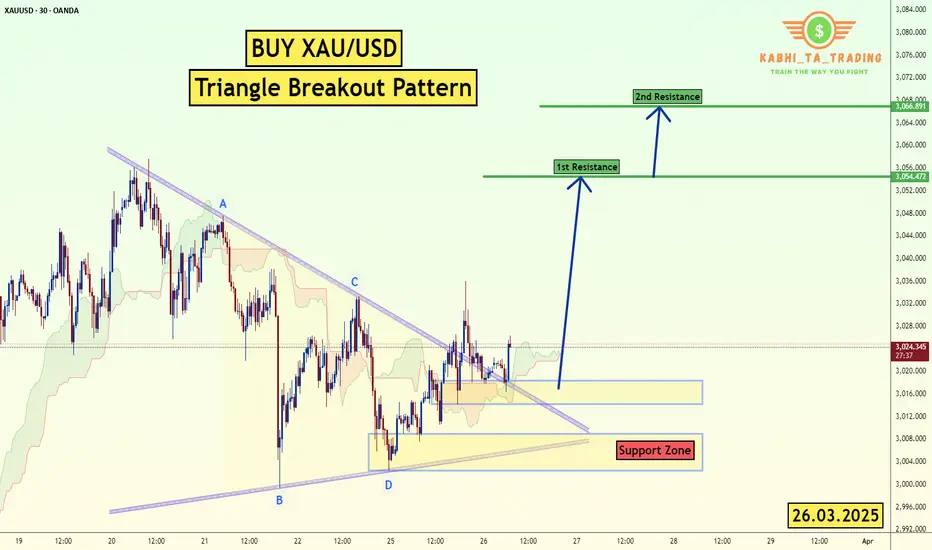
XAU/USD (Gold) Triangle Breakout (26.03.2025)The XAU/USD pair on the M30 timeframe presents a Potential Buying Opportunity due to a recent Formation of a Triangle Breakout Pattern. This suggests a shift in momentum towards the upside and a higher likelihood of further advances in the coming hours.
Possible Long Trade:
Entry: Consider Entering A Long Position around Trendline Of The Pattern.
Target Levels:
1st Resistance – 3054
2nd Resistance – 3066
🎁 Please hit the like button and
🎁 Leave a comment to support for My Post !
Your likes and comments are incredibly motivating and will encourage me to share more analysis with you.
Best Regards, KABHI_TA_TRADING
Thank you.
Dxy aka usd 26 Mar 2025updated uptrend channel, price still bullish for usd as price break out earlier and stay above neckline, looking for more upside, ideally towards the supply region
Which if come true, eur, gbp etc should continue falling
If price do close below channel strongly, it could suggest a shift in trend.
Good luck
DOLLAR INDEX (DXY): Strong Bullish Sentiment
As I predicted yesterday, Dollar Index continued growing.
Analyzing the intraday price action today,
we can see that the market established a nice rising channel on a 4H.
I think that the Index will keep rising within a channel and will reach 105.0 level soon.
❤️Please, support my work with like, thank you!❤️

GOLD H1 Market Update: Bear Trap / liquidity sweep BUY DIPS📊 Technical Outlook update
🔸Bullish OUTLOOK
🔸3050 USD Resistance Heavy
🔸3000/3040 Trading Range
🔸2990 potential Bear Trap
🔸Price Target BULLS: 3100 USD - 3150 USD
🔸Recommended Strategy: BUY DIPS 2990
📊 Gold Market Summary – This Week
💰Gold Price Surge: Gold prices soared above $3,000, prompting Bank of America to raise its price target.
💸Profit-Taking Pressure: After the surge, mild profit-taking caused a slight price correction.
🛡️Safe-Haven Demand: Gold continues to show strength, supported by safe-haven flows amid economic uncertainty.
📅 Economic Data Impact: U.S. economic data (e.g., 0.9% rise in durable goods orders) is influencing gold prices, pushing them to session highs.
🔄Consolidation with Bullish Outlook: Gold is consolidating but remains bullish due to favorable U.S. dollar performance and Federal Reserve policies.
🌍Geopolitical Tensions: Ongoing Russia-Ukraine conflict and U.S.-Russia tensions continue to support gold’s status as a safe-haven asset.
💎 Summary:
Gold remains resilient with strong demand, positive economic indicators, and geopolitical tensions supporting its value, despite minor price corrections.

EURUSD
Hello Traders! 👋
What are your thoughts on EURUSD?
The EURUSD entered a corrective phase after hitting the anticipated resistance zone and was rejected from this area, as previously analyzed. The price is now approaching a key support level. At this support level, there is a possibility of a new bullish move starting, which could lead to a breakout above the previous resistance and push the price toward the next identified target.
Will EURUSD hold the support and push higher, or is there more downside ahead? Let us know your thoughts!
Don’t forget to like and share your thoughts in the comments! ❤️

27.03.25 Morning ForecastPairs on Watch -
FX:NZDCAD
OANDA:XAGUSD
FX:NZDUSD
A short overview of the instruments I am looking at for today, multi-timeframe analysis down to what I will be looking at for an entry. Enjoy!

DXY Is Bullish! Long!
Take a look at our analysis for DXY.
Time Frame: 6h
Current Trend: Bullish
Sentiment: Oversold (based on 7-period RSI)
Forecast: Bullish
The market is testing a major horizontal structure 104.402.
Taking into consideration the structure & trend analysis, I believe that the market will reach 105.208 level soon.
P.S
Overbought describes a period of time where there has been a significant and consistent upward move in price over a period of time without much pullback.
Disclosure: I am part of Trade Nation's Influencer program and receive a monthly fee for using their TradingView charts in my analysis.
Like and subscribe and comment my ideas if you enjoy them!

Eur/Usd Mar/24 Weekly analyzeHello eveyone.
Price reject at W200 ma for 2 weeks and Closed below W 200 MA also this w open below W pivot so i'm gonna sell for this week
..............................
( This is an idea and entry-tp-sl placed for my own trade , you can change entry-tp-sl depends on your risk management )

DOLLAR INDEX Good Day Fellow Traders
We have seen that the Dollar has stopped trending at 110 area as market on the chart as a weekly level of resistance, with thus we have closely been tracking the cot index which indicates that a correction is due, although there has not been much action of impulsive move down, we do expect at least a 3-wave pullback down to the 105 area, should this level break it open the chart for a drop down to the weekly level at 104.00.
Yesterday we had a higher inflation reading, with trump policies in action we could expect more of the same higher volatile moves to come and USD to be the dominant trading currency under the rain of Trump. My personal opinion would be to stay away from forex pairs and rather shift focus to swing and position trade the global indices as political turmoil will affect currencies most, look at monthly, weekly and daily charts(entries) with wide stops

Dollar near term strenght coming, Weekly demand holdingThe DOllar has been in a decline over the last couple of months, We can see from tracking how the COT INDEX
COT Index in Forex for 6 months and 36 months
The 6-month and 36-month time frames typically refer to the historical analysis of COT data for specific currency pairs, providing insights into:
6-month COT Index:
This reflects the trading positions over the past 6 months.
It shows the trends in how market participants (e.g., hedge funds or commercial traders) have been positioned recently.
Traders typically use this shorter time frame to gauge recent trends and near-term sentiment.
A higher COT Index value indicates that speculators have a larger net long position, suggesting potential bullish sentiment, and vice versa for a lower COT Index.
36-month COT Index:
This reflects the trading positions over the past 3 years.
It provides a longer-term view of trader positioning, helping to identify historical trends and market cycles.
A higher 36-month COT Index suggests persistent bullish positioning over the longer term,
we can see the Dollar has been bought up at WEEKLY Demand, we will start looking for a shift to buy the Dollar on a daily chart.

Be the Choosy trader on Gold!Price is dragging on dropping. being very indecisive. Looks like the entire market is waiting on News to help give it a push. I need to see price break out of value before I can get a read on a sold move. in the mean time this is sclaping conditions. You can hold trades. Have to cut them short quick with this price action. Since we have some USD news tomorrow that indicates that the market might be waiting for that before proceeding on any decisions. Patience is key!

Dollar Index Bullish to $111.350 (VIDEO UPDATE)If you remember on the last update, I showed the possibility of the previous Wave 4 low getting taken out, which did happen. I’ve now re-counted the waves, as analysed on the video above.
⭕️3 Sub-Wave Correction (A,B,C) relabelled.
⭕️Wave 4 Low relabelled.
⭕️Main Supply Zone highlighted.

DXY:Pay attention to the retest of the daily chart supportOn Tuesday, the price of the US Dollar Index generally declined. The intraday price peaked at 104.444, bottomed out at 103.917, and closed at 104.189.
From the perspective of the daily chart, the level of 103.80 below serves as a crucial watershed for the wave trend. As long as the price remains above this level, a short-term bullish position is advisable for the time being. Meanwhile, the short-term support of the four-hour chart is in the 104.10 area. Currently, the price in the short term is fluctuating and is likely to continue to retest the support area of the daily chart. Therefore, in trading operations, focus on the support of the daily chart and anticipate an upward movement.
Trading strategy:
buy@103.70-103.80
TP:104.50-105.00
Get daily trading signals that ensure continuous profits! With an astonishing 90% accuracy rate, I'm the record - holder of an 800% monthly return. Click the link below the article to obtain accurate signals now!

Skeptic | DXY Showdown: Battle at 104.403Welcome back, guys! 👋I'm Skeptic
Today, we're diving deep into the DXY (U.S. Dollar Index), analyzing key levels and potential triggers.
🔍 Recap & Current Structure:
As highlighted in our previous analysis , the major daily support (0.618 Fib) held strong at 103.303 , with price reacting precisely at this level.
Currently, the DXY is testing a critical 4H resistance at 104.403 , which aligns with:
A 4H consolidation range breakout zone
A potential fakeout trap if price fails to sustain momentum
The RSI (65.92) suggests building bullish momentum, but confirmation requires a clean break above 104.403.
📈 Bullish Scenario (Long Setup):
Trigger: Break & close above 104.403
Confirmation: RSI holding above 65.92
Invalidation: Rejection + close back below 104.000
📉 Bearish Scenario (Short Setup):
Trigger: Rejection at 104.403 + drop below 103.936
Confirmation: RSI reversal below 50 + bearish 4H candle close
⚠️ Key Notes:
Fundamentals: Recent economic data favors dollar weakness—trade longs cautiously.
Risk Management: Avoid overleveraging—wait for confirmed breaks.
Stay sharp, and I’ll see you in the next analysis!

USDJPY 18K PROFIT LIVE TRADE AND BREAK DOWNUSD/JPY rebounds toward 150.50 on risk recovery
USD/JPY is bouncing back toward 150.50 in Wednesday's Asian session. The pair reverses US President Trump's fresh tariff threats and hawkish BoJ commentary-led drop, tracking the rebound in risk sentiment and the US Dollar. All eyes stay on US tariffs, data and Fedspeak.

EURUSD Is due a correction EUR/USD has been in a sustained uptrend for some time, but we are currently seeing a period of consolidation. Given the current market structure, I anticipate a bearish move this week, with a potential entry either now or in the near future.
Let me know your thoughts, and if you found this analysis valuable, give it a boost!

3.26 Technical analysis suggestions for short-term gold operatioIn the early European trading on Wednesday (March 26), spot gold continued to rebound in the short term, and the current gold price is around $3027/ounce.
Gold technical analysis, how to operate in the evening? ——
The daily chart of gold shows that gold prices are rising above all bullish moving averages, while setting higher highs and higher lows. The 20-day simple moving average (SMA) has gained upward momentum and currently provides dynamic support around 2954.70. At the same time, after correcting the extreme overbought conditions, technical indicators resumed their upward trend within the positive level. From the 4-hour line, gold prices are fighting against the mildly bearish 20-period SMA, but are still well above the bullish 100-period SMA and 200-period SMA. At the same time, technical indicators are retreating from the midline and slightly lower within the neutral level. Overall, it is recommended to treat gold operations with a wide range of fluctuations today!
Gold operation strategy at night:
Short order strategy: short near 3031 above, stop loss 3040, target near 3010;
We will update regularly every day and introduce to you how we manage active ideas and settings. Thank you for your likes, comments and attention, we are very grateful

GBPUSD Is due a correctionThe GBP/USD pair has been in a sustained uptrend for some time, and while I maintain a bullish outlook, a pullback or correction appears likely. Below, I’ve outlined key target levels where I anticipate potential price movements.
I’d love to hear your thoughts—let me know your perspective. If you found this analysis valuable, consider giving it a boost!

eurusd alternative 5 wave outlook buy dips tp 1100🏆 eurusd Market Update / Wednesday
📊 Alternative Technical Outlook
🔸Bullish OUTLOOK
🔸5 waves Bullish Sequence on H12
🔸0230/0530 w1, 0530/0290 w2, 0290/0935 w3
🔸0935/0675 wave 4 pullback now
🔸0675/1100 - final wave 5 pump
🔸Recommend to BUY DIPS 0675/0665
🔸Price Target BULLS: 1100 USD in Wave5
💶📉 EUR/USD Mini Market Recap – March 2025
🔹 🛑 Fed Holds Rates
📉 No rate cut yet, but hints coming soon 🏦📊
🔹 💵 USD Strength Rising
💪 US data strong + tariff optimism = dollar gains 💼📈
🔹 📉 EUR/USD Weakens
⚠️ Testing 1.0798 support, 1.06 may come next 🚨📉
🔹 📊 Key US Data Ahead
🕵️♂️ Core PCE inflation data could move EUR/USD fast 📆📊
🔹 🌐 Trade Tensions Return
🧨 Tariff talk adds pressure to euro and dollar 💣💬
