DXY|LONG UPDATEHello to everyone checking out this post!
Drop your thoughts in the comments! My outlook on the Dollar Index (DXY) is bullish. I believe it could start its upward move from the current level and continue its rally over the next few weeks. 📈🔥
Let me know what you think! 👇
DXY

Gold | Oil | Dollar | Silver | Natural Gas Price ForecastFutures Commodities Forecast | Gold | Oil | Dollar | Silver | Natural Gas Price Forecast
COMEX:GC1! NYMEX:NG1! NYMEX:CL1! COMEX:SI1!

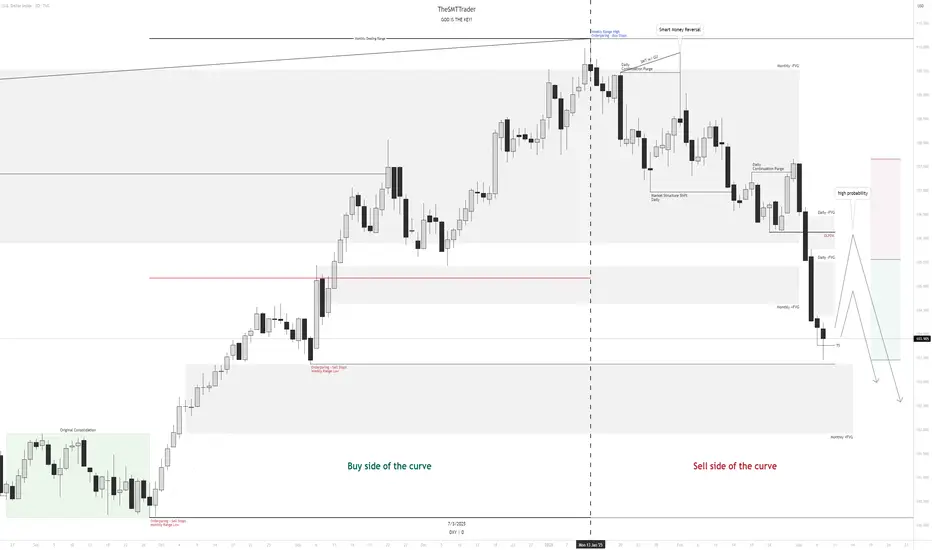
$DXY MMSMIn my view, the DXY could have a bullish bias this week, but only as a correction after last week's sharp drop. The main bias is still bearish, as we are on the sell side of the curve. Therefore, long trades should be approached with caution since the price can reverse to the downside at any moment—after all, the market is sovereign, and only it determines its movements.
I remain firmly bearish until the monthly range lows are taken out. I will only reconsider this outlook if the price holds at a high-timeframe PDA and institutional order flow (IOF) signals a potential shift in direction.
NZDJPY - 2025 Plan. Make It Your Best Year Yet!Here we have the 2 Day chart for NZDJPY.
We've seen a massive impulse mid 2024. We are now in an ABC correction.
We are currently in wave B of the correction, subwave B. Expecting subwave C to complete wave B.
We're looking for a rejection of the fib zone and a drop of over 700pips.
Trade idea:
- Watch for rejection of fib zone
- Once rejection appears, enter with stops above the highs
- Targets: 86 (350pips), 83 (700pips)
Once we've completed this move down, we'll be looking for longs. We'll update this setup if there's enough engagement.
Goodluck and as always, trade safe!

Dollar IndexWe are expecting Dollar to go up slowly, if CPI is planning top drop dollar in the later part of the week.

"EURNZD Bullish Momentum Continues: Next Wave After Retest"EURNZD has followed the predicted bullish momentum, currently trading at 1.89 and aiming for the 1.93 target. The pair remains strong within its uptrend, signaling continued buying pressure. However, a small retesting phase is likely before the next bullish wave, allowing the market to confirm support levels and attract further buyers. This setup aligns with the technical outlook, reinforcing the expectation of further upside movement.
A minor retracement or consolidation at current levels could offer a healthy correction, giving traders an opportunity to re-enter before the next surge. Fundamental factors, including recent economic data from the Eurozone and New Zealand, suggest a favorable scenario for EUR strength. If risk sentiment remains positive and the European economy continues showing resilience, EURNZD could gain further momentum toward the 1.93 target.
Traders should watch for confirmation signals such as increased volume, bullish candlestick formations, or breakouts from key resistance zones. If the pair successfully holds above its retesting level, the next leg of the rally could unfold, offering another profitable move. As always, proper risk management is crucial to navigate potential market fluctuations effectively.

EURUSDHello Traders! 👋
What are your thoughts on EURUSD?
The EURUSD pair has recently risen over the past few days, reaching a key resistance zone. At this level, we anticipate a correction before the price resumes its upward movement.
After pulling back to the identified support level, the pair is expected to continue its bullish trend toward the specified targets.
What are your thoughts on EURUSD’s next move? Share your insights below!
Don’t forget to like and share your thoughts in the comments! ❤️

DXYDollar currency index
Rejected from the high trend line..
Long term squiggly line played out abit differently to predicted but it's fallen back into range after a higher high not lower high
This is usually where crypto and stocks catch bullish waves..

DXY (Dollar Index) Ready to BUY? | Monthly FVG in Focus! 💰 Smart Money Preparing for a Bullish Move on DXY!
The US Dollar Index (DXY) is approaching a key Monthly Fair Value Gap (FVG), which could act as a strong demand zone. If price reaches this level, we will look for confirmation on lower timeframes (H4/M15) before entering buys.
🔍 Why is this Important?
✅ Monthly FVG as a High-Probability Buy Zone
✅ Institutional Order Flow Aligning for a Bullish Reversal
✅ Strong Demand Expected at FVG
✅ DXY Strength = Bearish Pressure on Gold & Majors
📊 Key Market Levels:
🔹 Monthly FVG Buy Zone:
🔹 First Target:
🔹 Breakout Confirmation Above:
🔹 Invalidation Below:
⚡ Trading Plan:
📌 Wait for price to reach the Monthly FVG
📌 Look for Bullish Confirmation on H4/M15 (BOS, CHoCH, Liquidity Grab)
📌 Enter Buys Once Institutional Reversal is Confirmed
📌 Manage Risk – Watch CPI & FOMC Events
💥 Stronger DXY = Weak Gold & Bearish Pressure on Majors!
💬 Are you buying DXY at the Monthly FVG? Drop your thoughts below! 👇
#DXY #DollarIndex #Forex #SmartMoney #ICT #SMC #Liquidity #TradingView #OrderFlow

GBP/USD 15-Minute Chart: Bearish Reversal at Harmonic CompletionThe chart showcases a well-defined harmonic pattern, the Shark, with the price reaching the terminal zone at 1.2670 , marked by a red downward triangle. This suggests a potential reversal zone where selling pressure may emerge.
Key observations:
The price has reacted strongly at the completion point, aligning with Fibonacci extensions.
Overbought conditions are evident in the RSI and other momentum indicators, indicating potential exhaustion of the bullish trend.
Target levels:
T1: 1.26241
T2: 1.25741
Suggests a possible downside move if the reversal confirms.
Traders should watch for bearish confirmation before entering short positions, while bulls may seek a break above 1.2670 for further upside.

DXY (Dollar Index) and Pamp/Dump BTC. Markets Cycles.USA Dollar Index + Bitcoin Pamp/Dump Cycles. Logarithm. Time frame 1 week. Minima and maxima of bitcoin secondary trends are shown. Everything is detailed and shown, including what everyone always wants to know. Cyclicality. Accuracy.
This is what it looks like on a line chart to illustrate simple things.

DXY Will Go UP! Buy!
Hello,Traders!
DXY keeps falling down
But the index will soon
Hit a horizontal support
Level of 103.610 and
After the retest a local
Bullish correction
Will be expected
Buy!
Comment and subscribe to help us grow!
Check out other forecasts below too!
Disclosure: I am part of Trade Nation's Influencer program and receive a monthly fee for using their TradingView charts in my analysis.

DXY will be fine (95)The dollar index expects to fall into the 95 area. Regardless of who wins tomorrow, the dollar will fall until 2025. The new government's realization of how sad everything is now will delay the process of a sound market. Vote!

CLOSED MARKET Review on Upcoming Week for Gold!Taking the time to empty out my thoughts as we get ready for another week. NFP last week held up a lot of price action that could of happened. now that we are past it we should get some significant moves. just have to wait for the killzones.

Gold XAUUSD Move 03-07 March 2025Technical Analysis & Trade Signal
Market Overview:
Current Price: Around 2,858.140 USD
Trend Analysis:
The price was in an uptrend but recently broke down, indicating a possible bearish reversal.
A key support level was broken, which is now acting as resistance.
Key Levels:
Resistance Zones:
Minor Resistance: 2,900 - 2,920 USD
Strong Resistance: 2,960 USD
Support Zone: 2,780 - 2,800 USD
Trade Signal:
📉 Sell Signal: If the price retests the 2,900 - 2,920 USD resistance zone and rejects downward, enter a short trade targeting 2,800 USD.
📈 Buy Signal: If the price holds support around 2,780 - 2,800 USD and starts moving up, consider a long trade targeting 2,900 USD.
👉 Confirmation: Use additional indicators like RSI, MACD, and volume to confirm the trade setup before executing.

USD | USD INDEX Weekly FOREX Forecast: March 10 - 14thIn this video, we will analyze the USD through the USD INDEX (DXY). We'll determine the bias for the upcoming week, and look for the best setups to take.
The USD is bearish, and there is plenty of economic news coming up this week. Should be plenty of opportunities from Tues through Friday.
Short term bullishness, in the form of a pullback, is potentially there. But longer term bearishness is likely to continue.
Enjoy!
May profits be upon you.
Leave any questions or comments in the comment section.
I appreciate any feedback from my viewers!
Like and/or subscribe if you want more accurate analysis.
Thank you so much!
Disclaimer:
I do not provide personal investment advice and I am not a qualified licensed investment advisor.
All information found here, including any ideas, opinions, views, predictions, forecasts, commentaries, suggestions, expressed or implied herein, are for informational, entertainment or educational purposes only and should not be construed as personal investment advice. While the information provided is believed to be accurate, it may include errors or inaccuracies.
I will not and cannot be held liable for any actions you take as a result of anything you read here.
Conduct your own due diligence, or consult a licensed financial advisor or broker before making any and all investment decisions. Any investments, trades, speculations, or decisions made on the basis of any information found on this channel, expressed or implied herein, are committed at your own risk, financial or otherwise.

Dollar $ Dump Is the TVC:DXY headed for 4th quarter 2024 levels? The TVC:DXY continues its downward spiral in spectacular fashion as tariff talk and continued global war footing dominate.

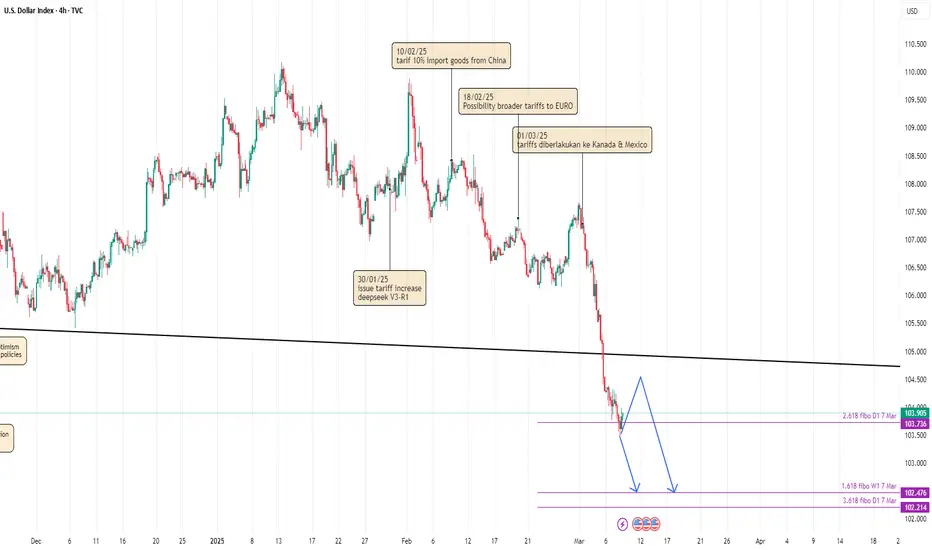
DOLLAR GAINS BUYER AMID NFP BAD DATA??Dollar seems on hold in it's 2.618 fibonacci support after NFP data released. Will it go higher next week?
I see dollar still waiting next data release. I mention JOLTS Job Opening & CPI which both of them crucial in current context of US macro-economy. Strong job opening & CPI means investor and retail trader must be no worries about US macro-economic despite concern about trade war. Otherwise, weak job opening & CPI means labor market and inflation continue cooling down. It will push THE FED to give clear path about their plan for future Interest Rate.
So, dollar could make sideways movement (or even gain buyer) but overall still in bearish momentum. Dollar still driven by concern of trade war and if job opening comes weaker than expected, it could gives more power to seller.
Dollar idex is ready to drop next week are you ready ?This week, the market was slow with little movement. However, starting next week, keep an eye on the dollar. The order flow is showing a strong sell, and the daily chart reveals an FVG that indicates a sell from this level. Additionally, the current low aligns with the monthly FVG level. Trading next week should be exciting!

Gold Bullish to $1,963- 1H TF (UPDATE)Gold Wave 5 (Major Wave Y) moving perfectly as I called for previously! We're seeing a nice push up towards our ATH target of $2,963 which could possibly hit next week.
Because this is the last 'impulse wave' to the upside (Wave 5), price has been moving slow. But that's the way the Elliott Wave Theory works. Last wave moves slow, in order to trap late buyers & sellers.

Digesting the US & Canada job numbers The numbers are out and, so far, the market is reacting logically. Let's dig in!
NASDAQ:AMD
NASDAQ:AVGO
NASDAQ:NVDA
MARKETSCOM:GOLD
MARKETSCOM:EURUSD
MARKETSCOM:DOLLARINDEX
MARKETSCOM:USDCAD
Let us know what you think in the comments below.
Thank you.
74.2% of retail investor accounts lose money when trading CFDs with this provider. You should consider whether you understand how CFDs work and whether you can afford to take the high risk of losing your money. Past performance is not necessarily indicative of future results. The value of investments may fall as well as rise and the investor may not get back the amount initially invested. This content is not intended for nor applicable to residents of the UK. Cryptocurrency CFDs and spread bets are restricted in the UK for all retail clients.

Chop Chop - VIX and DXY tell the tale An elevated VIX along with a declining DXY signals a choppy market and a great deal of uncertainty.

The Dollar's Demise May Not Be Over Just YetThe US dollar index is on track for its worst week in nearly two and a half years. It is also nearly 6% off from the January high, which is similar in depth to the two previous selloffs seen in 2023 and 2024. Yet I do not think we've seen the low just yet, even if there is evidence of a potential bounce on the daily chart.
Matt Simpson, Market Analyst at City Index and Forex.com
