Bearish drop?US Dollar Index (DXY) has rejected off the pivot and could drop to the 1st support that line sup with the 161.8% Fibonacci extension.
Pivot: 107.49
1st Support: 105.44
1st Resistance: 108.67
Risk Warning:
Trading Forex and CFDs carries a high level of risk to your capital and you should only trade with money you can afford to lose. Trading Forex and CFDs may not be suitable for all investors, so please ensure that you fully understand the risks involved and seek independent advice if necessary.
Disclaimer:
The above opinions given constitute general market commentary, and do not constitute the opinion or advice of IC Markets or any form of personal or investment advice.
Any opinions, news, research, analyses, prices, other information, or links to third-party sites contained on this website are provided on an "as-is" basis, are intended only to be informative, is not an advice nor a recommendation, nor research, or a record of our trading prices, or an offer of, or solicitation for a transaction in any financial instrument and thus should not be treated as such. The information provided does not involve any specific investment objectives, financial situation and needs of any specific person who may receive it. Please be aware, that past performance is not a reliable indicator of future performance and/or results. Past Performance or Forward-looking scenarios based upon the reasonable beliefs of the third-party provider are not a guarantee of future performance. Actual results may differ materially from those anticipated in forward-looking or past performance statements. IC Markets makes no representation or warranty and assumes no liability as to the accuracy or completeness of the information provided, nor any loss arising from any investment based on a recommendation, forecast or any information supplied by any third-party.
DXY

DXY Falling Below $106 - Cue AltSeason in March!The biggest shock to everyone is going to be the price of CRYPTOCAP:BTC going DOWN while ALTS skyrocket 🚀
As I have discussed in my macro thesis, the TVC:DXY is FINALLY breaking down on the Weekly along with the 10Y.
RSI has topped and Price broke below the WMA9 & 20.
Just waiting on the WMA9 to break below the WMA20 for final confirmation.
Historically when this happens...
it’s ALTSEASON BABY!!! 🥳
After this happened in March 2017,
BTC and ALTS pumped together,
then BTC went down 33% while ALTS exploded higher over a 3 week period before BTC rallied alongside again.

What Does GOLD want to do this week? We have to wait and see...Looking for a healthy retrace this week but I'm not sure just yet if they want to give it to us. We have to be patient and wait for the opportunity to presents itself. Waiting for the killzones is key.

Gold | Oil | Dollar | Silver | Natural Gas Price ForecastGold | Oil | Dollar | Silver | Natural Gas Price Forecast
COMEX:GC1! NYMEX:NG1! TVC:DXY AMEX:USO price forecast

DXY weekly Perspective 23.02.25DXY Analysis & Bias for This Week
My outlook for the Dollar Index (DXY) remains bearish, which aligns with my bias for bullish moves on pairs like GU, EU, and Gold. Since price has already broken structure to the downside, I anticipate a retracement to mitigate the newly formed 14-hour supply zone before continuing lower.
While price may react bullishly from the 3-hour or 2-hour demand zones I’ve marked, the overall momentum still favors the downside, as seen from the strength of recent bearish candlesticks.
Plan of Action:
📌 Once price reaches the 14-hour supply zone, I will wait for lower timeframe confirmations before taking action.
📌 I will also check for any corresponding demand zones on my other pairs to ensure alignment across the board.

DXY - 4H Bearish SignsTVC:DXY has shown an impressive rally from the 100 zone, forming three major bullish legs, each contributing approximately 4% gains. These bullish phases have now brought the index close to the critical 110 level.
However, in the third major leg, we observe the formation of three minor legs, signaling some hesitation as it nears the resistance zone. While many expect the index to break through 110 easily, I anticipate price swings around the 109-110 range, and even the possibility of a deeper pullback before resuming its upward trend.
With the NFP data release today, we might see increased volatility, offering opportunities for a potential DXY decline before any further rise. Stay alert for sharp market moves! 📉

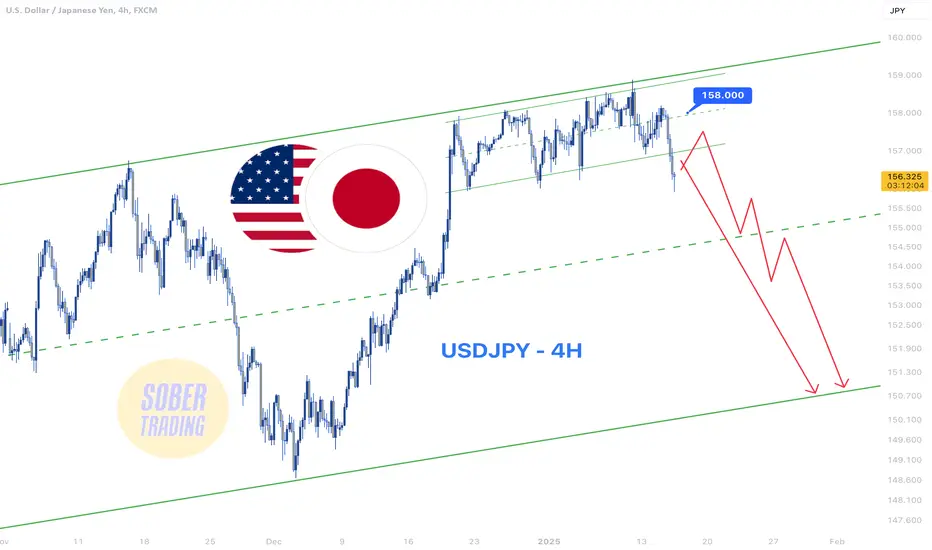
USDJPY - 4H Short Opportunities Amid DowntrendFollowing the sharp fall in FX:USDJPY after PPI and CPI news, we expect further downside, potentially reaching the middle or bottom of the channel. 📉
Each push-up could be a short entry opportunity. Even a strong rise below 158 might be a dead cat bounce and a better short entry point. Stay cautious and strategic! 🔻

DXY at a Deciding PointThe DXY has a slight bounce from the fib 0.786 golden pocket, but also at a neutral level of 107.158. I have plotted a trend channel from the higher timeframe which is marked by the dotted line.
At this point, I would take a wait-and-see approach in the coming weeks until a clear direction takes place.

USDJPYHello Traders! 👋
What are your thoughts on USDJPY?
The USDJPY pair has reached a support zone after its recent decline. We expect the price to complete a pullback to the broken level before continuing its downward movement toward the identified targets.
What’s your outlook on USDJPY? Do you expect more downside?
Don’t forget to like and share your thoughts in the comments! ❤️

GOLD week close review as we come to Month endLooking at how price has played out this week. Extremely bullish. We can get a continuation of the bullishness or get a significant pullback. We just have to be patient and wait for price to show us what it wants to do.

$DXY IdeaFor the DXY, we have an initial outlook of seeking internal liquidity in the discounted region of the monthly range, further reinforcing our bearish trend. Additionally, the presence of a **bottom SMT** in bonds, within a **bullish PDA**, suggests an upward movement for them.

DXY Week of 23 Feb 25: BullishFollowing the previous post, 24 Feb 25 may be the start of the bullish rally for DXY.
Possible Wyckoff Re-accumulation pattern
Falling Wedge hints bullish reversal
Liquidity Zone established
Plan to Long DXY and target for recent high, and stop loss at recent low. About 2.45 Reward:Risk Ratio

EUR/USD Market Analysis – Bearish Reversal from Key ResistanceThe EUR/USD pair has formed a bearish Bat harmonic pattern , completing near the 0.886 Fibonacci retracement level. Price action has reacted strongly at this resistance, indicating a potential reversal. The first target (T1) is around 1.0394 , while the second target (T2) is near 1.0325 , aligning with key Fibonacci levels. If the resistance holds, a bearish move towards these targets is likely. However, a sustained break above the high may invalidate the bearish setup. Traders should monitor price action closely for confirmation.

EURUSDHello Traders! 👋
What are your thoughts on EURUSD?
The EUR/USD pair is moving within an ascending channel and is currently testing the bottom of the channel. After some consolidation in this support zone, the price is expected to move toward the top of the channel.
What’s your outlook? Will EUR/USD move toward the channel’s top?
Don’t forget to like and share your thoughts in the comments! ❤️

DOLLAR INDEX (DXY): One More Bearish Movement
Dollar Index keeps updating the lows on a daily.
With a strong bearish movement, the price violated a key horizontal support yesterday.
Probabilities are high that the market will continue falling.
Next support - 106.15
❤️Please, support my work with like, thank you!❤️

Eur/Usd Major Area1.0444 to 1.0422 is a major area for euro...i'm waiting to see price react to this area or not...
.................................
( This is an idea and entry-tp-sl placed for my own trade , you can change entry-tp-sl depends on your risk management )

Will Gold give us a Break out before the week is over???Monitoring price to see if the go for a level they left behind. It could break out for the end of the week but I am doubting it and thinking they might save it for next week.

DOLLAR INDEX (DXY) – NEXT WEEK’S TRADE PERSPECTIVEDOLLAR INDEX (DXY) – NEXT WEEK’S TRADE PERSPECTIVE
Heading into next week, keep an eye on the upper zone around 108 and the 106 area. The DXY could make a short-term bounce toward 108, then continue its primary downtrend, aiming for 106.
Looking further down, starting around March, DXY is likely to trade below the 103 handle, indicating extended downside pressure.

AUD/USD Triangle Breakout (19.2.25)The AUD/USD pair on the M30 timeframe presents a Potential Buying Opportunity due to a recent Formation of a Triangle Breakout Pattern. This suggests a shift in momentum towards the upside and a higher likelihood of further advances in the coming hours.
Possible Long Trade:
Entry: Consider Entering A Long Position around Trendline Of The Pattern.
Target Levels:
1st Resistance – 0.6391
2nd Resistance – 0.6404
🎁 Please hit the like button and
🎁 Leave a comment to support for My Post !
Your likes and comments are incredibly motivating and will encourage me to share more analysis with you.
Best Regards, KABHI_TA_TRADING
Thank you.

Gold NEW ATH to $2,954?! (1H UPDATE)Gold on the 4H TF is within its final Wave 5 bullish move, there’s no arguing with that. The only thing to debate is how high can Wave 5 push up before reversing?
While it’s possible that Wave 5 has now peaked at $2,942 & ready for a major correction, on the 1H TF I see a small possibly of it creating a new ATH toward $2,954. HIGH RISK TRADE.
Confluences👇🏻
⭕️Distribution Schematic Taking Place Between Wave 3 High, Wave 4 Low & Wave 5 High.
⭕️Wave E Rejected From Psychological Number Of $2,940 (LQ Trap).
⭕️No Strong Sell Off Yet To Indicate A Reversal Has Started.

Daily DXY The US Dollar Index (DXY) is currently indicating the likely direction after closing below 106.965. I anticipate a move back to the 107.200-250 range before continuing its bearish swing. Several confluences support this, including the reversal point, an ascending trendline, a descending trendline, a rejection candlestick, the daily 0.382 Fibonacci level, the 4-hour 0.5 Fibonacci level, and a 4-hour order block. My target for the DXY is 106.083. As for gold, it has reached a new all-time high of 2954.944. I expect a pullback before it heads higher, potentially towards the 3000 level.
4hr DXY Chart
1hr DXY Chart
30m Gold Chart

DXY Is Very Bearish! Short!
Here is our detailed technical review for DXY.
Time Frame: 9h
Current Trend: Bearish
Sentiment: Overbought (based on 7-period RSI)
Forecast: Bearish
The market is approaching a significant resistance area 106.963.
Due to the fact that we see a positive bearish reaction from the underlined area, I strongly believe that sellers will manage to push the price all the way down to 106.002 level.
P.S
We determine oversold/overbought condition with RSI indicator.
When it drops below 30 - the market is considered to be oversold.
When it bounces above 70 - the market is considered to be overbought.
Like and subscribe and comment my ideas if you enjoy them!
