Waiting for #DXY correction H4. 21.10.2024Waiting for #DXY correction 📉
The dollar index has reached a strong daily sellers zone 103.63-104.23 and from this range I expect a downside exit. Special attention to the level 103.90 which is the border of a strong segment of accumulation in the past. It is logical to rebound above and enter the middle of the zone, and there we will consider reversals for the dollar and other currencies relative to it.
TVC:DXY
Dxyanalysis

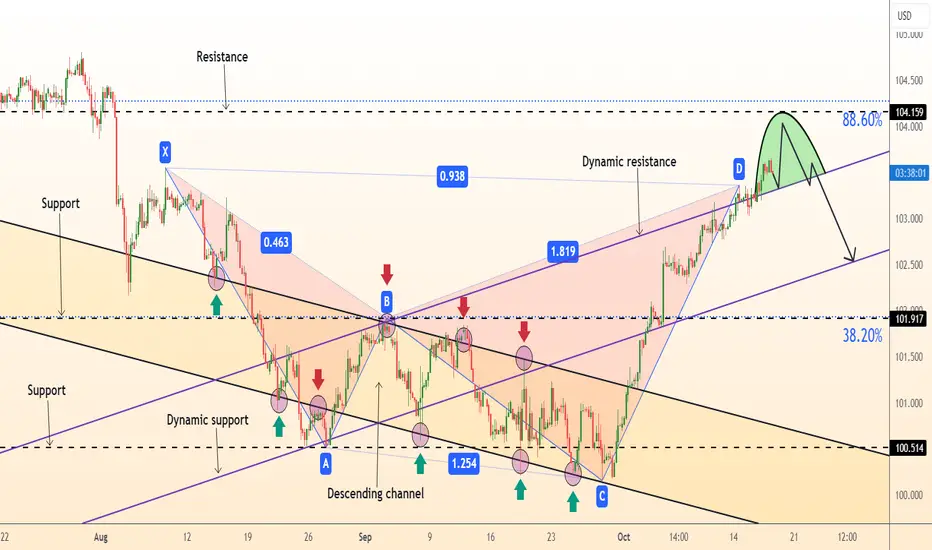
DeGRAM | DXY preparing for a reversal of movementDXY is moving above the trend lines and descending channel.
The chart has formed a harmonic bat pattern.
The price has not yet consolidated above the upper trend line.
We expect a reversal after consolidation under the dynamic resistance.
-------------------
Share your opinion in the comments and support the idea with like. Thanks for your support!
Waiting for the DXY correction H4. 17.10.2024 Waiting for the DXY correction
Ahead of the ECB meeting, the dollar index has reached a strong rotation level of 103.57 and the main question is whether there will be a reaction and correction downwards! There is also a spare resistance level at 104.20 and I do not rule out reaching it and then a serious correction to at least 102.28. There will definitely be volatility and it is important to watch the reaction through other currencies.
TVC:DXY

DeGRAM | DXY strong resistanceDXY is moving above the descending channel between the trend lines.
The chart has broken the descending structure.
The price has reached an important psychological resistance level.
We expect a decline if the chart fails to consolidate above the current level.
-------------------
Share your opinion in the comments and support the idea with like. Thanks for your support!

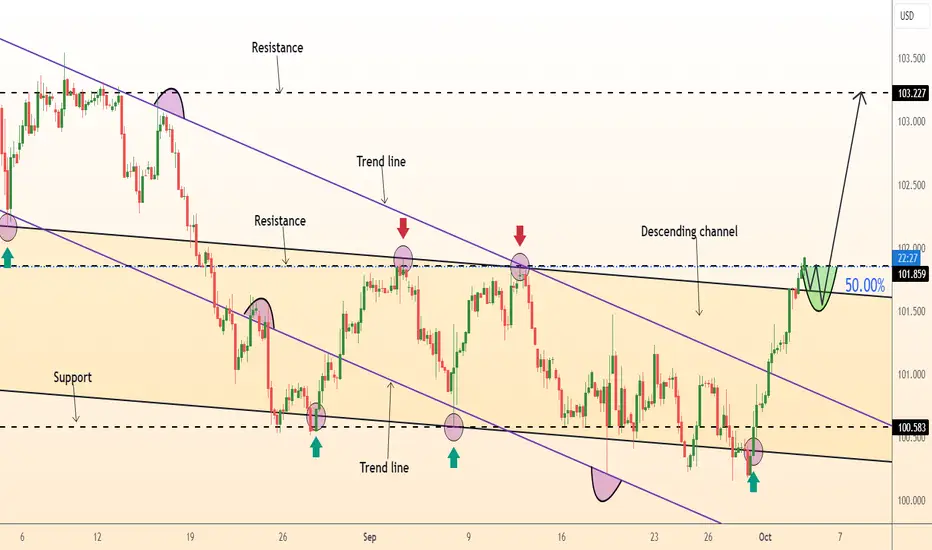
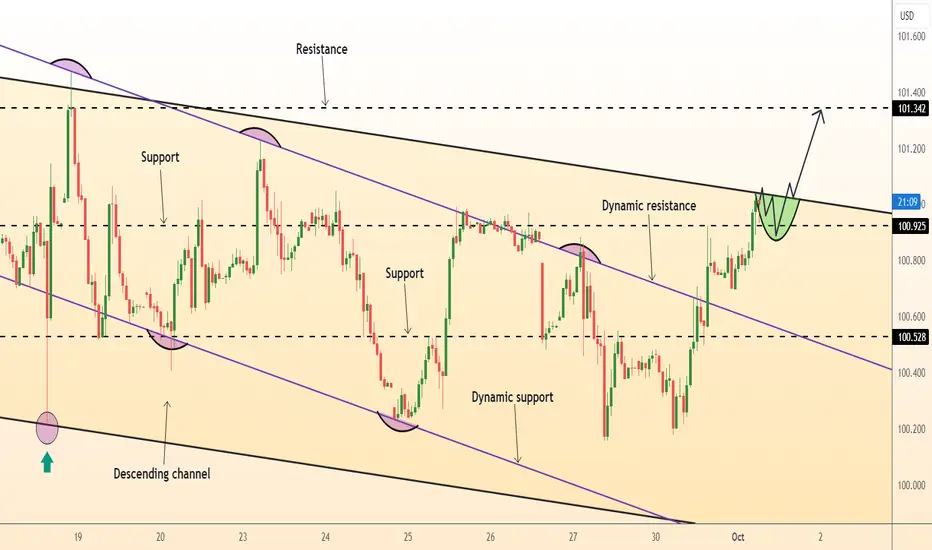
DeGRAM | DXY descending channel breakoutDXY is moving above the descending channel and trend lines.
The price broke through the resistance level, which coincides with the 50% retracement level of the bearish momentum.
We expect further growth after consolidation above the resistance.
-------------------
Share your opinion in the comments and support the idea with like. Thanks for your support!
DXY IndexPair : DXY Index
Description :
Elliot Waves 12345 Impulsive Waves and A Corrective Waves
Fibonacci Level 50.00 / 61.80
CHOCH
Breakout and Retracement of Bearish Channel
Demand Zone

DXY Bullish again? rally from 102.600 back upOnce price mitigates and retests the daily demand zone I’ve marked out, I’ll be looking for the dollar (DXY) to trigger another bullish move within this point of interest (POI), potentially leading to a rally that could take out another all-time high (ATH).
Upon reaching this daily demand, I’ll focus on finding a lower time frame entry. As price pushes up, taking out the liquidity and filling the imbalance, I’ll be watching for potential short-term sell opportunities from the daily supply zone, which looks like a high-quality area.
Confluences for DXY Bullish Move:
Recent Bullish Momentum: Price has been strongly bullish.
Break of Structure (BOS): A clear BOS to the upside, leaving behind a demand zone.
Liquidity and Imbalance: Liquidity targets and imbalance above, providing room for a rally.
High-Quality Daily Demand: The daily demand zone is strong and has a good potential for a bullish push.
P.S. I wouldn’t be surprised if the daily supply also holds and causes a deep retracement, but we’ll see how the market reacts.
Have a great trading week guys!

DXY Top Down AnalysisUtilizing the very effective and non-discretionary MAC strategy, coupled with lower timeframe divergences for entries, we take a look at DXY from the Quarterly, Monthly & Weekly perspective.
Have a great weekend.

Hotter-than-Expected CPI Prints: A Potential Catalyst for DXY an
Introduction
The release of Consumer Price Index (CPI) data is a highly anticipated event in financial markets, often influencing investor sentiment, currency valuations, and risk appetite. A hotter-than-expected CPI print, indicating higher-than-anticipated inflation, has significant implications for monetary policy decisions, particularly interest rate cuts. This article explores how such a scenario could strengthen calls to halt or even reverse rate cuts, potentially bolstering the US Dollar Index (DXY) and leading to increased risk aversion.
Understanding CPI and Its Impact on Monetary Policy
CPI is a measure of the average change over time in the price of a basket of goods and services consumed by households. It is a key indicator of inflation, which central banks closely monitor to assess the overall health of an economy. When CPI rises above the target inflation rate, it suggests that prices are increasing at a faster pace than desired, potentially eroding purchasing power and destabilizing the economy.
Central banks often use interest rates as a tool to manage inflation. By raising interest rates, they make borrowing more expensive, which can slow down economic activity and reduce demand for goods and services, ultimately putting downward pressure on prices. Conversely, lowering interest rates can stimulate economic growth but may also lead to higher inflation if demand outpaces supply.
The Implications of a Hotter-than-Expected CPI Print
If a CPI report comes in hotter than expected, it suggests that inflation is running higher than anticipated. This could lead to increased concerns among central bankers and investors about the potential for inflation to spiral out of control. In response, central banks may feel compelled to pause or even reverse their monetary easing policies.
The prospect of higher interest rates can have a significant impact on financial markets. When central banks raise interest rates, it often leads to a stronger domestic currency relative to other currencies. This is because higher interest rates make the domestic currency more attractive to investors seeking higher returns on their investments.
In the case of the US Dollar, a stronger DXY can have implications for global financial markets. A stronger dollar can make imports cheaper for US consumers but can also make exports more expensive for US businesses, potentially hurting economic growth. Additionally, a stronger dollar can put downward pressure on commodity prices, which can impact the profitability of commodity-producing countries and industries.
The Potential Impact on Risk Aversion
A hotter-than-expected CPI print and the subsequent tightening of monetary policy can also lead to increased risk aversion among investors. When investors become more cautious about the outlook for the economy, they may be less willing to take on riskier investments, such as stocks and emerging market bonds. This can lead to a sell-off in these asset classes, as investors seek to shift their portfolios to safer, more liquid assets like US Treasury bonds.
Conclusion
A hotter-than-expected CPI print can have significant implications for financial markets, particularly if it leads to a change in monetary policy. By strengthening calls to halt or reverse rate cuts, such a scenario could bolster the US Dollar Index and increase risk aversion. Investors should closely monitor CPI releases and their potential impact on central bank decisions and market sentiment.

DXY IndexPair : DXY Index
Description :
Completed " 12345 " Impulsive Waves and " A " Corrective Waves
Break of Structure
RSI - Divergence
Bearish Channel as an Corrective Pattern in Short Time Frame
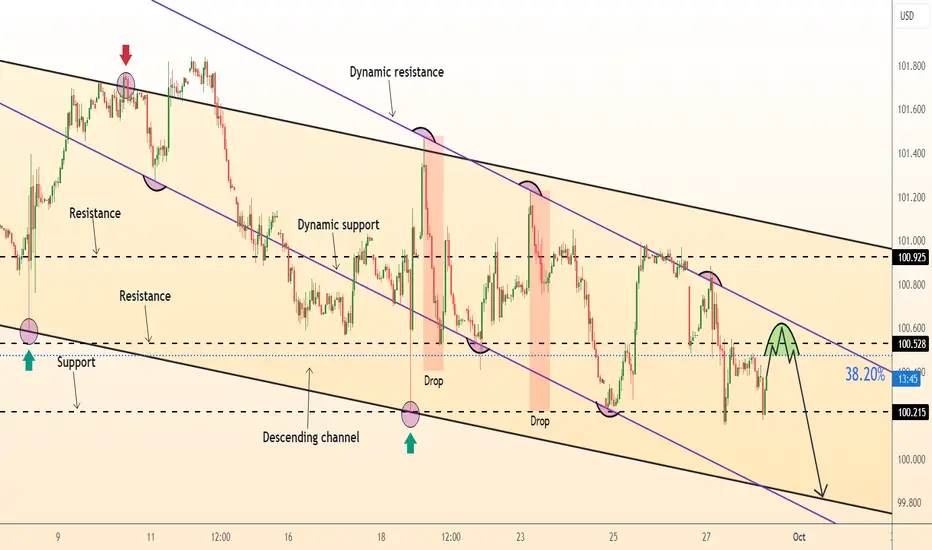
Fibonacci Level - 38.20%

Dollar Index rebound DXY higher. H4 07.10.2024 Dollar Index rebound DXY higher
Last week I was expecting a reversal of the dollar index up through a rebound lower. However, decided to go higher without a rebound on a more classic accumulation breakdown pattern. Now we came to a strong resistance level 102.30 from which I expect a corrective bounce down and then continued growth to the next resistance 103.06-103.35. A pullback is possible around 101.70+-.
TVC:DXY


DXY potential movementThe description on the chart
DXY future potential pathways. Potential pullbacks and reversal points.

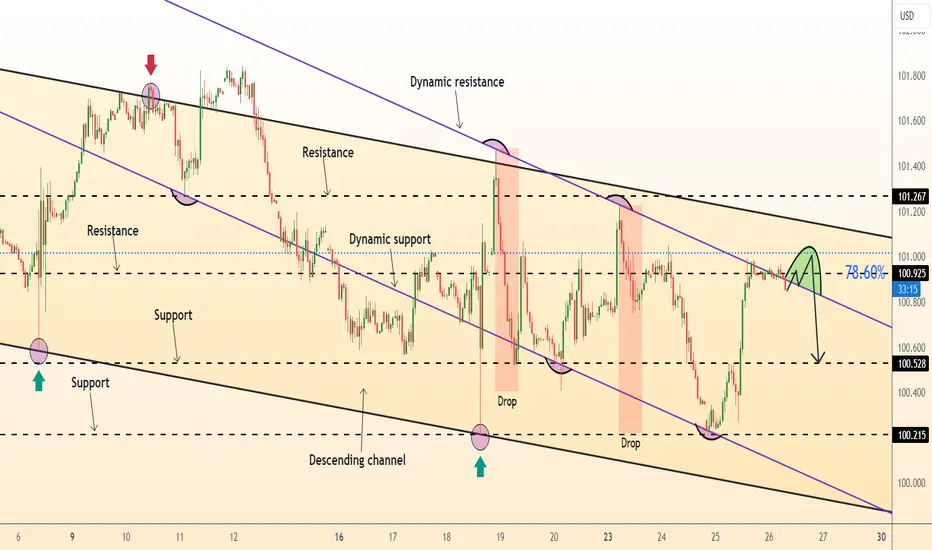
DeGRAM | DXY a pullback from the resistance levelDXY is moving above the descending channel between the trend lines.
The price reached the resistance level, after which it instantly reacted with a decline. This level has already acted as an important resistance and a pullback point last time.
The chart is moving from the upper trend line to the dynamic support.
We expect the pullback to continue after retesting the resistance level.
-------------------
Share your opinion in the comments and support the idea with like. Thanks for your support!
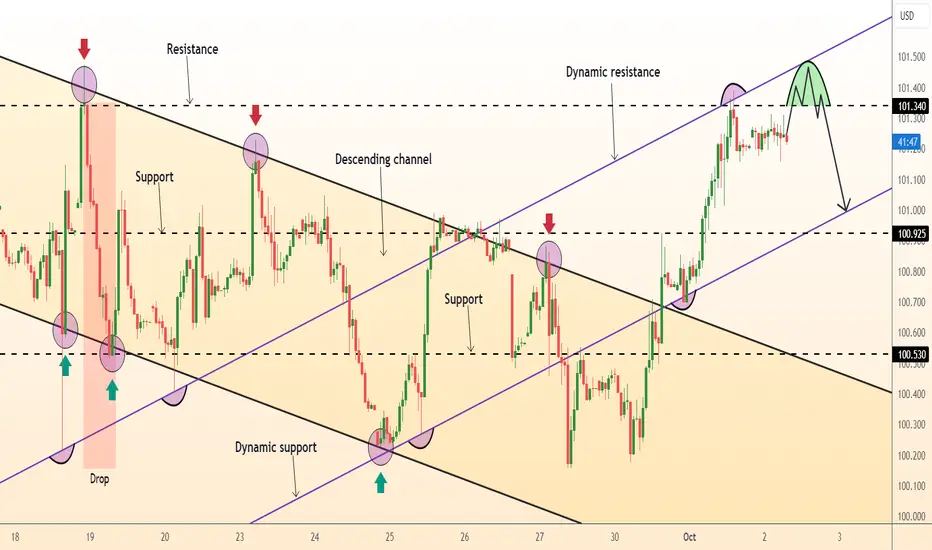
DeGRAM | DXY disruption of the descending structureDXY is moving in a descending channel above the trend lines.
Having bounced off the support, the price broke the dynamic resistance and approached the upper boundary of the channel.
The chart has broken the descending structure and is now above the resistance level.
We expect the rebound to continue after consolidation above the upper boundary of the channel.
-------------------
Share your opinion in the comments and support the idea with like. Thanks for your support!
DXY (Dollar Index) Technical Analysis and Day Trade Idea👀 👉 The DXY (Dollar Index) recently shifted into a bullish structure on the 4H timeframe, with price now approaching a key resistance level. This could present a potential short day trade opportunity. In this video, we analyse the DXY in detail, reviewing the trend, market structure, and price action, while exploring a possible trade setup. Disclaimer: Forex trading carries significant risk, and market conditions can change rapidly. The information provided is for educational purposes only and does not constitute financial advice. 📉✅

DXY Pair : DXY Index
Description :
Completed " 12345 " Impulsive Waves
Break of Structure
Resistance Level
Bearish Channel as an Corrective Pattern in Short Time Frame
Fibonacci Level - 38.20 / 50.00

Continued fall of the dollar index DXY. H4 30.09.2024Continued fall of the dollar index DXY
The dollar index is moving downwards without changes. There was an attempt to trade, above which it was not allowed to consolidate and eventually fell. I showed this in the last analysis and now I am aiming at the support levels around 99.20. Perhaps they will just make a false update of the low and come back, it is not known in advance, but at the moment we are trading near the visible support and so far without an upward reaction. Therefore, 99.20 is the next strongest level in recent years and it is ideal to test it before a reversal.
TVC:DXY

DeGRAM | DXY decline from the trend lineDXY is moving in a descending channel between trend lines.
The descending structure is not broken.
The price is below the correction level.
The chart is moving between trend lines and has already reached the upper one.
We expect the decline to continue.
-------------------
Share your opinion in the comments and support the idea with like. Thanks for your support!
DeGRAM | DXY closed the gapDXY is moving in a descending channel between trend lines.
The chart maintains a downward structure.
After the decline from the dynamic resistance, the price formed a gap, which it successfully closed during the rebound after reaching the support level.
We expect the decline to continue after the retest of the trend line.
-------------------
Share your opinion in the comments and support the idea with like. Thanks for your support!

Study of DXY, Gold, and Fed Fund Rates using 200MA indicatorBlack line: DXY (U.S. dollar index)
Green line: DXY 200 week moving average
Yellow line: GC (Gold futures)
Blue line: DFF (U.S. Federal Funds Effective Rate)
Since 1971 when U.S. dollar went off the gold standard, there have been 6 instances when the DXY crossed below its 200 week moving average while it was rising. At closing on 27 September 2024 was the 7th instance of this DXY crossing.
Of interest:
Performance of gold when DXY crosses below, until DXY reaches a local minimum. Results are highlighted in purple boxes.
Of the 7 instances, interest rates were rising in 4, flat in 1, falling in 1, and presumed to be falling in the current scenario. The only rising rate period was 1985-92, when gold had a very marginal 4% gain. This was notably on the backside of the 1970's high inflation period. Technically, gold showed gains in all but 1 of these historical periods, with 1994-95 showing a 2% loss.
Conclusions:
1) DXY trend reversal downward is not always, or often, associated with a U.S. interest rate cutting cycle nor is it strongly correlated with gold price gains.
2) The start of a U.S. interest rate cutting cycle is not predictive of gold price gains.

DeGRAM | DXY reached the dynamic resistanceDXY is moving in a descending channel under the upper trend line.
The price has already reached the dynamic resistance, which has twice acted as a pullback point.
The chart is under the resistance level and the retracement level.
We expect a decline.
-------------------
Share your opinion in the comments and support the idea with like. Thanks for your support!
Dollar bulls are strong hereIt has now been exactly a month since the DXY dropped to its price at the start of the year, which also serves as a technical support level. The price has bounced back from this zone twice but has failed to break above the 102 resistance, falling back each time.
However, each time the bears attempted a decisive break downward, the bulls stepped in and pushed the price back up. Although the price did dip below the support zone on two occasions, these breaks were minor (around 0.2%) and did not qualify as significant.
Yesterday, the price once again reversed strongly from this well-established support zone. It seems as though the bulls are waiting for a catalyst to trigger a true reversal.
I anticipate that the USD will strengthen in the coming days and weeks.
A break above the 102 resistance would confirm a bottom and open the path for further gains, with 104 as the next target.
