Interpretation of ideas after gold opensTechnical pattern: This week, gold closed in a "shooting star" pattern, which is a common peak signal, indicating that the price of gold may face a correction or decline.
Influence of news: This week, affected by Trump's tariffs and dismissal of Powell, gold first hit a record high of 3500 due to its safe-haven properties. Then Trump's remarks changed, and the price of gold plunged from the high point to around 3260. Overall, it ended in a volatile situation under the uncertainty of tariffs, Powell's stay and interest rate cuts. If there are no new safe-haven factors in the market news, there is room for further decline in the price of gold.
Short-term trend analysis
Four-hour level: After the safe-haven, the price of gold rebounded at the low point of 3260, but was unable to continue near 3370. It is believed that the high-level selling repair and low-level buying intervention have affected it. The opening of the gold price next week may continue to fall.
Hourly level: Since the decline in the price of gold, the rebound strength has been insufficient. It rebounded twice near 3260 below, and the overall center of gravity was downward before crossing 3380. Next week, pay attention to the 3330-3346 range to determine the nature of the rebound at the end of this week. At the same time, pay attention to whether 3260 can be broken. If there is a break, you can look down to 3221.
Operational suggestions: Overall, the overall idea for next week will continue to be bearish. Pay attention to the resistance of the 3330-3346 range on the top, and try to go short if it is touched; the initial support below is 3260, and the bearish trend can continue to 3221-3219 if it breaks.
Suggestions for being stuck at high positions: For investors who are standing guard at high positions, if they can withstand the pullback of gold prices, they can continue to hold and wait for the return of their capital; if not, it is recommended to recognize the loss and leave the market first, and then enter the market after the gold price has adjusted to the right level.
Dxyanalysis

DXY USD INDEX FORECAST Q2 W18 Y25DXY USD INDEX FORECAST Q2 W18 Y25
Professional Risk Managers👋
Welcome back to another FRGNT chart update📈
Diving into some Forex setups using predominantly higher time frame order blocks alongside confirmation breaks of structure.
✅ U.S. dollar index is a measure of the value of the dollar against a basket of six foreign currencies.
✅The currencies are the Euro, Swiss franc, Japanese yen, Canadian dollar, British pound, and Swedish krona.
💡Here are some trade confluences📝
✅ Break an d close below July 2023 key 100.00 levels.
✅ Foresee a pull back to, weekly imbalance, daily order block, daily 50ema, weekly order block and or weekly 50 ema.
✅ Awaiting to identify a significant break of structure bullish to use the DXY as confluence for our trading week 18 of Q2 toward key points of interest mentioned above.
✅ Forecasting continued bearish pressure long term.
✅Initially bullish outlook however upon price turn around. DXY to break 100.000 level again.
🔑 Remember, to participate in trading comes always with a degree of risk, therefore as professional risk managers it remains vital that we stick to our risk management plan as well as our trading strategies.
Pairs to look out for -
EURUSD
USDCHF
USDJPY
USDCAD
GBPUSD
📈The rest, we leave to the balance of probabilities.
💡Fail to plan. Plan to fail.
🏆It has always been that simple.
❤️Good luck with your trading journey, I shall see you at the very top.
🎯Trade consistent, FRGNT X

DXY TRADING SETUPDXY TRADING SETUP
Confirmation are in sight!
Get ready for a potential DROP!
Stay tuned for updates and confirmation signals!

The gold weekly line is about to close and the short position coThe downward trend remains unchanged!
At the same time, after the current decline in gold, traders who have positions above should pay attention that the early morning rebound cannot exceed the stage pressure of 3292-3300. The larger the rebound, the weaker the downward momentum. After a continuous decline, the 3260 position can be seen below. After breaking, the 3230 point needs to be paid special attention to below. This is the golden section position of 50% retracement since the rise from 2956 to 3500 in this round. It is also a multiple resonance area in the trading concentration area. After reaching this point, traders who hold short positions should consider being more cautious.

4.25 gold short-term operation technical analysis!Spot gold suddenly fell sharply during the Asian session on Friday (April 25). At the end of the session, the current gold price was around $3,307/ounce, a plunge of more than $40 during the day.
Gold prices turned lower on Friday as hopes of a trade deal between China and the United States weakened safe-haven assets. The positive risk tone weakened the demand for safe-haven assets. In addition, optimistic US macroeconomic data on Thursday supported the dollar, which also hit gold prices.
Cleveland Fed President Hammack made it clear in an interview on Thursday that the Federal Reserve has basically ruled out the possibility of a rate cut in May. But she also released key information that if there is clear evidence of the direction of the economy, there is room for policy action in June.
Gold prices are currently supported near the $3,300/ounce mark, which is also the 38.2% Fibonacci retracement level of gold prices from this month's low (around $2,950/ounce) The latest round of gains is located.
If gold price falls below the $3300/oz mark, the next support for gold price is the weekly low near the $3260/oz area; if it falls below the above area, gold price may accelerate its decline and fall to the 50% retracement level (i.e. the area near $3225/oz) and finally fall to the $3200/oz mark. Some follow-up selling will indicate that gold has peaked and turn the short-term bias in favor of bearish traders.
Gold price resistance is around the $3368-3370/oz area, which should be a key level now. If it breaks through the above area, gold price may return to the $3400/oz mark. The subsequent rise may push gold price further to the $3425-3427/oz barrier. Once this barrier is overcome, bulls may retry to conquer the psychological $3500/oz mark.

Confrontation between India and Pakistan pushes for risk aversioYesterday, the gold market opened at 3291.1 in the morning and then the market rose directly. The daily line reached a high of 3367.7 and then fell under pressure. The daily line finally closed at around 3345, and the daily line closed with a long upper shadow line. After this pattern ended, the short positions at 3496, 3468 and 3442 this week were reduced and the stop loss was followed up at 3400.
SELL: 3340 Stop loss: 58
TP1: 3330
TP2: 3320
TP3: 3305
BUY: 3300 Stop loss: 3295-92
TP1: 3320
TP2: 3335
TP3: 3360
We will update regularly every day to introduce how we manage active thinking and settings. Thank you for your likes, comments and attention. Thank you very much

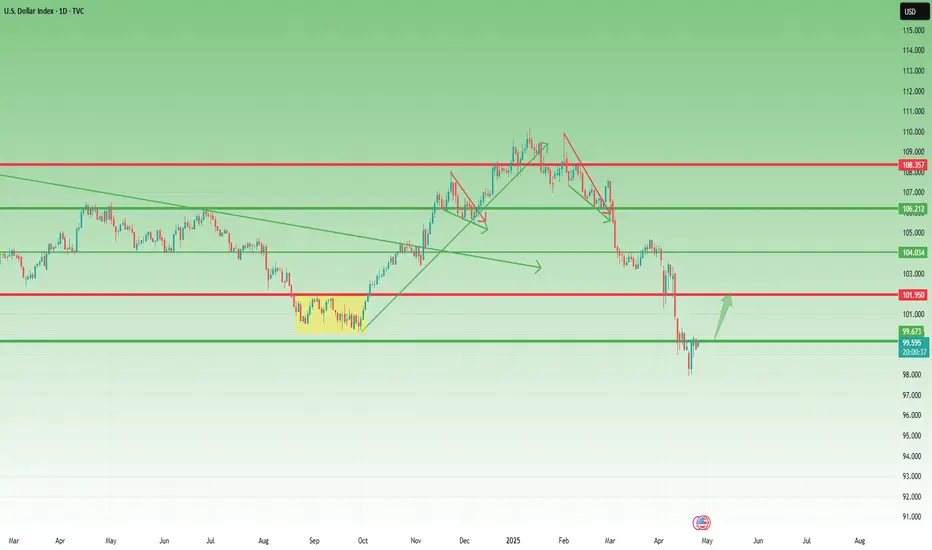
USD Index: A Possible Reversal in Sight?Since early February, right after Trump’s inauguration, the USD Index (DXY) has been under pressure, falling sharply by over 10%.
However, after hitting the 98.00 level, things seem to have stabilized. We're seeing the early signs of a relief rally.
🔍 Technical Perspective:
- This week’s candlestick pattern suggests a bullish reversal.
- The dip on Wednesday was quickly bought, showing buyer interest.
- A minor correction occurred yesterday, but dips are being well supported.
- Currently, the DXY trades around 99.60, just under the psychological level of 100.
🎯 Outlook:
As long as 98 remains intact, the bias shifts towards a potential rebound.
First target: 102 – a logical resistance zone and prior support.
This is not yet a confirmed trend reversal, but the price action is shifting. The key now is how the market reacts around the 100 level. A break above could trigger further bullish momentum.
Gold fluctuates in a wide range, and the short-term trend is upwGold fell by $240 in two trading days, but the rebound was also very fierce, from yesterday's low of 3260 to 3367 in the early trading. The current volatility is still very large. The high and low points of $100 often appear, and it is normal to fluctuate by dozens of dollars. So pay attention to the market. There is no shortage of opportunities. Just grab what you can grasp.
The daily cycle has stepped back to the MA10 position. It has entered a critical stage. If the bulls recover, the strong rhythm is still there. It is too early to say that the peak has been reached. Pay attention to follow the market and don't be stubborn. The short-term resistance is 3386 and the 618 position of the decline and rebound is 3408. It is recommended to wait and see in the European session and look at the trend. Intervene in the US session.

DXY "Dollar Index" Market Bullish Heist Plan (Day or Swing)🌟Hi! Hola! Ola! Bonjour! Hallo! Marhaba!🌟
Dear Money Makers & Robbers, 🤑 💰💸✈️
Based on 🔥Thief Trading style technical and fundamental analysis🔥, here is our master plan to heist the DXY "Dollar Index" Market. Please adhere to the strategy I've outlined in the chart, which emphasizes long entry. Our aim is the high-risk ATR Line. Risky level, overbought market, consolidation, trend reversal, trap at the level where traders and bearish robbers are stronger. 🏆💸"Take profit and treat yourself, traders. You deserve it!💪🏆🎉
Entry 📈 : "The heist is on! Wait for the MA breakout (99.900) then make your move - Bullish profits await!"
however I advise to Place Buy stop orders above the Moving average (or) Place buy limit orders within a 15 or 30 minute timeframe most recent or swing, low or high level for Pullback entries.
📌I strongly advise you to set an "alert (Alarm)" on your chart so you can see when the breakout entry occurs.
Stop Loss 🛑: "🔊 Yo, listen up! 🗣️ If you're lookin' to get in on a buy stop order, don't even think about settin' that stop loss till after the breakout 🚀. You feel me? Now, if you're smart, you'll place that stop loss where I told you to 📍, but if you're a rebel, you can put it wherever you like 🤪 - just don't say I didn't warn you ⚠️. You're playin' with fire 🔥, and it's your risk, not mine 👊."
📍 Thief SL placed at the nearest/swing low level Using the 1H timeframe (98.900) Day / Swing trade basis.
📍 SL is based on your risk of the trade, lot size and how many multiple orders you have to take.
🏴☠️Target 🎯: 101.400 (or) Escape Before the Target
🧲Scalpers, take note 👀 : only scalp on the Long side. If you have a lot of money, you can go straight away; if not, you can join swing traders and carry out the robbery plan. Use trailing SL to safeguard your money 💰.
💰💵💸DXY "Dollar Index" Market Heist Plan (Swing/Day Trade) is currently experiencing a Bullish trend.., driven by several key factors.☝☝☝
📰🗞️Get & Read the Fundamental, Macro, COT Report, Geopolitical and News Analysis, Sentimental Outlook, Intermarket Analysis, Index-Specific Analysis, Future trend targets with Overall outlook score... go ahead to check 👉👉👉🔗🔗
⚠️Trading Alert : News Releases and Position Management 📰 🗞️ 🚫🚏
As a reminder, news releases can have a significant impact on market prices and volatility. To minimize potential losses and protect your running positions,
we recommend the following:
Avoid taking new trades during news releases
Use trailing stop-loss orders to protect your running positions and lock in profits
💖Supporting our robbery plan 💥Hit the Boost Button💥 will enable us to effortlessly make and steal money 💰💵. Boost the strength of our robbery team. Every day in this market make money with ease by using the Thief Trading Style.🏆💪🤝❤️🎉🚀
I'll see you soon with another heist plan, so stay tuned 🤑🐱👤🤗🤩

Gold profit taking continuesThe gold market opened at 3337.5 yesterday due to the profit-taking of the previous day. After the market fell back to 3315.6, the market rose strongly to fill the gap. The daily line reached a high of 3386.7 and then fell strongly. The daily line reached a low of 3259.6 and then the market consolidated at the end of the day. The daily line finally closed at 3287.9 and the market closed with a long upper shadow line. After this pattern ended, today's market continued to be empty. In terms of points, the short positions at 3496, 3468 and 3442 the day before were reduced and the stop loss was followed up at 3400.
SELL:3340 45 50 Stop loss: 55
TP1:3330
TP2:3320
TP3:3300

DXY - Near TopThe dollar index is showing weakness.
Considering the chart and Trump's policies to support domestic production, interest rate cuts, and other macroeconomic policies, it seems that we will soon be on a downward trend.

Gold continues to pull back to the turning point!!!In the 4-hour chart, the price found support near the 3284 area (the recent swing low) and rebounded. Buyers stepped in at this position and set risk below this support level in an attempt to push prices higher again. Sellers hope that the price will fall below this level to push the price further down to the 3167 area.
1-hour chart
On the 1-hour chart, a short-term downward trend line can be seen, which is currently limiting the market's bullish sentiment. Sellers may establish positions near this trend line and set stops above the trend line with a target of 3167.

Analysis of gold short-term operation ideasGold price is currently trading below 3330. The downward trend in Asian session broke through the 3315 position in the morning. Our short position also successfully harvested a wave of big profits. Gold price showed signs of rebound in early European session. Now the upper pressure level can be moved down. The short-term pressure level is 3318, followed by the second highest point on the way up at 3357. The lower support level focuses on 3285. After effectively breaking through, we can focus on 3245. Now gold price is trading near the early low of 3315. The prudent operation idea is to go short at 3320 for protection at 3331 and wait for the gold price to reach 3285. After the break, wait for the rebound to 3300 and go short again to see the position of 3245. Long positions are not recommended.

Interpretation of gold short-term operation ideasThe gold market opened at 3423.4 in the morning yesterday, and then the market fell back to 3411.6, and then the market rose strongly. The daily line reached a high of 3500.4, and then the market fell under technical pressure. Subsequently, the market took profits and went down. The daily line gave a low of 3365.8 and then the market consolidated. The daily line finally closed at 3381.2, and the market closed in an inverted hammer pattern with a very long upper shadow. After the end of this pattern, the market continued to be short after opening low today. In terms of points, yesterday's short positions at 3496, 3468 and 3442 were reduced, and the stop loss was followed up at 3445. If it opens low today and falls directly, give 3292 long stop loss 3285. The target is 3336, 3350, 3365 and 3374. Exit the market and continue the short stop loss at 3381. The target is not released and the loss is held in stages.

Tariffs ease, risk aversion drops, gold continues to be bearishAfter hitting the integer mark of 3500 yesterday, gold fell back by nearly 200 US dollars. Today's early trading opened lower and directly swallowed up the overall rise of yesterday. Will gold continue to correct or turn around?
From the current decline, the range from the high point of 3500 to the current low point of 3315 is close to 200 US dollars. Considering this round of decline, it has exceeded the range of short-term correction. Therefore, traders should guard against the probability that the gold price will enter a turning point in the short term!
After the current decline is too large, the main area is to go sideways to correct the main force. The overall rebound will not be too large.
Main area: around 3380-3400
Defensive support below: double bottom around 3280
Operation suggestion: Do not carry orders, heavy positions, lock positions in sudden change cycles, and bring stop losses! "Specific operations are subject to actual trading"

Gold hits 3500 retracement adjustmentGold Technical Forecast:
From a technical perspective, gold is confidently moving along a bullish trajectory. There is no doubt about that. But the signals now sent by the Relative Strength Index (RSI) and other momentum indicators are worth paying attention to. The daily RSI reading is close to 80, which has entered the severely overbought area. However, this does not necessarily indicate impending doom. It just confirms what we already know: buyers are in control.
So, is the price close to a top? Possibly. But I would not sound the alarm bells just yet. These high indicators are more of a warning than a battle cry. It is more of a "stay alert" than a "get out of here".
Spot Gold Technical Levels to Watch
Gold's climb to a record $3,500 was impressive, but as expected, it has begun to retreat slightly from this psychological high, most likely due to some conventional profit-taking. There is no natural resistance above this level; all we have are round numbers. However, on the way down, the situation is different.
Technical Analysis
Initial support includes Monday's high of $3,430 and the round number mark of $3,400 on the daily chart. Looking further down, $3,357 is last week's breakout level, followed by reliable support at $3,300. If a more meaningful pullback occurs, $3,245 and $3,167 will be worth watching, both of which were previous resistance ranges and are now likely to become support levels.

Gold price breaks through a new high of 3500 and enters the key Gold price hit a new record high of 3500. After reaching this point, it showed obvious pressure and went down to find the 3461 area. This is the largest correction since the rise of 3284 last Thursday.
Today's early trading price also continued to rise and break through the new high, but there was an episode, that is, it first broke through the high of 3444, then fell sharply to 3412, and finally confirmed the strong rise at 3418 to break through the new high, and continued to break through the sprint
Until noon, it sprinted to 3495 and suppressed the decline to find 3473 support, and then pulled up again to sprint to break the high of 3500. This time the decline was relatively strong, falling to the 3461 area
So far, the rising process can be slightly slowed down and enter a wave of adjustment
Accumulate momentum to provide power for the next round of start-up
During the adjustment process, pay attention to the golden section line
This wave from Since the rise from 2970, the largest adjustment squat is 0.382, and now this position is 3417, which is close to the Asian market acceleration starting point 3418. The two together become the stabilizer of the bullish trend: 0.382 position 3417 area
This is the first focus of today. During the adjustment process, pay attention to the position of the golden section line
0.382 position is 3417, close to the acceleration starting point
0.500 position is 3391, close to the 3384 area along the channel line
0.618 position is 3366, close to the four-hour lifeline
The current price space is large and the speed is fast. Articles and analysis are only auxiliary, and are more temporary reminders. Plans cannot keep up with changes. The three key points mentioned above can be kept in mind. If there are price variables during the process, they can also be adjusted accordingly.

Gold 3500 mark is about to openThe gold market opened at 3331.4 yesterday morning, then fell back slightly to 3328.6, then strongly fluctuated and pulled up, breaking through the previous week's high of 3358 and the pressure of 3387 and the 3400 integer mark, and then reached the highest position of 3430.8, and then the market consolidated. The weekly line finally closed at 3424.8, and the market closed with a basically saturated big positive line. After this pattern ended, today's market still has bullish demand driven by risk aversion and bullish sentiment, with the target at 3465, and the break at 3480 and 3500

Elliott Wave Principles: A Study on US Dollar IndexHello friends, today we'll attempt to analyze the (DXY) US Dollar Index chart using Elliott Wave theory. Let's explore the possible Elliott Wave counts with wave Principles (Rules).
We've used the daily time frame chart here, which suggests that the primary cycle degree in Black weekly wave ((A)) and ((B)) waves have already occurred. Currently, wave ((C)) is in progress.
Within wave ((C)) in Black which are Weekly counts, Subdivisions are on daily time frame, showing Intermediate degree in blue wave (1) & (2) are finished and (3) is near to completion. Post wave (3), we can expect wave (4) up in Blue and then wave (5) down in Blue, marking the end of wave ((C)) in Black.
Additionally, within blue wave (3) Intermediate degree, we should see 5 subdivisions in red of Minor degree, which is clearly showing that waves 1 & 2 are done and now we are near to completion of wave 3 in Red. followed by waves 4 and 5, which will complete blue wave (3).
Key Points to Learn:
When applying Elliott Wave theory, it's essential to follow specific rules and principles. Here are three crucial ones:
1. Wave 2 Retracement Rule: Wave two will never retrace more than 100% of wave one.
2. Wave 3 Length Rule: Wave three will never be the shortest among waves 1, 3, and 5. It may be the largest most of the time, but never the shortest.
3. Wave 4 Overlap Rule: Wave four will never enter into the territory of wave one, meaning wave four will not overlap wave one, except in cases of diagonals or triangles.
Invalidation level is a level which is decided based on these Elliott wave Principles only, Once its triggered, then counts are Invalidated so we have to reassess the chart study and other possible counts are to be plotted
The entire wave count is clearly visible on the chart, and this is just one possible scenario. Please note that Elliott Wave theory involves multiple possibilities and uncertainties.
The analysis we've presented focuses on one particular scenario that seems potentially possible. However, it's essential to keep in mind that Elliott Wave counts can have multiple possibilities.
I am not Sebi registered analyst.
My studies are for educational purpose only.
Please Consult your financial advisor before trading or investing.
I am not responsible for any kinds of your profits and your losses.
Most investors treat trading as a hobby because they have a full-time job doing something else.
However, If you treat trading like a business, it will pay you like a business.
If you treat like a hobby, hobbies don't pay, they cost you...!
Hope this post is helpful to community
Thanks
RK💕
Disclaimer and Risk Warning.
The analysis and discussion provided on in.tradingview.com is intended for educational purposes only and should not be relied upon for trading decisions. RK_Charts is not an investment adviser and the information provided here should not be taken as professional investment advice. Before buying or selling any investments, securities, or precious metals, it is recommended that you conduct your own due diligence. RK_Charts does not share in your profits and will not take responsibility for any losses you may incur. So Please Consult your financial advisor before trading or investing.

Interpretation of gold US market operation ideas! ! !Gold continued to be bullish in the morning, and the 3400 mark has been broken. How will it evolve next?
The US dollar index directly fell on Monday morning, and the US Y index fell by more than 8% this year, causing gold to rise in a variable. The rise in gold caused by this situation will be greatly adjusted due to the recovery of the US dollar! The key to winning or losing tonight lies between 20 and 22 o'clock.
If the US stock market opens, it will fall below the 98 mark due to the southward movement of the US dollar, creating a new low since April 2022! The market's trust in the US dollar as a global reserve currency has declined! The possibility of turning to other safe-haven assets has increased, thereby increasing the variable of gold rising.
If based on this logic, tonight's 20-23 o'clock cycle is the main winning or losing day of this week!
Hypothetical principle: If it is postponed to the north during the day, everyone should pay attention to the selling pressure near 3415. As the price changes, the selling pressure is more likely to occur! And the defense line will rise in each round of corrective retracement!
Short-term defense line: 3355-3370-3383-3392
Pressure level above: 3430-3458
Risk notice: 1. When everyone is paying attention, long positions may fall at any time, and the range will not be less than 50-80 points!
2. The decline of the US dollar index will lead to a collapse in futures, which will trigger a chain reaction. Traders will face the possibility of gold settlement to fill the gap in other markets!

Gold is hard to break through 4000, short sellers are coming
Gold prices rose strongly in the Asian session on Monday, approaching the historical high of $3,400 per ounce, as concerns about the global trade situation intensified and the dollar fell to a two-year low due to concerns about economic recession. Despite the overbought signal on the technical side, the market's expectations of the Fed's rate cut and trade concerns continue to attract safe-haven funds to flow into the gold market.
Technical side:
Gold opened higher on Monday and has now risen from 3330 to 3394, with a range of $65. At present, gold indicators are expected to be severely overbought and a large correction may be needed at any time. In addition, the main force continues to push up gold to prevent the main force from fleeing. Gold is mainly shorted at highs below the 3400 mark!
SELL: 3394 Stop loss 3405
TP1: 3375
TP2: 3360

Dollar index (DXY) Analysis DXY Analysis – General Outlook
This week’s analysis is more of a general overview, and it closely aligns with my view on EUR/USD. While I don’t trade DXY directly, I use it heavily as a confluence tool, so marking out its likely direction is key for aligning trades across other USD-related pairs.
At the moment, I’m favouring Scenario A, where I expect DXY to move a bit lower, accumulate, and then react from the 2-day demand zone. If that happens, we could see a bullish move on DXY, which would naturally result in bearish pressure for other pairs like EU and GU.
However, if price decides to retrace upwards first, there’s a clean supply zone that still needs to be mitigated. If that zone holds, DXY could continue its bearish structure for longer—meaning more bullish momentum across other major pairs.

Interpretation of technical analysis of gold market opening operDue to the influence of Easter, the market was closed on Friday this week. After hitting a high of 3357, gold also ushered in a short-term adjustment! In the previous interpretation, we also emphasized to everyone that after hitting a new high, we should guard against the pullback caused by profit-taking. Especially at the critical time point when the market is about to close, but this does not mean the end of the bullish trend. After the sharp rise in gold, although there is selling pressure, gold still rose by 2.5% this week and closed above 3300.
So how should we trade gold next week?
The biggest driving factor for the rise in gold prices this time is Trump’s repeated tariff policy, coupled with the recent tense geopolitical situation, and the pace of global central banks buying gold. In the medium and long term, it is still a driving force for gold to rise.
Short-term operation: Pay attention to the first support level, which is 3310, which has been touched many times.
Short-term key support below: 3285-90
Short-term focus on high points above: 3340-45
If the breakthrough accelerates to the historical high point, everyone should be cautious in chasing more!
