Long DXY...After firming ABCD pattern and touch lower band of channel, DXY is ready to goes high again.
Trade safe.
Good luck.
Dxyanalysis

DXY/USD ~ Bullish Reversal / Inverse H&S (1H)TVC:DXY chart mapping/analysis.
Bullish inverse H&S identified on lower timeframe charts, pending breakout confirmation.
Trading scenarios into EOY:
Inverse H&S breakout = extrapolated move into 23.6% Fib / ~106 horizontal line (yellow dashed) / upper range of descending parallel channel (light blue) confluence zone.
Breakout failure = re-test 50% Fib aka "Right Shoulder".
Further bearish capitulation = re-test lower range of ascending parallel channel (white) / Golden Pocket confluence zone.
Major macro economic news this week = higher probability of implied volatile swings in either direction.

Weekly DXY Breaking Down Below 103 = Bitcoin and Crypto RallyThis is a great looking chart of the DXY on a weekly time frame.
We have a huge Bearish engulfing candle forming on the DXY and breaking down below the 103 support level.
This is looking very Bullish for Bitcion and the Total Crypto Market Cap.
Also notice what happened after the last Bearish engulfing candles in October and November.
This is great to see, after 11 straight weeks of Bullish Green weekly DXY candles prior to that.
This is starting to look very interesting, and as we know as the DXY falls, Bitcion goes up.
Also see my recent analysis on how we could see new highs by January, and $100k BTC by or before the Halving.
Let me know what you think!

DOLLAR INDEX TECHNICAL ANALYSISHere I present my technical Analysis For US Dollar Index which according to the Dow theory we are on a clear down trend.

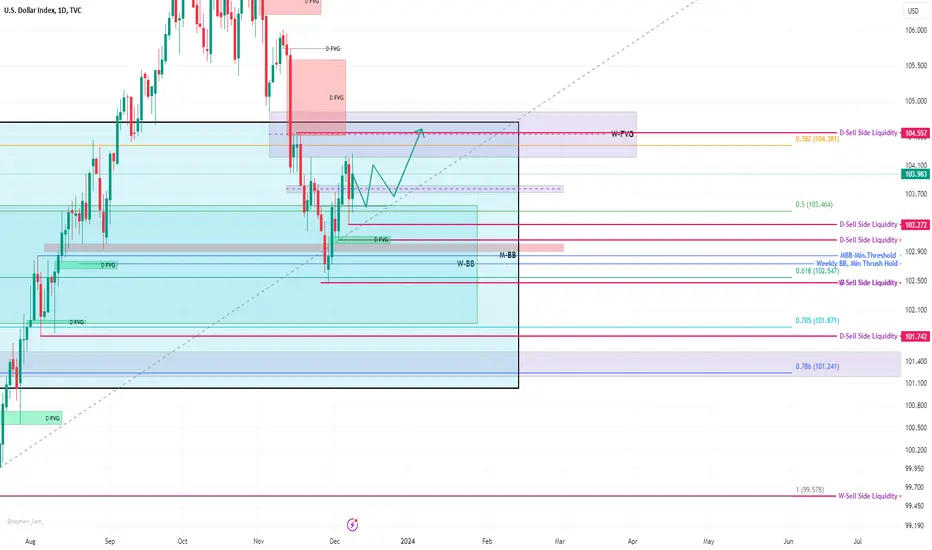
DXY Price Analysis-10 Nov, 2023Weekly: The PA has been rejected from the weekly breaker block-CE & M-BB C.E. W-IFVG has become the support. So we can anticipate that price could go upward at least towards the w-BB C.E.
Weekly Bias: Bulish
Daily: Daily the price has been closed above weekly FVG, so it may acting support. As there is D-SSL 104.557 which is aligned with W-SIBI-CE. As the price has been retested the w-BB and closed above so we can anticipated that the price will go for the D-BSL Level-104.557
Daily Bias: Bulish
DXY and 14 Levels: Understanding the Currency Pair's TargetsWhile Himino's speech is a crucial assumption for monetary policy and the longstanding dilemma regarding wages and prices, his journey is a speculative adventure on how the concept of Wages/Prices can depart from what he calls a frozen state. Next are deeper insights into how Himino perceives and examines wages and prices in relation to Japanese households, businesses, and financial institutions.
Himino then guides us through four stages of development, covering price fluctuations, labor costs, buying and selling prices, and wages.
Remarkably, as BOJ has demonstrated since 2016, Himino dismisses the Wages/Prices concept in stage 1, where uncontrollable prices arise from the West through imported inflation and market changes in oil prices. How to control imported inflation and oil prices without imposing an advanced concept like Autarky on Japan's prices.
As Himino points out in some cases, the complexity of Wages, Prices, and satisfaction to prevent deflation may never materialize.
Throughout the speech, Himino states that if the concept of wages/prices is satisfied, questions about monetary easing must be reconsidered.
Whether intentionally or not, Himino throws USD/JPY and cross-currency pairs into the mix.
A worrisome aspect of Himino's speech is how a speculative speech turns into psychological reports on negative interest rates, ultimately BOJ's most important December policy, the end of monetary easing.
Currency analysts and outspoken figures on leading websites in our era reveal that they can no longer fix it.
Stage 1: Businesses reflect higher import prices in selling prices.
Stage 2: Businesses reflect a higher overall price in wages.
Stage 3: Businesses reflect higher labor costs in selling prices.
Stage 4: Business price policies become more diverse, enabling them to explore strategies for selling more attractive products and services with corresponding prices rather than just good products and services at low prices.

Himino's Speech: A Deep Dive into Currency Pairs and Targets In a significant monetary policy speech, Himino introduced pivotal assumptions for wages, prices, and the prolonged dual downturn. The narrative explored how the concept of Wages/Prices might depart from what he termed a frozen state. Himino delved deeper into understanding and reviewing wages and prices concerning Japanese households, businesses, and financial institutions.
He guided us through four developmental stages involving price fluctuations, labor costs, buying and selling prices, and wages. Notably, in stage 1, Himino acknowledged the complexity of controlling imported inflation and oil prices without imposing a progressive concept like Autarky on Japan's prices.
Throughout the speech, Himino asserted that if the Wages/Prices concept is met, questions about monetary easing must be reexamined. Interestingly, Himino tactfully connected his speech to the USD/JPY movement and cross-currency pairs.
A notable aspect of Himino's speech is how speculative remarks turned into psychological reports on the last meeting of BOJ in December, highlighting the importance of the new monetary policy and the cessation of easing. Financial analysts and opinion leaders expressed their inability to repair the situation.
Himino outlined four stages: businesses reflecting higher import prices, businesses reflecting higher overall prices on wages, businesses reflecting higher labor costs in prices, and diversified price policies allowing businesses to explore strategies attractive in value instead of just focusing on low-priced goods and services.
In summary, Himino's speech touched on crucial economic concepts and their implications, sparking discussions on the future of Japan's monetary policy and its impact on currency pairs.

DXY Index 11-15 Dec MovePair : DXY Index
Description :
Completed Impulsive Waves " 12345 " and Corrective Waves " ab " at Daily Demand Zone or Fibonacci Level - 61.80%. It has completed the Retracement for Break of Structure. Bullish Channel in Short Time Frame
Entry Precaution :
Wait until Resistance React as Support

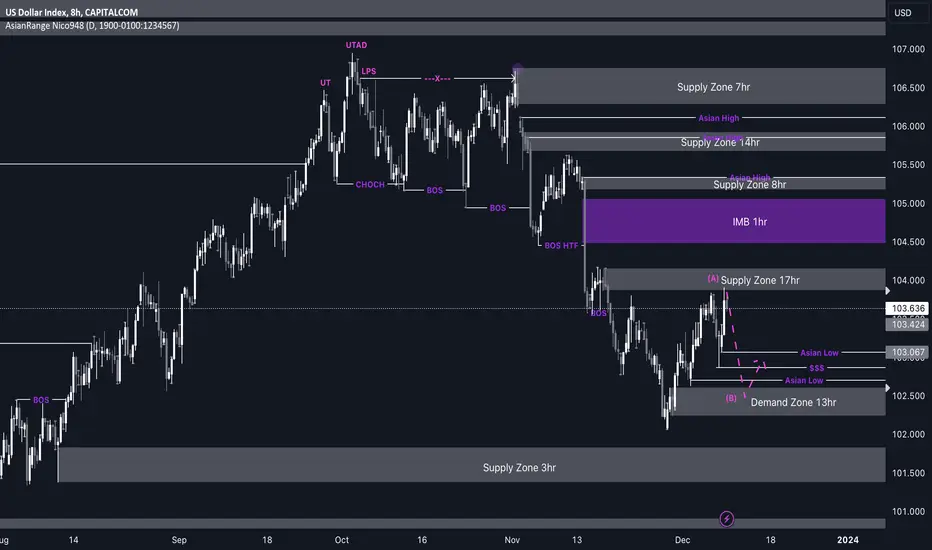
DXY (Dollar index) Shorts down to 102.500While the overall trend for the dollar remains bullish, recent weeks have witnessed a notable increase in downward movement. This suggests a potential continuation of the bearish patterns, prompting me to seek pro-trend trades aligned with this recent bias. Notably, with the price already having mitigated a supply zone, an anticipated drop towards the target of 102.500 seems likely.
The formation of Wyckoff accumulation signals a possible breakdown to surpass Asian lows. Additionally, considering that the price has left a demand zone at the projected target, we can expect a potential reaction in this zone. This reaction could potentially lead to the creation of new highs and a temporary bullish trend.
Confluences for DXY Sells are as follows:
- Dollar has tapped into a 17hr supply zone that has caused a BOS to the downside.
- Theres liquidity to the downside in the form of Asian low and trendline liquidity.
- Recent trend for this market has been temporarily bearish so this is a pro trend trade.
- If price wants to continue going higher, there are unmitigated demand zones that price needs to come and fill.
P.S Although the price has established a new bearish trend, it's possible that this is a strategic move to eliminate the trendline liquidity lingering from previous bullish rallies. Given the overall bullish sentiment on the higher time frame, it wouldn't be unexpected to witness the dollar initiating a new trend to achieve fresh highs.
103.100 Lows a Good target for NFP103.100 Looks a Sweet target for NFP.
Disclaimer - I don't Promote trading NFP

DXY Price Analysis-02-Dec-2023Weekly: Price has been Get rejected from the Bullish W-FVG & W-BSL, & M&W-BB-MinTh. As the price is respecting 4 weekly Pdarrays. So we can predict that in the up coming week the price movement will be upward towards the unmitigated W-FVG.
Weekly Bias: Bullish
Daily: As the bellow W-iFVG working as a support, So we can predict that in the upcoming week the price can go for the D-BSL -104.213.

DOLLAR INDEX FORECASTHigh speculation on upside, idea are 2, not quite fan on below, remember the fed not yet full blown the 2% inflation target, expect 1st Q of the year would be another rate hikes.
Skip what they are saying they will not tell it until its done.
This is only view on dollar index.
Wether we go higher next year or we go lower or they just wait for the US elections to rate again,
Trade at your own risk.
This is not a financial advice.
Follow for more higher context ideas.

DXY Index is Ready to Break the 🔴Resistance zones🔴✅It seems that the DXY Index finally managed to break the Descending Channel that it was in for more than one month .
💡I expect the DXY Index to take the help of the Uptrend line to break the Resistance zone ahead and it can break the minimum 🔴 Resistance zone($104.20-$103.98) 🔴.
U.S.Dollar Currency Index ( DXYUSD ) Analyze, 4-hour time frame⏰.
Do not forget to put Stop loss for your positions (For every position you want to open).
Please follow your strategy; this is just my Idea, and I will gladly see your ideas in this post.
Please do not forget the ✅' like '✅ button 🙏😊 & Share it with your friends; thanks, and Trade safe.

DXY - DISCOUNT VS USD?DXY - DISCOUNT VS USD?
In my opinnion, this is just a discount for a possibilty tu long again AUD,EUR, etc..vs USD.

DXY BUY ON DIPS !!!HELLO TRADERS!!!
As we can see DXY has reached @ strong support zone and we are looking for retrace for testing last broken resistance area so i am expecting this support will create a short term buying opportunity so we will see these following TPs will hit our targets its just an a trade idea kindly share ur views and analysis it will help alote of new traders we appreciate your love and support
stay tuned for more updates

USD 3 Scenarios for this week and next oneUSD 3 Scenarios for this week and next one
- Scenario #1: where price will just start to move to the downside as we are now at the 78.6% fibo retracment.
- scenario #2: where price might move to the upside first to liquidate the last LH before moving to the downside (IF ANY)
- Scenario #3: where price will go to the upside first to retest the 105 level as resistance (as the price didnt do so since it did break this level as support

🗺️DXY Index Roadmap🗺️⏰(4-hour time frame)⏰🏃♂️The DXY index has been moving in a Descending channel for a month .
🌊According to Elliott's theory , it seems that the DXY index has completed its 5 downward waves near the lower line of the descending channel after breaking the 🟢Support zone($103.78_$102.93) 🟢.
💡Also, we can see Regular Divergence(RD+) between two Consecutive Valleys .
💡I expect the DXY index to move towards the upper line of the descending channel and in the first step, we have to wait for the middle line of the descending channel to be broken ( the middle line has already played the role of support and resistance ).
U.S.Dollar Currency Index ( DXYUSD ) Analyze, 4-hour time frame⏰.
Do not forget to put Stop loss for your positions (For every position you want to open).
Please follow your strategy; this is just my Idea, and I will gladly see your ideas in this post.
Please do not forget the ✅' like '✅ button 🙏😊 & Share it with your friends; thanks, and Trade safe.

DXY → Further gains likely above 103.57TVC:DXY regains the smile and advances to multi-day highs past 103.70 on Monday.
If the key 200-day SMA (103.57) is surpassed, the index is expected to face more sustained gains to, initially, the weekly top of 104.21 (November 22) ahead of the transitory 100-day SMA at 104.37.
In the meantime, above the key 200-day SMA, the outlook for the index is expected to shift to bullish.

DXY Hungry for some LowsAS DXY is Longer Term Bearish, and we have a Breaker Formation Inside a NDOG,
And we have a SIBI In Front, As an OB aswell, And we have Sellside Resting, Makes sense to me that it wanna Run those Lows.

dxyRegarding the dollar index, we must say that it has started a downward trend in the long term, and the green lines are considered as its most important supports. Its resistances have been identified.

DXY (Dollar$) Shorts down to 101.500The bias for the dollar this week remains bearish, leading me to anticipate further downward trends. Near the current price, there is a supply zone on the 3-hour chart where we'll wait for price redistribution. Following that, we'll await confirmation on a lower timeframe to execute the sell trade. Additionally, I anticipate a minor reaction from the 13-hour demand zone, presenting potential small buying opportunities.
Subsequently, we anticipate the price to continue its descent and then respond to a 3-hour demand at 101.500. This is where I expect the price to retrace upwards, providing a more favourable opportunity for a buy trade.
Confluences for DXY Shorts are as follows:
- The short term trend currently is bearish (with perpetual BOS's to the downside.)
- Trend lines below act as magnets, pulling the price downwards and encouraging a bearish continuation.
- To evoke a bullish reaction from the price next, there's a strong demand zone on the 3hr time frame.
- A clear 3-hour supply zone sits above the current price, where we can expect a bearish response.
- By the candle stick anatomy bearish candles are very strong, holding lots of momentum.
P.S. I also observe the potential for the price to rise, targeting a more favourable supply zone like the (7hr) to initiate a robust bearish movement. Despite the strong bearish trend currently, we will primarily seek opportunities aligning with the trend. However, the next viable counter-trend trade would be at the 3-hour demand level around 101.500.

DXY Price Analysis-30-Nov-2023As long as the price breaks the upper level of W-IFVG or down D-IFVG the market will be choppy.
Daily Bias: Neutral

DXY/USD~ Nov-Dec Snapshot (4H Intraday)TVC:DXY chart mapping/analysis for last week of November.
TBC further details/write-up via ideas section.
