DXY looks Bearish DXY looks bearish for me
TVC:DXY looking weak with rejection off the 50D SMA
Short the dollar, long everything else.
If we get this pullback its for usdxxx longs/xxxusd shorts
Favorite for shorts = GBPUSD
Favorite for longs = USDCAD
Dxyanalysis

DXY 1Hhello dear trader
I am still on sale, it is the end of the contraction cycle, they are working in such a way that they mostly lose money
this is institutional price action for dollar curency index
goood luck

DXY Analysis. CPI Day! No trade today!Hello Everyone. I want share my idea after we will get some news from CPI.
In my last analysis of DXY my price prediction still short (i will link that idea in this post) My price prediction is still Short. on high timeframe from weekly trendline we have some pretty bearish movements. I think until cpi numbers it will touch daily trendline then it will retest weekly trendline, if there will be not new sellers the price will brake easy that trendline.
TODAY I WILL NOT OPEN ANY TRADE UNTIL CHART WILL BE NOT CLEAR!
Good luck Everyone.

DXY Analysis. Crazy week incoming!!!Hello Everyone. I want share my idea about USD Index.
After big and strong downtrend dollar found strong buy LVL and from here it started uptrend but at high timeframe we see its still bearish. Friday we saw strong sell but its looks like new low, i think the little bullish trend will continue, it touch weekly trendline or daily resistance, and then we will see another strong bearish movement.
This trend started after unemployed/employed rate news, next week is more crazy, we have month cpi and other big news.
My price prediction is 2 side and simple.
1 Bullish - price has big reaction on this daily trendline, it brake daily resistance and weekly bearish trendline, then retest that zone and price is going up side.
2 Bearish - price going to weekly bearish trendline, from here it has big rejection and price coming down again, braking July low and test second big weekly resistance at 98.000 LVL.
Be Patient!!! Next week will be full of manipulations, Be carefully!!! Good luck everyone!!!

DXY 30Min Support and Resistance ZoneIn the realm of trading, every move matters, and the DXY 30-minute chart holds vital clues. Join us as we delve into the technical intricacies, uncovering the critical support and resistance levels that can shape trading decisions.
Support Levels:
101.7016: The primary foundation. A bounce from here could trigger a potential upward move.
101.5525: A step deeper into support. Watch closely for possible shifts around this level.
101.3313: The lowest support. If breached, it might hint at a more significant trend change.
Resistance Levels:
102.4500: The immediate challenge. A breakthrough here could pave the way for further upward momentum.
As always, keep in mind that markets are dynamic and can change rapidly. These levels are guides, not guarantees. Consider broader market factors, and use these technical levels wisely in your trading strategy. Stay vigilant and happy trading!

Short DXY again...Time to short DXY after touch upper line of the channel.
DXY will weak.
So, short all USD pairs.
Good luck.
Trade safe.

DXY Analysis H1Here is my analysis for DXY on H1 using Order Block. The price could go bullish, you can put a pending order on the Order block or find an entry on LTF within OB Zone. Trade Safe!

75: DXY's Reclaimed 102.6: Eyes on Long Positions around 102.4Greetings, traders! 📊📈
A new chapter is unfolding in the world of the DXY (US Dollar Index) as it resurfaces above the 102.6 mark. This resurgence has ignited discussions about potential long opportunities near the 102.4 region, presenting an intriguing prospect for those closely monitoring this market movement.
🔀 Shift in Dynamics:
With the 102.6 level now back in play, the landscape is shifting. This pivotal juncture, now functioning as a support-turned-resistance, signals a renewed bullish sentiment. Coupled with the proximity to the 102.4 zone, previously holding as a support, the stage seems set for potential long positions to come into play.
📉 Analyzing the Context:
For those considering a long play, it's essential to stay attentive to the prospect of a pullback toward the 102.4 area. This could be an opportune entry point, especially if accompanied by encouraging bullish confirmations such as robust candlestick patterns or indicators signaling an upward trajectory.
🎯 Strategizing for Profits and Risks:
As you craft your long strategy, mapping out profit targets around significant resistance levels or recent highs is prudent. Pair these targets with a well-placed stop-loss, likely positioned below the 102.2 level, to mitigate risk and cushion against potential adverse market movements.
📆 Event Sensitivity:
Maintain vigilance over forthcoming economic events or announcements that might sway the DXY's course. These factors, combined with the broader market sentiment, can play a pivotal role in shaping the outcome of your long-trade scenario.
🚧 Ready for Contingencies:
In the unpredictable realm of trading, having a contingency plan is a must. Should the DXY falter and dip beneath the 102.4 support, being prepared to reassess and recalibrate your trading approach is crucial.
📖 Unending Learning Journey:
Remember, the path of a trader is one of perpetual learning and adaptation. Take advantage of this opportunity to refine your technical analysis skills and deepen your grasp of market intricacies.
Disclaimer: This post is intended for educational purposes only and should not be construed as financial advice. Always conduct thorough research and seek guidance from financial professionals before executing any trading decisions.
Wishing you all success on your trading endeavors! 🚀📈📊


DXY Index New Week MovePair : DXY Index
Description :
It has Completed " 1234 " Impulsive Wave in the Pattern of Bearish Channel and Rejection from the Upper Trend Line with the Strong Bearish Price Action
Strong Resistance Level " 102.857 " , If breaks " 100.823 " then Long Term Sell

⚠️DXY will go DOWN(Short term)⚠️As I expected in the previous post, DXY reached the resistance lines.✅👇
💡If you look closely at the chart, you will notice that DXY is moving in an Ascending Channel .
💡It seems that DXY failed to break the resistance lines.
💡Also, we can see Regular Divergence(RD-) between consecutive peaks.
🔔I expect the DXY will go DOWN at least to the lower line of Ascending Channel.
U.S.Dollar Currency Index ( DXYUSD ) Analyze, 4-hour time frame⏰.
Do not forget to put Stop loss for your positions (For every position you want to open).
Please follow your strategy, this is just my Idea, and I will be glad to see your ideas in this post.
Please do not forget the ✅' like '✅ button 🙏😊 & Share it with your friends; thanks, and Trade safe.

DXY Hits a 3-Week High Following Fitch US DowngradeBrace yourselves because the DXY has just hit a 3-week high, thanks to the recent Fitch US downgrade. Talk about an unexpected twist, right?
Now, let's dive into the details. Fitch Ratings, the renowned credit rating agency, has downgraded the United States' credit rating, causing quite a stir in the market. As a result, the US dollar has emerged as a haven for investors seeking stability amidst uncertainty. Isn't it fascinating how the market reacts to unexpected events?
But that's not all! This turn of events presents a golden opportunity for traders like you to capitalize on the situation. With the DXY soaring, it's time to consider going long on the US dollar. By doing so, you can potentially benefit from its current haven status and ride the wave of this unexpected surge.
So, here's your call to action: seize this opportunity and consider going long on the US dollar. Keep a close eye on the market trends, analyze the charts, and make informed trading decisions. The profit potential is knocking at your door, and it's time to answer!
Remember, surprises like these are what makes trading so thrilling. Stay vigilant, stay informed, and don't hesitate to take calculated risks when the market throws unexpected curveballs your way.
As always, please conduct thorough research and analysis before making trading decisions. Market conditions can change rapidly, so staying updated and adapting your strategies is essential.

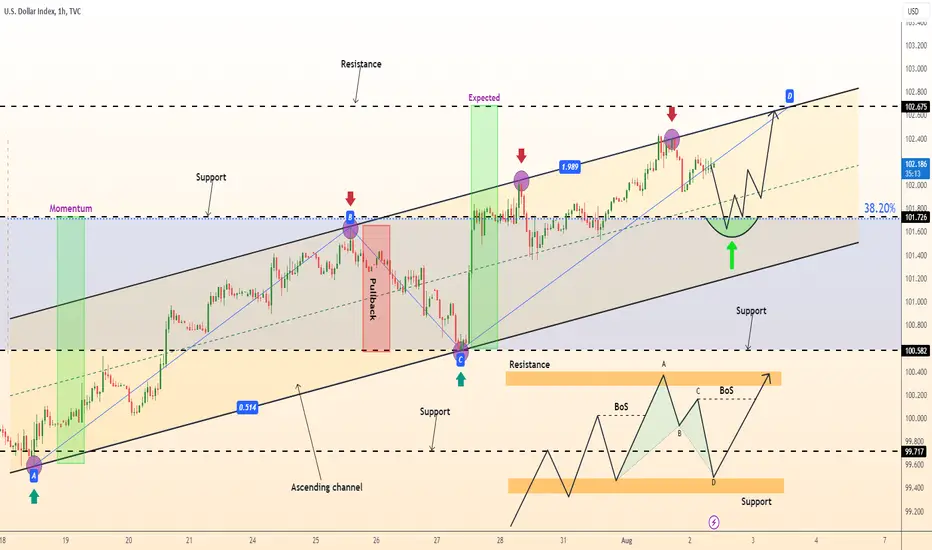
What do we expect from the DXY index this week❗️❓🚀The DXY index failed to break the 🟢 support zone($101.30-$100.82) 🟢 reliably, and with the Double Bottom pattern , it resumed its upward trend and formed a 🐻 Bear Trap 🐻.
💡Also, the DXY index issued a Buy signal through the 50-SMA and 50-EMA .
💡The Bullish Marabozu candle was also a sign and confirmation that DXY's fall below the support zone was just a Bear Trap.
🔔I expect the DXY to have a bullish trend this week and ⚔️attack⚔️ the resistance lines.
📚In general, I try to show you all the points of technical analysis on the chart, which also has an educational aspect(I apologize for the busy chart).📚
U.S.Dollar Currency Index ( DXYUSD ) Analyze, 4-hour time frame⏰.
Do not forget to put Stop loss for your positions (For every position you want to open).
Please follow your strategy, this is just my Idea, and I will be glad to see your ideas in this post.
Please do not forget the ✅' like '✅ button 🙏😊 & Share it with your friends; thanks, and Trade safe.

DXY Analysis 2Aug2023Dxy walked to the target that was analyzed a few days ago. I am still on the analysis that at this time it is still not proven to enter the bullish trend in full, it could be still in the correction wave.

DeGRAM | Dollar Index confluence levelDXY is approaching the major resistance level by making higher highs.
Price action may create an AB=CD pattern or an equal-measured move.
Price action created a nice long opportunity where a couple of confluence lines up with the support level.
Previous resistance becomes support; 38.2% fibo level bullish harmonic pattern and of course the price in the bullish trend.
-------------------
Share your opinion in the comments and support the idea with like. Thanks for your support!
DXY update in lower timeframehello dear trader
The chart specifies everything
institutional price action ...
stop loss need for any position
good luck
mehdi

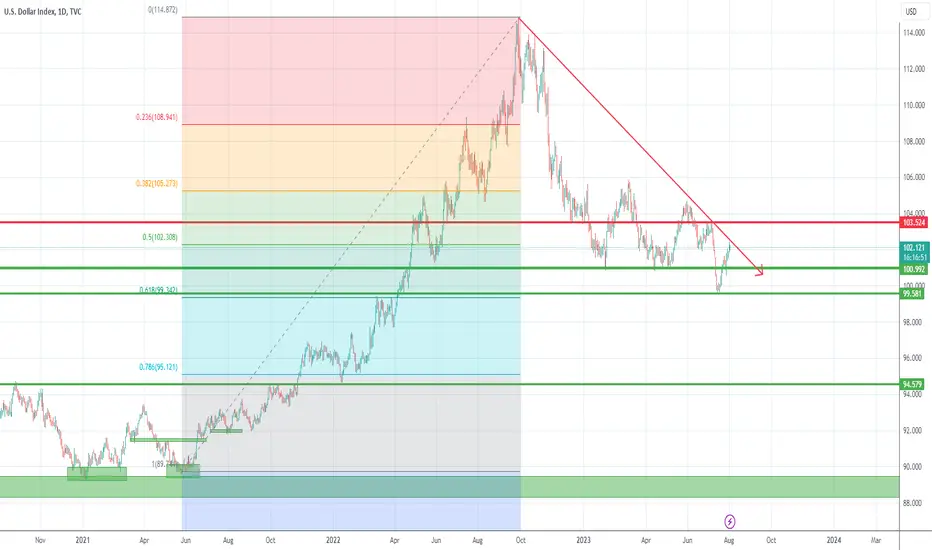
Have DXY bottomed?Since the top from October last year, DXY has been in a strong down trend.
However, considering the trend started back in May 2021, this is only a correction, in fact, it even stopped at the 0.618 Fibo.
The recent drop under 101 support was, in fact, a false break, one more reason to believe the Usd index found its bottom.
At this moment Dxy is trading in a confluence resistance: a recent low, and the falling trend line from the top, and a correction could follow.
This potential correction should be considered a good opportunity to sell Usd pairs and my main focus is on EurUsd and GbpUsd.
Only a drop back under 101 would change my bullish outlook for the index (bearish Usd pairs)
DXYThis is my view or anticipation on the dollar index, preferably for this month but we'll see how price plays out, this is just my anticipation with my understanding, it may be right and it also very much may be wrong.

📈DXY daily chart pattern📉TVC:DXY
CAPITALCOM:DXY
⚡These two scenarios are expected to occur in the dollar index. A break or resistance of the 103.285 level is very important to determine the continuation of the trend.
Please share ideas and leave a comment,
let me know what's your idea.
CrazyS✌

DXY / USD Index AnalysisDxy in the past week looks bullish, for next week in my opinion it will still look bullish with the formation of a bullish channel and the existence of a fairly thick bullish candle. For pairs that are counter to USD, the possibility of next week still looks weakening.

DXY Pull Back EntryRally base drop as some of you say make it simple and fun....And you know EURUSD and the Dollar Index are inverse so if the dollar index is dropping then the EurUsd id gonna sky rocket

DXY Elliott Waves AnalysisHello friends.
Please support my work by clicking the LIKE button👍(If you liked). Also i will appreciate for ur activity. Thank you!
Everything on the chart.
Main target zone: 96 - 94
Stop: ~103.7 (depending of ur risk). ALWAYS follow ur RM .
RR: 1 to 3
risk is justified
Good luck everyone!
Follow me on TRADINGView, if you don't want to miss my next analysis or signals.
It's not financial advice.
Dont Forget, always make your own research before to trade my ideas!
Open to any questions and suggestions

Beware of Relying on Dollar Price Moves to Predict Bitcoin's FutThe inverse relationship between the US dollar and Bitcoin has long been a reliable indicator for traders seeking to gauge the potential movement of the cryptocurrency market. Historically, when the dollar strengthened, Bitcoin tended to experience a decline, and vice versa. This relationship allowed us to make informed decisions and manage our portfolios effectively. However, it is essential to recognize that the dynamics of this correlation have started to shift, posing potential risks to our trading strategies.
Over the past months, we have witnessed instances where the US dollar has weakened while Bitcoin continued to soar to new heights. This decoupling of the two assets challenges the reliability of the inverse correlation we have grown accustomed to. While it is tempting to continue relying on this relationship, doing so mindlessly may lead us astray and result in significant losses.
Therefore, I strongly urge you to exercise caution and refrain from using dollar price moves to indicate Bitcoin's future direction. Instead, let us analyze the underlying factors that drive the cryptocurrency market, such as market sentiment, regulatory changes, technological advancements, and institutional adoption. By adopting a more holistic approach to our trading strategies, we can better position ourselves to successfully navigate the evolving landscape of digital currencies.
In light of these developments, I encourage you to diversify your sources of information and stay updated with the latest market news and expert opinions. Engage in meaningful discussions with fellow traders, share insights, and challenge conventional wisdom. By fostering a community that embraces critical thinking and adaptability, we can collectively navigate the uncertainties of this ever-changing market.
Remember, the cryptocurrency market is highly volatile and subject to various external influences. Relying solely on the inverse correlation between the US dollar and Bitcoin is no longer reliable. Let us be vigilant, open-minded, and proactive in our approach to trading.
If you have any questions or concerns, please do not hesitate to comment. Together, we can navigate these challenging times and adapt our trading strategies to ensure long-term success.
