DXY IndexDXY Index
Bearish Channel
CHOCH
Fibonacci Level 50
Break of Structure
Completed Impulsive Waves
Dxyforecast

Dollar Currency Index DXY Predicts Massive Crypto Bull RunHello, Skyrexians!
In crypto trading and investment it's vital to not only analyze some particular assets, but also macro charts. We have already considered the Bitcoin Dominance chart to predict potential altseason in this article . Today we have even more important asset, the TVC:DXY , which reflects in which type of assets investors are about to be in. When crisis happens investors are scared, selling risky assets and buy dollar. In the worthy times investor are greedy to risky assets and dollar currency index decreases. Today we will try to explain why DXY is about to crush giving liquidity to risky assets like our favorite crypto.
Let's take a look at the monthly time frame. It looks like DXY has ended the super cycle of any degree and now is printing correction. Waves A and B are likely to be finished already in this correction. The most impulsive wave C is incoming soon. To measure the targets we can use the Fibonacci retracement for the entire Elliott Waves cycle. Area between 0.5 and 0.61 is going to be our target. That's why we are waiting DXY between 88 and 93.
Inside this area we plan to wait for the green dot on Bullish/Bearish Reversal Bar Indicator which works great in the past. Important note here is that you have to disable MFI filter on this indicator to work correctly on DXY. As always, alerts from this indicator are automatically replicated on my accounts. You can find the information in our article on TradingView.
Best regards,
Skyrexio Team
___________________________________________________________
Please, boost this article and subscribe our page if you like analysis!

Unmasking DXY's Bullish Potential with Volume ProfileH ello,
The unusually high market activity around the 100.5 level indicated strong bullish accumulation. The yellow ellipses highlight the volume and price levels. You can see that volume decreases both above and below this key level. This accumulation is evident because the price broke out of a bullish consolidation pattern, as shown in the left yellow circle, reaching a high of 103.9, indicated by the yellow line. This is the current level, where you may notice exceptionally high market activity. As the price remains above the green demand zone, the red supply zone may be tested, as suggested by the volume profile.
Regards,
Ely

DXY ShortThis currency has been forming a descending flag, broke out of the structure and retested the higher high formed last week.
It has made a false break out (liquidity grab) and I anticipate that the price will build a bearish momentum to fill the second gap created by the previous week bullish impulse.
An analysis will follow using a shorter time frame.

DXY DXY Index
Change of Characteristics
Bullish Channel as an Corrective Pattern in Short Time Frame
Break of Structure and Retracement
RSI - Divergence
Completed " 12345 " Impulsive Waves

DXY DXY Index
Change of Characteristics
Bullish Channel as an Corrective Pattern in Short Time Frame
Break of Structure and Retracement
RSI - Divergence
Completed " 12345 " Impulsive Waves

DXY ShortBased on the previous analysis using a higher timeframe, I have analysed that we expect a bearish momentum from this trade.
Based on the 15 min timeframe, the price has retested and rejected the zone, forming an inverted hammer candlestick. I do anticipate that a bearish momentum is been formed.
Entry price at 106.9, SL at 107.2 and Target at 105.5

Dxy downgradeDxy trending down, xxxusd going up usdxxx going down, bullish trend at DXY penetrative and crossing bullish resistance,
DYOR always, n keep ur trade safe

DXY, Is correction on the way ?Hello Traders, Hope you are doing great.
for upcoming days and for a short period of time, we'll probably see a downward correction to Specified level in TVC:DXY , we also have a Divergence on 4H that confirms our theory.
so with a proper trigger we can open a short position. We will also probably find better buy positions in FX:GBPUSD And FX:AUDUSD than the FX:EURUSD .
Trade safe and have a great weekend.
And finally tell me what do you think ? UP or DOWN ? leave your comment below this post.
If this post was helpful to you, please like it and share it with your friend.
THANKS.

DXY Update and Levelsafter good impulse move to the upside there is certainty of price going into pullback mode
because
. price recently broken the trend line which was from weekly side so the next liquidity zone is supply from monthly which is 1% away and on other hand price can try to retest the fvg which nearby 0.5% below the current price (105.998) or the round figure 105 can act as support
my take - before going to 107 zone price should retrace and get some liquidity from fvg

Is a DXY Pullback on the Horizon? Key Price Action Signals Is a DXY Pullback on the Horizon? Key Price Action Signals to Keep an Eye On
👀👉 The DXY Dollar Index has shown robust bullish momentum recently—but is it overextended? A pullback at a major support level could offer a valuable entry opportunity. I’m watching this zone closely for a possible buy setup aligned with the key criteria covered in the video. In this analysis, we’ll explore essential price action signals to watch and discuss strategies for positioning in the next potential move. Disclaimer: This analysis is for informational purposes only and not financial advice.* 📊✅

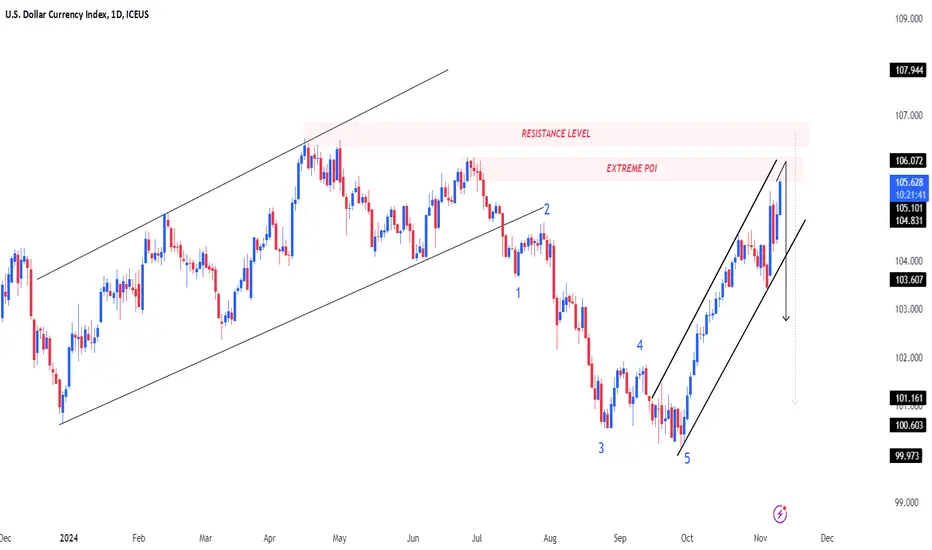
DXY IndexDXY Index
Completed " 12345 " Impulsive Waves and " ABC " Corrective Waves at Extreme Point of Interest ( POI ). Bullish Channel as an Corrective pattern in Short Time Frame and Rejection from Resistance Level with a Strong Divergence
The Breakout! With The Easiest Chart Thank you for taking your time to watch this video and if you enjoyed it, Please feel free to ask any question in the comments and leave a like!

DXY bias new outlooklast 10 candle does not have any liquidity which seems that price is likely to bounce from 1st poi
but the candle from nov5 and nov6 will be important as it is bearish marbozu with nov6 candle could create bearish fvg that can give price another rejection zone to push the price to test poi 2
based on drawn poi
poi 1 = 103.220
and poi 2 = 102.630
we need see if price is rejected from this zone followed by dotted line which represents external liquidity to grab
and finally we have orange zone that is weekly bearish fvg once that is tested will follow with new idea

A Bullish Turn: Investors Embrace the DollarA Shift in Sentiment
In a surprising turn of events, hedge funds, asset managers, and other speculators have shifted their stance on the US dollar, moving into bullish positions in the week ending October 22nd. This significant shift, totaling approximately $9.2 billion in long dollar bets, according to data from the Commodity Futures Trading Commission (CFTC) compiled by Bloomberg, marks a dramatic departure from the previous week's net short position.
A $10.6 Billion Swing
This abrupt change in sentiment represents a substantial $10.6 billion swing from the previous week, when traders were actively betting against the greenback. The reasons behind this bullish pivot are multifaceted, primarily driven by a confluence of factors, including stronger-than-expected US economic data and heightened demand for safe-haven assets as the US election approaches.
A Recalibration of Fed Expectations
A series of positive economic reports released throughout October has forced a recalibration of previously dovish Federal Reserve expectations. The robust economic indicators have raised the possibility of a more hawkish monetary policy stance from the Fed, which could potentially lead to higher interest rates. Historically, a stronger US dollar has been correlated with higher interest rates, making the greenback an attractive investment for global investors.
Election-Year Uncertainty
As the US presidential election draws near, geopolitical uncertainty and market volatility tend to increase. In such times, investors often seek refuge in safe-haven assets like the US dollar. The dollar's perceived status as a reliable store of value, combined with the potential for increased market volatility, has likely contributed to the recent surge in demand for the currency.
Implications for the Global Economy
The shift towards a bullish dollar position has significant implications for the global economy. A stronger dollar can negatively impact emerging market economies that rely heavily on dollar-denominated debt. Additionally, it can make US exports more expensive, potentially hindering economic growth. However, for countries with strong economic fundamentals and current account surpluses, a stronger dollar can be beneficial.
A Cautious Outlook
While the recent bullish trend in the dollar is notable, it is essential to maintain a cautious outlook. The global economic landscape remains uncertain, and a variety of factors, including geopolitical events, trade tensions, and central bank policies, could influence the dollar's trajectory. As such, it is crucial for investors to carefully consider the risks and rewards associated with dollar-based investments.
In conclusion, the recent shift towards a bullish dollar position reflects a significant change in market sentiment. A combination of stronger-than-expected US economic data and heightened demand for safe-haven assets has driven investors to embrace the greenback. While the implications of this trend for the global economy are far-reaching, it is essential to remain vigilant and adapt to evolving market conditions.

DXY Trade Idea👀👉 The US Dollar Index (DXY) has retraced and showing signs of upward momentum. We are looking to buy on this 4H pullback. Disclaimer: This is not financial advice. Always do your own research and consult a licensed financial advisor before making any trading decisions.📊✅

Key Levels to Watch in the DXY: Preparing for Potential ReversalWaiting on a reaction a tad higher. TVC:DXY
Looking at the levels 103.5 > 102.2. From there, I'll see how it behaves.
If it moves above 103.6, I’ll cut the short, as 105.4 will come into play.
Just playing out two scenarios with the same premise: down before more up...

DXY Index at Critical Resistance: Possible Clues for USD Pairs👀👉 The US Dollar Index (DXY) is nearing a key resistance zone, repeatedly tested on both the monthly and weekly timeframes, which often signals a potential market reaction or rejection. While the US dollar has maintained a strong bullish trend, these factors suggest a possible near-term reversal, offering potential opportunities in both correlated and inversely correlated currency pairs. Disclaimer: This is not financial advice. Always do your own research and consult a licensed financial advisor before making any trading decisions.
📊✅

USD Index at 104 Resistance: Strategies for the Next MoveIn early October, I wrote that the multiple attempts to break below the support level given by the beginning of the year price were likely false breaks.
I suggested that the DXY (U.S. Dollar Index) was primed for a reversal to the upside, which could potentially push the price toward the 104 resistance level.
As anticipated, the USD Index reversed and touched this key resistance.
Looking ahead, a correction from this point seems probable, with the 102.50 zone being a possible target in the coming days.
My strategy is to look for buying opportunities in EUR/USD and AUD/USD.

DXY New Week Pair : DXY Index
Description :
Bearish Channel as an Corrective Pattern in Short Time Frame with the Breakout of Upper Trend Line
Fibonacci Level - 61.80%
Demand Zone
Completed " 1234 " Impulsive Waves
Break of Structure

DXY IndexPair : DXY Index
Description :
Elliot Waves 12345 Impulsive Waves and A Corrective Waves
Fibonacci Level 50.00 / 61.80
CHOCH
Breakout and Retracement of Bearish Channel
Demand Zone

DXY Bullish again? rally from 102.600 back upOnce price mitigates and retests the daily demand zone I’ve marked out, I’ll be looking for the dollar (DXY) to trigger another bullish move within this point of interest (POI), potentially leading to a rally that could take out another all-time high (ATH).
Upon reaching this daily demand, I’ll focus on finding a lower time frame entry. As price pushes up, taking out the liquidity and filling the imbalance, I’ll be watching for potential short-term sell opportunities from the daily supply zone, which looks like a high-quality area.
Confluences for DXY Bullish Move:
Recent Bullish Momentum: Price has been strongly bullish.
Break of Structure (BOS): A clear BOS to the upside, leaving behind a demand zone.
Liquidity and Imbalance: Liquidity targets and imbalance above, providing room for a rally.
High-Quality Daily Demand: The daily demand zone is strong and has a good potential for a bullish push.
P.S. I wouldn’t be surprised if the daily supply also holds and causes a deep retracement, but we’ll see how the market reacts.
Have a great trading week guys!

DXY Top Down AnalysisUtilizing the very effective and non-discretionary MAC strategy, coupled with lower timeframe divergences for entries, we take a look at DXY from the Quarterly, Monthly & Weekly perspective.
Have a great weekend.
