GBPUSD The second trade of the day comes from the GBPUSD pair.
Even though I'm not a big fan of this pair, I believe it's worth taking advantage of the signal.
However, for this pair, I recommend slightly reducing your lot size and overall risk.
🔍 Criteria:
✔️ Timeframe: 15M
✔️ Risk-to-Reward Ratio: 1:3
✔️ Trade Direction: Buy
✔️ Entry Price: 1.32793
✔️ Take Profit: 1.33054
✔️ Stop Loss: 1.32706
🔔 Disclaimer: This is not financial advice. It's a trade I’m taking based on my own system, shared purely for educational purposes.
📌 If you're also interested in systematic and data-driven trading strategies:
💡 Don’t forget to follow the page and subscribe to stay updated on future analyses.
Dxyindex

Oil on high time frame
"Regarding WTI oil, the price trend on high time frames is bearish, especially on the daily chart. After completing its pullback on the 4-hour chart, there are indications of further downside potential.
The market's volatility may be influenced by geopolitical tensions and political factors between Iran and the USA, as well as tariff issues. Despite these fluctuations, candle formations suggest the potential for prices to drop towards the $58 zone."
If you require more assistance or have any specific questions, feel free to ask!

DXY:Sharing of the Latest Trading StrategyThis week’s trading wrapped up successfully. Our exclusive VIP trading signals achieved a 90% accuracy rate!👉👉👉
This week, the DXY was quoted at 100.0471. Technically, the index is in a downward channel. Focus on the resistance level of 100.8500. If it breaks through this level, there is a good chance of an upward movement; otherwise, it may test the recent low point. In terms of trading operations, it is recommended to mainly take short positions during rebounds. Trade with a small position size and also pay attention to the changes in economic data and the trade situation.
Trading Strategy:
sell@100.5000-100.2000
TP:99.5000-99.0000
The signals in the Signature have brought about continuous profits, and accurate signals are shared every day. Hurry up and click to get them!
👇 👇 👇 Obtain signals👉👉👉

"DXY Dollar Index" Market Bullish Heist Plan (Day/Swing Trade)🌟Hi! Hola! Ola! Bonjour! Hallo! Marhaba!🌟
Dear Money Makers & Robbers, 🤑 💰💸✈️
Based on 🔥Thief Trading style technical and fundamental analysis🔥, here is our master plan to heist the "DXY Dollar Index" Bank Heist. Please adhere to the strategy I've outlined in the chart, which emphasizes long entry. Our aim is to escape near the high-risk ATR Line Zone. It's a Risky level, overbought market, consolidation, trend reversal, trap at the level where traders and bearish robbers are stronger. 🏆💸"Take profit and treat yourself, traders. You deserve it!💪🏆🎉
Entry 📈 : "The heist is on! Wait for the Crossing previous high (100.400) then make your move - Bullish profits await!"
however I advise to Place Buy stop orders above the Moving average (or) Place buy limit orders within a 15 or 30 minute timeframe most recent or swing, low or high level for Pullback entries.
📌I strongly advise you to set an "alert (Alarm)" on your chart so you can see when the breakout entry occurs.
Stop Loss 🛑: "🔊 Yo, listen up! 🗣️ If you're lookin' to get in on a buy stop order, don't even think about settin' that stop loss till after the breakout 🚀. You feel me? Now, if you're smart, you'll place that stop loss where I told you to 📍, but if you're a rebel, you can put it wherever you like 🤪 - just don't say I didn't warn you ⚠️. You're playin' with fire 🔥, and it's your risk, not mine 👊."
📍 Thief SL placed at the nearest/swing low level Using the 2H timeframe (99.000) Day/swing trade basis.
📍 SL is based on your risk of the trade, lot size and how many multiple orders you have to take.
🏴☠️Target 🎯: 102.300
🧲Scalpers, take note 👀 : only scalp on the Long side. If you have a lot of money, you can go straight away; if not, you can join swing traders and carry out the robbery plan. Use trailing SL to safeguard your money 💰.
💰💵💸"DXY Dollar Index" Bank Money Heist Plan is currently experiencing a bullishness,., driven by several key factors. .☝☝☝
📰🗞️Get & Read the Fundamental, Macro Economics, COT Report, Geopolitical and News Analysis, Sentimental Outlook, Intermarket Analysis, Index-Specific Analysis, Future trend targets with Overall outlook score... go ahead to check 👉👉👉🔗🔗🌎🌏🗺
⚠️Trading Alert : News Releases and Position Management 📰🗞️🚫🚏
As a reminder, news releases can have a significant impact on market prices and volatility. To minimize potential losses and protect your running positions,
we recommend the following:
Avoid taking new trades during news releases
Use trailing stop-loss orders to protect your running positions and lock in profits
💖Supporting our robbery plan 💥Hit the Boost Button💥 will enable us to effortlessly make and steal money 💰💵. Boost the strength of our robbery team. Every day in this market make money with ease by using the Thief Trading Style.🏆💪🤝❤️🎉🚀
I'll see you soon with another heist plan, so stay tuned 🤑🐱👤🤗🤩

EURUSDHello everyone!
I'd like to share an ideal **Buy opportunity** on the **EURUSD** pair with you. The trade is currently **active** on my side.
🔍 **Criteria:**
✔️ Timeframe: 15M
✔️ Risk-to-Reward Ratio: 1:1.17
✔️ Trade Direction: Buy
✔️ Entry Price: 1.13204
✔️ Take Profit: 1.13335
✔️ Stop Loss: 1.13092
🔔 **Disclaimer:** This is not financial advice. It's a trade I’m taking based on my own system, shared purely for educational purposes.
📌 If you're also interested in systematic and data-driven trading strategies:
💡 Don’t forget to follow the page and subscribe to stay updated on future analyses.

DXY:Sharing of the Trading Strategy for Next Week This week’s trading wrapped up successfully. Our exclusive VIP trading signals achieved a 90% accuracy rate!
Recently, the economic data of the United States has shown mixed performance. The non-farm payrolls added in April were higher than expected, but the data for March was revised downward, and the number of initial jobless claims also exceeded expectations. Overall, the U.S. Dollar Index still has a trend of fluctuating. Pay attention to the resistance level of 100.3742 above and the support level of 99.2702 below. In terms of trading operations, it is mainly advisable to take short positions on rebounds.
Trading Strategy:
sell@100.3000-100.0000
TP:59.5000-59.0000
The signals in the Signature have brought about continuous profits, and accurate signals are shared every day. Hurry up and click to get them!
👇 👇 👇 Obtain signals👉👉👉

DXY (US Dollar Index) – Bullish Setup📊 DXY (US Dollar Index) – Bullish Setup from FVG & Trendline Confluence
Price tapped into a well-defined Fair Value Gap (FVG UP) aligning with bullish trendline support. I'm anticipating a small retracement toward the 99.88–99.81 area before continuation upward.
📍 Entry Zone: 99.88 – 99.81 (FVG + Trendline)
🛑 Stop Loss: 99.71
🎯 Target (TP): 100.32
📐 RR: Approx. 1:3
Confluences:
Bullish market structure
FVG filled & respected
Ascending trendline support
Liquidity taken below previous lows
🔔 Watching for bullish reaction after the minor pullback for confirmation.

US INDEX (DXY) TIME TO BUY !!!HELLO TRADERS
As i can see this chart created a harmonic pattren and it crystal clear showing the levels till it hold above our design Stop Loss Trade War Talks and NFP results with slowing down the inflation shows us that $ will recover from this zone if not break SL make a proper research befor taking any trade we appriciate your cooments and support us Stay Tuned for more updates ...

NFP Analysis: More Bullish Order Flow?The Dollar has broken structure to the upside and is now pulling back into equilibrium. From this discounted level, I'm looking to capitalise on any valid bullish setups, as break-of-structure moves often lead to continuation towards previous highs.

DXY (Dollar index) Shorts from 1hr supply zone My general outlook on the DXY this week leans bearish, as I expect price to continue trending lower. I’ve identified a nearby 1H supply zone, where we could see price react and begin pushing lower. There is also a larger supply zone further above, but it’s currently out of reach unless price pulls back significantly.
Looking back, the 2-day demand zone I marked over a week ago has played out well, with a strong bullish reaction from that level — price is still rising from that zone. During this move, a new 11H demand zone has formed, which also led to a change of character to the upside. If price revisits that zone, we may see another bullish continuation from there.
Key Points:
Overall bearish trend expected to continue in the short term.
1H supply zone nearby is a potential trigger point for a sell-off.
2D demand zone previously marked is still holding and influencing price.
11H demand zone has caused a bullish shift and could provide another long opportunity if price returns.
P.S. This is my general DXY outlook for the week. I don’t trade the dollar directly, but I use it as a key confluence when analysing and executing trades across other major pairs.

EURUSD Breakout Setup Wtchng 4 Bullish Continuation Toward1.1423This EUR/USD 4-hour chart shows a descending triangle pattern forming, with price currently testing the lower boundary support zone around 1.12820. Two bullish rejections (marked with arrows) indicate potential buying interest at this level. A clear change of character (ChoCH) has occurred, suggesting a shift in momentum from bearish to bullish. The projected scenario outlines a potential bullish breakout from the descending trendline, targeting the 1.14237–1.14228 zone, which aligns with previous structure and the top of the Ichimoku cloud. Confirmation would come from a breakout and retest of the trendline.

Eur/Gbp Elliott wave May/02 hello eveyone...
as you can see it seems wave 4 completed ( Holding 50% ) and wave 5 can start....

USD/JPY Bullish Setup with Ascending Trend line This is a 2-hour chart of USD/JPY showing a bullish setup. The price is currently respecting an ascending support trend line, indicating potential upward momentum. There are two marked resistance levels: the first target around 144 . and the second target near the 146.00– 146.50 zone . The chart suggests a bullish continuation if the price breaks above the first target zone, with the second target acting as a stronger resistance area. Ichimoku cloud support below the price also reinforces the bullish bias.

Gold (XAU/USD) Bearish Continuation Within Descending ChannelThis chart shows XAU/USD (Gold vs. USD) trading within a clear descending channel. Price recently broke below a key support level, signaling bearish momentum. A potential retest of the broken support (now resistance) is expected before further downside continuation. The chart outlines two bearish targets: the first around 3,193 and the second near 3,100. If the retest fails and sellers step in, the downtrend is likely to continue toward those targets.

DXY Forecast: More Bearish OrderflowThis week, I anticipate further downside movement on the DXY, with price potentially reaching a key area of interest—a bullish order block. While the reaction at this level remains uncertain, my current bias remains bearish unless a break of structure to the upside signals a continuation of the bullish trend.

AUDCHF m15 SellLet the final trade of the day come from AUDCHF.
I expect the pair to decline first to 0.52545 and then towards 0.52419 / SL 0,52861.
Adjust your risk accordingly and activate the trade.
Wishing everyone a profitable day!
📊 Don’t forget — I share these trade ideas daily on my TradingView profile. Follow me there for full analysis and daily setups.
🔔 I post detailed trade ideas and daily market analysis like this every day on my TradingView profile.
👉 Follow me to get notified and read the full breakdowns.

NZDCHF m15 BuyHello everyone.
There's a perfect buy opportunity on NZDCHF right now.
You can even set your RRR to 1:4, but those who prefer a shorter target can close at RRR 1:2.
I expect the pair to reach the 0.49225 level during the day.
Wishing everyone profitable trades!
🔔 I post detailed trade ideas and daily market analysis like this every day on my TradingView profile.
👉 Follow me to get notified and read the full breakdowns.

Gold Spot (XAU/USD) Bullish Setup: Buy Zone to Target Levels Gold Spot (XAU/USD) on the 1-hour timeframe. Key points:
Support Zone: Strong support is identified in the yellow zone around 3,290–3,293, where price has bounced multiple times.
Buy Zone: Market is currently in a potential buy zone just above support, signaling a possible long entry.
Targets:
1st target: Around 3,368
2nd target: Around 3,419
All-Time High: Marked as a potential long-term resistance above 3,500.
Outlook: If price respects the support and buy zone, the market may rally toward the 1st and 2nd targets. Watch for bullish confirmation before entering.

DXY Dxy has some more upside, let the market go above 100 and then we will see the reaction.
Disclosure: We are part of Trade Nation's Influencer program and receive a monthly fee for using their TradingView charts in our analysis.

DXY USD INDEX FORECAST Q2 W18 Y25DXY USD INDEX FORECAST Q2 W18 Y25
Professional Risk Managers👋
Welcome back to another FRGNT chart update📈
Diving into some Forex setups using predominantly higher time frame order blocks alongside confirmation breaks of structure.
✅ U.S. dollar index is a measure of the value of the dollar against a basket of six foreign currencies.
✅The currencies are the Euro, Swiss franc, Japanese yen, Canadian dollar, British pound, and Swedish krona.
💡Here are some trade confluences📝
✅ Break an d close below July 2023 key 100.00 levels.
✅ Foresee a pull back to, weekly imbalance, daily order block, daily 50ema, weekly order block and or weekly 50 ema.
✅ Awaiting to identify a significant break of structure bullish to use the DXY as confluence for our trading week 18 of Q2 toward key points of interest mentioned above.
✅ Forecasting continued bearish pressure long term.
✅Initially bullish outlook however upon price turn around. DXY to break 100.000 level again.
🔑 Remember, to participate in trading comes always with a degree of risk, therefore as professional risk managers it remains vital that we stick to our risk management plan as well as our trading strategies.
Pairs to look out for -
EURUSD
USDCHF
USDJPY
USDCAD
GBPUSD
📈The rest, we leave to the balance of probabilities.
💡Fail to plan. Plan to fail.
🏆It has always been that simple.
❤️Good luck with your trading journey, I shall see you at the very top.
🎯Trade consistent, FRGNT X

DXY TRADING SETUPDXY TRADING SETUP
Confirmation are in sight!
Get ready for a potential DROP!
Stay tuned for updates and confirmation signals!

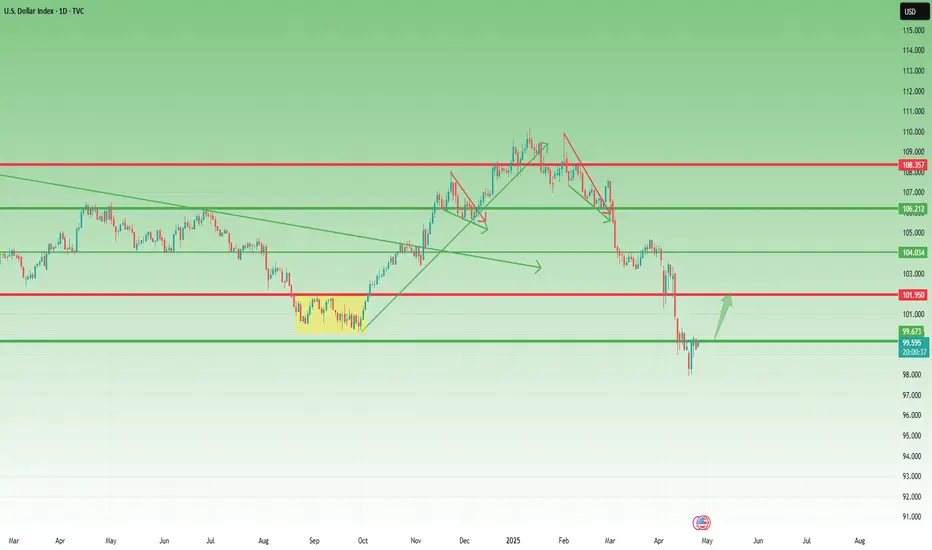
USD Index: A Possible Reversal in Sight?Since early February, right after Trump’s inauguration, the USD Index (DXY) has been under pressure, falling sharply by over 10%.
However, after hitting the 98.00 level, things seem to have stabilized. We're seeing the early signs of a relief rally.
🔍 Technical Perspective:
- This week’s candlestick pattern suggests a bullish reversal.
- The dip on Wednesday was quickly bought, showing buyer interest.
- A minor correction occurred yesterday, but dips are being well supported.
- Currently, the DXY trades around 99.60, just under the psychological level of 100.
🎯 Outlook:
As long as 98 remains intact, the bias shifts towards a potential rebound.
First target: 102 – a logical resistance zone and prior support.
This is not yet a confirmed trend reversal, but the price action is shifting. The key now is how the market reacts around the 100 level. A break above could trigger further bullish momentum.
Interpretation of gold short-term operation ideasAfter a surge in the morning, gold was suppressed and fell again in the afternoon and has been in a narrow range of fluctuations!
Evening operation ideas:
If the European session does not continue the Asian session's pull-up and continue to strengthen, the probability of evening fluctuations will increase. After a sharp pullback, it is not easy for gold to turn strong in the short term, so before yesterday's opening is broken, the possibility of continued pullback will increase!
Short-term suppression of the US market: 3330-35, look at a high and then fall
Support below: 3310-3300-3293
Data reference: The Federal Reserve will release the Beige Book of brokerage conditions at 2 a.m.
Trump will sign an executive order at 5 a.m.
