4.1 Analysis and Suggestions on Gold US Market Operation IdeasGold intraday interpretation
Gold failed to hit 3150 in the morning session. How will the subsequent market evolve?
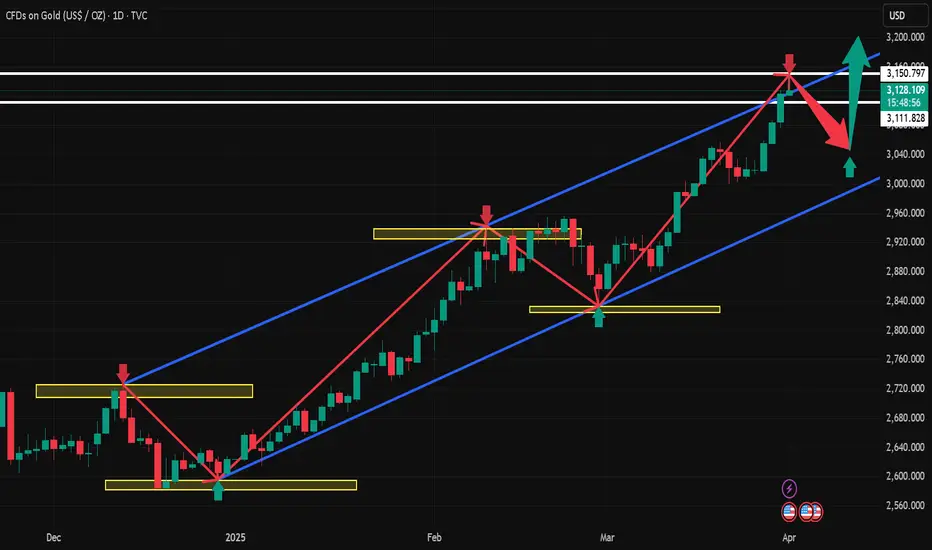
It hit a high in the morning and then fell back to 3125-3130 to stop the decline and enter consolidation. If it fails to break through 3150 on Thursday, it will have a chance to enter a high-level adjustment, and the decline may reach 30-50 points!
Market sentiment has been brewing for a long enough time. Everyone should look at tariffs rationally. Even if there is no tax increase, there is no need to be too surprised.
Currently entering the triangle consolidation pattern, which is a type of relay pattern. The pattern is usually accompanied by a reduction in trading volume and resumes the original trend after breaking through.
Focus: 3150 key resistance. Don't chase north above 3140. If the intermediate form is used, the probability of breaking through 3150 during the day is not high. Mainly look at the ADP employment number on Wednesday. Beware of the US market retreating from 3113 to 3117 and then rebounding quickly.
Lower support: 3125 3113 3105
Upper pressure: 3150 3165
Dxysignals

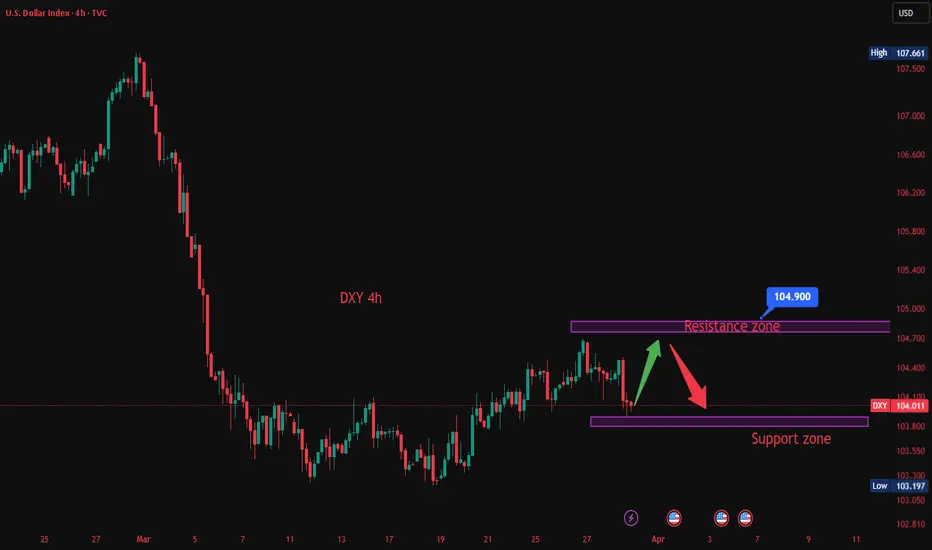
DXY Bounces Back: I’m Staying BullishAfter breaking below the 104 support and hitting a low of 103.75, TVC:DXY staged a strong recovery, reclaiming support and signaling a potential false breakout.
The overnight retest of 104 established a higher low, suggesting further upside potential.
As long as 104 holds, I remain bullish and will look to sell EUR/USD and GBP/USD.

Monthly line saturated big positive line, gold and silver swordsYesterday, the gold market opened slightly higher at 3088 in the morning, and then fell back. The daily line reached a low of 3076.5, and then the market rose strongly. After breaking the 3100 integer mark, the daily line rose strongly. The daily line reached a high of 3128, and then the market consolidated widely. The daily line finally closed at 3123.8, and then the market closed with a long lower shadow. After this pattern ended, today's market still has technical bullish demand. In terms of points, after the breakout of 2940 and 2958, the stop loss followed up at 2990. Today, the stop loss of 3110 is 3105, and the target is 3128 and 3132. The breakout is 3140 and 3150-3152.
We will update regularly every day to introduce how we manage active ideas and settings. Thank you for your likes, comments and attention. Thank you very much
4.1 Analysis of gold intraday short-term trendFrom the daily chart, the gold price fell slightly after breaking through the previous high of $3127.76, but it is still in a strong upward channel overall. The current price has been stable above the 5-week moving average for many consecutive weeks, indicating that the medium-term trend is still healthy. It is worth noting that from the low of $2536.68 to date, gold has risen by more than 23%, and it is necessary to be vigilant about the risk of short-term adjustments. The next target will point to the psychological level of $3200. Factors supporting this view include rising global uncertainty, increased expectations of interest rate cuts by the Federal Reserve, and continued gold purchases by the central bank. In addition, the closing price needs to stabilize above $3135 to confirm the effectiveness of the long-term breakthrough. In this case, the price may accelerate upward, with a target of $3170.
Short-term resistance: 3130 3150 3170
The market is changing with the trend, and it is recommended to adjust the strategy in combination with real-time data!

DXY:Seize the opportunity to sell short at high pricesThe situation in the Middle East is clearly deteriorating, which undoubtedly has a huge stimulating effect on the global risk aversion sentiment. More funds have started to seek safe havens. However, the best choice at present is not the US dollar. With the continuous rise of the East, more and more capital will favor this side of the East. Therefore, the pressure on the US dollar index is actually increasing, and it will be very difficult for it to rise.
Regarding the trend of the US dollar index today, although the current situation exerts great pressure, the actions to support the market of the US dollar index still take effect from time to time. So the price will not keep falling, and there will still be some oscillatory patterns. However, even if it moves in an oscillatory pattern, the upward pressure on the US dollar index will be significant. Therefore, when the price reaches the effective resistance level, it will be an excellent opportunity to short the US dollar index.
DXY Trading Strategy:
buy@104.500
TP:103.500
Get daily trading signals that ensure continuous profits! With an astonishing 90% accuracy rate, I'm the record - holder of an 800% monthly return. Click the link below the article to obtain accurate signals now!

3.31 Gold officially breaks through 3100In the early Asian session on Monday (March 31), spot gold once again saw a surge in prices shortly after the opening. The most active gold futures contract in New York was traded in one minute from 10:22 to 10:23 Beijing time on March 31, with 890 lots traded, and the total value of the trading contracts was US$279 million. Affected by Trump's latest tariff news, spot gold maintained the current bull market trend. The gold price broke through the US$3,000 mark and broke through US$3,100 only half a month after breaking through the US$3,000 mark. As of 10:39 Beijing time, it was reported at US$3,105.23 per ounce.
Gold technical analysis: Gold closed higher with a big positive line last week, and after consolidating at a high level, it increased strongly and closed at a high level. The weekly K-line is still strong, with a big bald positive line. There will be further continuation this week. However, the monthly line closed today. After the volume is released, we must also be careful of the wash of the high and fall. The daily chart has continued to rise and set a new high. The Asian session is a slow consolidation and then a slow new high. The consolidation is not the high, and the volume is the top. At present, there is further rise in the short term. Gold was stimulated by risk aversion over the weekend. It opened high and fell back on Monday. However, gold fell back under pressure at 3100 in the short term. We must pay attention to adjustments. Then gold is just adjusting. Wait patiently for it to fall back before going long. The technical side of gold shows a strong upward trend. US$3070 has become a new short-term support level. The current upward momentum is sufficient and there is momentum for further rise. The influence of gold bulls on the current trend of gold has reached the highest level in history, but the trading scale and heat have not reached the most crowded range in history. There is still room for funds to further increase positions, which provides support for gold prices.
3.31 Gold Operation Strategy Reference:
Short Order Strategy:
Strategy 1: When gold rebounds around 3100-3103, short (buy short) in batches with 20% of the position, stop loss at 3110, target around 3085-3075, and look at 3070 if it breaks; (Strategy is time-sensitive, more real-time layout strategies are announced in the channel.)
Long Order Strategy:
Strategy 2: When gold pulls back around 3070-3073, long (buy long) in batches with 20% of the position, stop loss at 3060, target around 3085-3095, and look at 3105 if it breaks; (Strategy is time-sensitive, more real-time layout strategies are announced in the channel.)

DXY:It is about to witness a quarterly declineBecause concerns about tariffs causing a slowdown in U.S. economic growth have pushed down U.S. Treasury bond yields, the stock market, and the U.S. dollar exchange rate. The U.S. dollar is likely to experience a quarterly decline next week, and we can seize the opportunity to short on rebounds.
Trading strategy:
buy@104.500
TP:103.500
Get daily trading signals that ensure continuous profits! With an astonishing 90% accuracy rate, I'm the record - holder of an 800% monthly return. Click the link below the article to obtain accurate signals now!
3.28 Gold Breaks Point, Falls Back to Support Long PositionsOn Thursday (March 27), affected by the news that US President Donald Trump announced new tariffs on imported cars, global trade tensions further escalated, market risk aversion heated up, and gold prices once again approached the record high set last week.
Fundamentals: Gold fell from its pre-US high. The decline supports the long position view.
The new US tariffs have exacerbated market tensions, and PCE data will become the next focus of attention.
The current market is active, and both long and short sides are engaged in fierce competition around key resistance levels. The dual drive of technical and fundamental factors has significantly amplified the volatility of gold prices.
The cumulative net inflow of gold ETFs in the first quarter of 2025 has reached 155 tons, and the total holdings have climbed to the peak since September 2023. In the previous trading day alone, the scale of a single-day increase of 23 tons set a record since 2022. The unexpected growth of central bank demand for gold purchases and the continued inflow of ETF funds together constitute the "two-wheel drive" for gold's medium- and long-term bullishness. If this trend continues, it will provide sufficient liquidity support for gold prices to break through historical highs.
The current price is close to the historical high, and some long profit-taking pressure is gradually accumulating. If the PCE data released on Friday is stronger than expected, or the Federal Reserve releases hawkish signals, it may become the fuse to trigger a pullback
Trend: shock upward trend
Support: around 3033.00
Resistance: around 3055.50

DXY:Today's Trading StrategyTrump signed an executive order announcing a 25% tariff on all imported cars, aiming to force the return of many automotive manufacturing and related industries through the "tariff stick." However, the actual situation is more complex. Currently, there are significant issues within the US domestic industrial chain system, with declining quality and craftsmanship, failing to meet the needs of many automotive manufacturing enterprises. As a result, this measure is unlikely to achieve the desired effect and may even harm the US itself. The US Dollar Index is the first to bear the brunt. Upon the market's confirmation that Trump has officially signed the order and tariffs will be imposed, the pressure on the US Dollar Index suddenly emerged, squandering the hard-earned advantages accumulated yesterday. This led to a sharp decline in the US Dollar Index early today.
Regarding today's trading strategy, it is recommended to adopt a trading approach based on the market's oscillatory trend. One can seize the opportunity to sell the US Dollar Index short at highs and buy non-US currencies at lows, as the current market demand indicates that the US Dollar Index cannot truly rise, nor will it experience a significant decline for now. Therefore, it is advisable to find opportunities to sell the US Dollar Index short at highs during the market's oscillation.
Trading strategy:
buy@103.70-103.80
TP:104.50-105.00
Get daily trading signals that ensure continuous profits! With an astonishing 90% accuracy rate, I'm the record - holder of an 800% monthly return. Click the link below the article to obtain accurate signals now!

DXY:Pay attention to the retest of the daily chart supportOn Tuesday, the price of the US Dollar Index generally declined. The intraday price peaked at 104.444, bottomed out at 103.917, and closed at 104.189.
From the perspective of the daily chart, the level of 103.80 below serves as a crucial watershed for the wave trend. As long as the price remains above this level, a short-term bullish position is advisable for the time being. Meanwhile, the short-term support of the four-hour chart is in the 104.10 area. Currently, the price in the short term is fluctuating and is likely to continue to retest the support area of the daily chart. Therefore, in trading operations, focus on the support of the daily chart and anticipate an upward movement.
Trading strategy:
buy@103.70-103.80
TP:104.50-105.00
Get daily trading signals that ensure continuous profits! With an astonishing 90% accuracy rate, I'm the record - holder of an 800% monthly return. Click the link below the article to obtain accurate signals now!

3.26 Technical analysis suggestions for short-term gold operatioIn the early European trading on Wednesday (March 26), spot gold continued to rebound in the short term, and the current gold price is around $3027/ounce.
Gold technical analysis, how to operate in the evening? ——
The daily chart of gold shows that gold prices are rising above all bullish moving averages, while setting higher highs and higher lows. The 20-day simple moving average (SMA) has gained upward momentum and currently provides dynamic support around 2954.70. At the same time, after correcting the extreme overbought conditions, technical indicators resumed their upward trend within the positive level. From the 4-hour line, gold prices are fighting against the mildly bearish 20-period SMA, but are still well above the bullish 100-period SMA and 200-period SMA. At the same time, technical indicators are retreating from the midline and slightly lower within the neutral level. Overall, it is recommended to treat gold operations with a wide range of fluctuations today!
Gold operation strategy at night:
Short order strategy: short near 3031 above, stop loss 3040, target near 3010;
We will update regularly every day and introduce to you how we manage active ideas and settings. Thank you for your likes, comments and attention, we are very grateful

DXY index UpdateRegardless of Powell's comments, the dollar index might rise toward the target range after a price correction.

3.26 Technical analysis of short-term gold operationsGold is still supported by risk aversion, but it quickly fell back after rising. In fact, the support of safe-haven gold is not surprising. However, since the gold bulls did not continue, it means that the space for gold bulls is also limited. Gold rose and fell in the US market. Gold was directly short at 3032. Gold fell as expected. The US market rebounded high and was still short.
Gold's 1-hour moving average is still in a downward dead cross. Gold bulls cannot reverse the situation. Gold fell directly to 3035 in the US market under pressure.
Support level: 3018 3005 3000
We will update regularly every day and introduce to you how we manage active ideas and settings. Thank you for your likes, comments and attention, we are very grateful

DXY:Maintain a long position above the daily line supportOn Monday, the price of the US Dollar Index generally showed an upward trend. On that day, the price rose to a maximum of 104.422, dropped to a minimum of 103.814, and closed at 104.285. Looking back at the price performance on Monday, after the opening in the morning, the price initially came under pressure and declined in the short term.
Subsequently, when the price reached the 103.80-90 area, it stopped falling and then started to rise, and finally closed with a large bullish candlestick on the daily chart. Currently, since the retracement and rally on Monday have provided confirmation, if the price remains above the 103.80 level in the subsequent period, a swing long position can be taken.
In the short term, on the four-hour chart, attention should be temporarily paid to the support in the range of 104.00-104.10. After the price reaches this level in the future, further upward movement should be observed. In the short term, attention should be paid to the resistance in the area of 104.50-104.90 on the upside.
Trading strategy:
buy@104.00-104.10
TP:104.50-104.90
Get daily trading signals that ensure continuous profits! With an astonishing 90% accuracy rate, I'm the record - holder of an 800% monthly return. Click the link below the article to obtain accurate signals now!

3.24 Gold intraday operation ideasAfter last week's intense volatility, this week's market sentiment diverged significantly, with different categories performing differently. In addition, as the month is coming to an end, market risk appetite is reduced, so it is necessary to be cautious.
We still need to pay attention to economic data this week, because we need to observe the prospects for US economic development through data, and another thing is inflation, which the market and the Federal Reserve are concerned about.
Last Friday, the world's largest gold ETF added 20.08 tons of positions at one time, which was the eighth consecutive increase. This kind of continuity is relatively rare. In theory, it is a positive support for gold prices, but the increase and decrease of ETFs is more viewed from a medium- and long-term perspective.
The initial pressure on the intraday gold price is around $3,026, and the further pressure is around $3,035. The strong pressure or the long-short dividing point is at the high point of $3,040. The current rebound is slightly stronger, and it may be the first to continue the rebound.
The primary support below the day is around $3005. After breaking down, further support is at $2995. If the first retracement is near this level, you can intervene and buy. The rebound target price is around $3020. As for whether the rise can continue? It must stand firmly above $3040. Below this level, there is a risk of retracement at any time.
BUY: 3005 Stop loss: 2995
TP1:15
TP2:25
TP3:35
SELL:3040 Stop loss: 48
TP1:30
TP2:20

DXY Update – Two Possible Scenarios! 📢 DXY Update – Two Possible Scenarios! 📢
1️⃣ Bearish Scenario: Looking for sell from the Bearish OB 🎯
2️⃣ Bullish Scenario: If price doesn’t reach the Bearish OB, we shift focus to the Bullish OB for a potential buy ✅
📌 Waiting for price to approach key zones & using confirmations for entry!
📊 Stay updated with our latest analysis – Follow our TradingView page! 🚀

3.22 Gold Short-term Trend Analysis and SuggestionsTechnical analysis:
From the daily chart, technical indicators show signs of upward exhaustion and lose strength at extreme levels. At the same time, gold prices are holding above all bullish moving averages, with the 20-day simple moving average (SMA) providing dynamic pressure near 2941.70. From the 4-hour chart, the 100-period SMA and 200-period SMA continue to move higher, well below the above short-term moving averages. At the same time, the momentum indicator moves lower in the positive area but loses downward strength; while the relative strength index (RSI) corrects the overbought condition and then stabilizes near 61. Overall, Zhang Jinglin recommends wide fluctuations in gold operations today!
Short-term operation strategy:
SELL: Short near 3045 above, stop loss 3051, target near 3015, 3000.
We update regularly throughout the day and tell you how we manage active ideas and settings. Thank you for your likes, comments and attention, we are very grateful!

3.21 Gold peaking or rebounding?The three tracks of the 4-hour Bollinger Bands have shrunk severely, and the current range is compressed in the 3056-3012 range. As time goes by, the range will continue to shrink. The short-term support middle track and the MA30 moving average correspond to the 3034-3020 line. The 4-hour indicator macd has a high-level dead cross and runs with large volume. The dynamic indicator double lines are glued together and flat, indicating that there are signs of further decline in the 4-hour period. Pay attention to the suppression of the 3042-45 line in the short term.
The hourly macd dead cross is initially established, and the dynamic indicator sto is quickly repaired downward, indicating that the price shock is weak. At present, pay attention to the resistance of 3042-48 above.
In summary: Pay attention to the support of the 3025 line below during the day, and pay attention to the suppression of the 3057 line above. Combined with the shrinking of the 4-hour Bollinger Bands, the short-term price remains in the range of 3025-3053. The short-term resistance is at the 3042-45 line.
Resistance: $3,045; $3,079; $3,100; $3,108
Support: $3,018; $3,000; $2,974; $2,956

3.21 Gold Short-term Analysis and Operation SuggestionsGold hit a record high on Thursday (March 20) after the Federal Reserve hinted that it might cut interest rates twice this year, further enhancing the attractiveness of gold amid the current geopolitical and economic tensions. As of press time, spot gold was basically stable near $3,030, having hit a record high of $3,057.21.
——Gold Technical Analysis
From the daily chart, the volume indicator is firmly aiming higher, supporting another wave of gains, while the relative strength index (RSI) is stable near 72. At the same time, the price of gold is trading above all its moving averages, with the 20-day simple moving average (SMA) providing dynamic support near 2,936. From the 4-hour chart, technical indicators have eased from extreme levels, but are far from indicating an imminent downtrend. In addition, the 20-period SMA continues to rise steadily, currently around 3,011, while well above the longer-term moving average. Overall, Zhang Jinglin recommends rebounding and shorting as the main operation of gold today!
Gold short-term operation strategy:
SELL: 45 Stop loss 55
TP1:35
TP2:25
TP3:10

DXY SELL/SHORTBy utilizing Fibonacci retracement levels, historical patterns, , we can formulate a hypothesis that the market might follow a similar trajectory if bearish sentiment prevails.

3.20 Technical Analysis of Gold Short-term OperationsOn Wednesday, gold maintained a bullish trend! In yesterday's trading:
1: Following the trend principle, the support is stuck at 3020, but the amplitude of the retracement is not given to the retracement near 3020, the lowest is the range of 3022-3025.
2: For short orders, avoid short orders directly; because there is no price reference for short orders, no indicator reference for short orders, therefore, avoid all of them;
3: In terms of trend, at the current stage, the bullish trend is still continuing, therefore, do not catch the top, do not think about catching a large-scale short order, it is not realistic for the time being!
In today's market:
1: 4 hours, the stochastic indicator is in a golden cross state, the main long signal; MACD double lines are glued together, and the state of passivation divergence! These signals suggest that the market is mainly controlled by bulls during the day, and it is difficult to fall sharply for the time being; in terms of form, the continuous positive rise and the broken positive oscillation form, the short-term support position is near 3040; the high point is unknown;
2: In the daily K, the stochastic indicator continues to form a golden cross, which is a bullish signal; in terms of form, the continuous positive rise is the main trend, and the short-term support position today is near 3040;
To sum up: today's short-term trend thinking; the support positions are near 3040, near 3020; near 3000, followed by around 2990; near the support, the trend thinking;

3.18 Risk aversion and expectations of rate cuts support gold toIntraday data analysis:
Gold hit a new record high and maintained an upward trend. For the support below, pay attention to the upper rail of the 4-hour Bollinger band at $3010, followed by the integer position of $3000, which is also near the high point of gold prices on Monday; for the pressure above, pay attention to the upper rail of the weekly Bollinger band at $3028, which is also the upper rail position of the current 4-hour Bollinger band. If the gold price continues to break upward, the upper space can pay attention to the upper rail of the monthly Bollinger band at $2950. The 5-day moving average and the MACD indicator cross upward, and the KDJ and RSI indicators cross upward. The short-term technical side is bullish.
Gold intraday reference: Supported by risk aversion expectations and interest rate cut expectations, gold maintains an upward trend and gold prices hit a new record high. In terms of operation, it is recommended to treat it with a volatile mindset. Pay attention to the support below at $3010, followed by $3000. Pay attention to the breakthrough near $3028 for the pressure above. If it stands firm here, you can continue to pay attention to $3050.

3.17 Technical Analysis of Gold Short-term OperationsIn the early Asian session on Monday (March 17), spot gold fluctuated at a high level and is currently trading at $2,990.02/oz. Spot gold once broke through the important $3,000 mark during trading last Friday, reaching a high of $3,004.82/oz, setting a new historical high. Investors chased this historic surge in safe-haven assets, seeking to avoid the economic uncertainty caused by US President Trump's tariff war, and then fell slightly due to profit-taking, closing at $2,988.12/oz.
Analysis of intraday gold short-term operations:
Gold is still in a three-month upward channel, and the relative strength index (RSI) on the daily chart remains around 70, indicating that the bullish tendency is still intact.
Once the gold price stabilizes above $3,000/oz (integer level, midpoint of the ascending channel) and confirms that this level is support, then $3,060/oz (upper limit of the ascending channel) may be set as the next bullish target, and the next bullish target is $3,100/oz (integer level).
On the other hand, if gold fails to turn $3,000/oz into support, technical buyers may be frustrated. In this case, $2,920/oz (20-day simple moving average, lower limit of the ascending channel) and $2,900/oz (round level, static level) may be seen as the next support level for gold
Resistance: 2998 3010 3020
Support: 2980 2965 2950
