3.14 Gold breaks through historical high to 3000Yesterday, the gold market continued the risk-averse rally and broke through the historical high. After opening at 2933.4 in the morning, the market first rose to 2947.4 and then fell back. The daily line reached a low of 2932.4 and then rose strongly. After breaking through the previous historical high of 2957 during the US trading session, the market accelerated upward. The daily line reached a high of 2989.3 and then the market consolidated. The daily line finally closed at 2988.8 and the market closed with a basically saturated big positive line. After this pattern ended, the weekly line completed the N-shaped break. Today's market reached the 3000 mark and quickly pulled back to 2988 and then came to 2997.
Short-term recommended operations:
Resistance level: 3000 3010 3020
Support level: 2995 2985 2970
Dxysignals

3.13 Technical analysis of gold short-term operationGold market analysis:
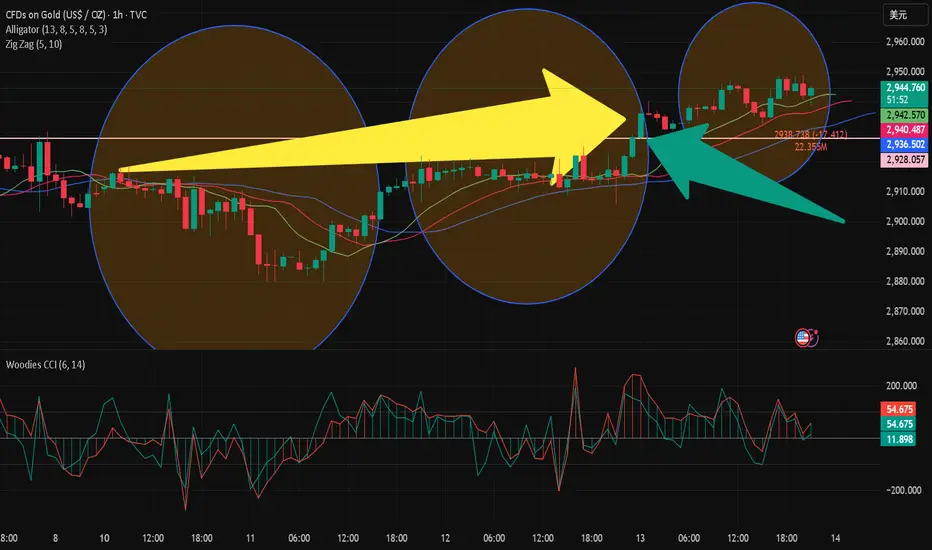
, Gold hourly level: In the morning, it rose from 2932 to 2946, and fell back to 2932 from 2946 in the afternoon. It rose from 2932 to 2948 in the European session. From the trend of the Asian and European sessions, it can be seen that it may enter a certain range of back and forth consolidation; combined with the trend of the bottom of 2880 rising to 2948, it can be found that there is a similar pattern in early March. After a short-term continuous rise, it will enter the box oscillation for several hours, and then continue to rise in a short-term continuous rise, and then continue to enter the box oscillation; then combined with the yellow channel in the above figure, pay attention to the pressure of the upper rail 2951-53 tonight. If it is suppressed, it may fall back to 2932-30 repeatedly. The lower rail support is an ideal bullish point. It will move up to 2923-25 tonight, which is also the top and bottom conversion position. If it can be touched, it is necessary to continue to follow the bullish
Resistance point l: 2945 2955 2970
Support level: 2935 2920 2900
Traders, if you like this idea or you have your own opinion about it, please write it in the comments. I will be happy
3.13 Gold surges higher againGold technical analysis
It has fluctuated continuously for two weeks in the 2890 to 2930 area. It broke through the Asian session yesterday. Then the second crazy game of the previous high formed a double top prototype structure. The global risk aversion gradually receded. The only rise was the economic recession of the United States. In fact, you think too much about global buying orders. Regardless of the recent territorial expansion speech or various taxes, or even selling cards, the purpose is to make the US dollar strong again, and hope to continue global hegemony. Therefore, it is uncertain that all kinds of speeches in the middle of the night stimulate risk aversion. Gold is constantly falling and giving you a V back every day, which is to constantly cultivate your inertia. Falling is an opportunity, and buying in batches is profit. So today is very simple. If the weakness is below 2956, it is at most 2942 to 2947, which is a direct decline, not giving you a second chance to rush high, or quickly reaching a new high, making you feel that gold is bullish again, the world is chasing more, or low-level shorts are forced to chase more hedges, then the market will change quickly.
The short-term operation ideas are as follows:
Pressure: 2955------2975 Support: 2880-----2830
Traders, if you like this idea or you have your own opinion on it, please write it in the comments. I will be happy

3.13CPI is bullish, gold cautiously rises and falls in short terThe CPI data released in the evening was lower than expected, which is bullish for gold in the short term and continues to fluctuate during the day.
In the short-term 1-hour chart, according to 4, the price has risen above the directionless 20-period SMA and 100-period SMA, while the 200-period SMA is rising below the above short-term moving averages. At the same time, technical indicators have lost directional strength and turned slightly lower within the neutral level, predicting that gold prices may fall soon.
Short-term trading: short near 2935, stop loss 2945, take profit 2920/2915

DXY Dollar Index at Key Support: Is a Major Retrace Coming? 💹📉
In this video, we dive deep into the DXY and analyze the current market conditions. 📊 At the moment, the pair is overextended and trading into a critical weekly support level. 🔄 Join me as we break down the trend, price action, and market structure, and explore a potential trade idea based on these insights. 🧠💡 Whether you're a seasoned trader or just starting out, this analysis will give you valuable perspectives on how to approach key levels in the market. ⚠️ This is not financial advice—always trade responsibly! ⚠️ Don't forget to comment, and boost my video if you find value in the content! 👍📈✨

3.11 Analysis of gold short-term operation suggestionsOn Monday (March 10), the latest spot gold (XAU/USD) was quoted at $2915.01, up 0.10% on the day. In the Asian session, the gold price remained in a narrow range around $2914, but since 15:25 Beijing time, gold has fluctuated downward from $2915.39, reaching a low of $2896.73.
Fundamental analysis: The Fed's interest rate meeting is approaching, and the market is cautiously watching
At present, the gold market has entered a sideways consolidation phase, and investors are evaluating multiple factors, including the Fed's upcoming policy meeting on March 19 and the latest economic statements of US President Trump. In an interview with the media, Trump said that the US economy is in a "transition" stage, and the market has generally believed that the US economy is at risk of recession.
Market sentiment and capital flows: Short-term funds are cautious, and gold is still supported
Technical analysis: Long and short divergences are increasing, key support and resistance levels
From a technical perspective, the gold price is currently consolidating around $2890. The key resistance above is the intraday high of $2918.19, followed by the intraday R1 resistance of $2927 and the R2 resistance of $2945. If the gold price breaks through $2945, the market may challenge the historical high of $2956 set on February 24.
In terms of support below, the $2900 integer mark and the S1 support level of $2893 constitute double support. If it falls below this area, the gold price may test the S2 support level of $2878. Technical analysts believe that if Trump does not release additional tariff policy signals in the near future, market sentiment may gradually stabilize, and gold may pull back to the support range in the short term to accumulate power for subsequent gains.
Conclusion: Short-term consolidation, pay attention to the dynamics of the Federal Reserve
Overall, gold is currently maintaining a range of fluctuations, and the short-term trend is subject to the expectations of the Federal Reserve meeting and the uncertainty of the US economic outlook. Investors need to focus on the interest rate meeting on March 19 and the impact of the remarks of Federal Reserve officials on market sentiment in the coming weeks. In the current context, the market still tends to look for buying opportunities in pullbacks. If the gold price remains above $2,893, the bulls will still have a certain advantage.

3.11When will gold break out of its range?Will gold continue to adjust downward after the wash, or will it break upward after this period of consolidation?
1: Trump announced on the 7th that Russia launched a fierce attack on Ukraine. In order to encourage the two sides to sit down at the negotiating table for friendly negotiations, sanctions and tariffs will be imposed on Russia, including banks, until both sides are willing to stop the exchange of fire. This has increased the uncertainty of geopolitical risks, which will be a boost for gold.
2: Fed Chairman Powell reiterated at a press conference on Friday that the current US economic performance is relatively ideal, and the Fed does not intend to rush to cut interest rates next. As we all know, interest rate cuts will stimulate gold to rise, and slowing down the pace of interest rate cuts will form resistance for gold.
Since gold entered the adjustment on February 11, the repeated high-level roller coaster shock wash has been brewing for a month, and it is time to end. The gold price has repeatedly fluctuated around $2,900, and even the non-agricultural data failed to break the support of $2,890 and the pressure of $2,930.
As for gold, the focus is still on $2890 as the support point. As long as it is not lost here, it is still mainly based on reaching the bottom of the box. For players of physical gold, it is not recommended to repeatedly get on and off the gold when the funds are idle. It seems smart but will eventually miss it perfectly.
Trading strategy:
You can consider getting on the train within the range of 2900-2895, and defend below 2880 US dollars. The focus above is on the breakthrough of the 2920-30 pressure area.

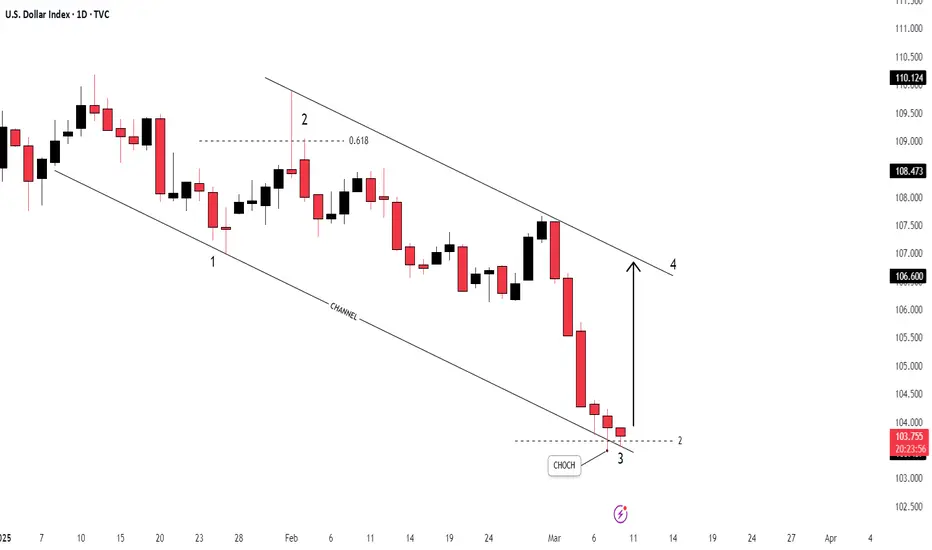
dxyDXY - U.S Dollar Index
Key Points in this Chart :
1. Change of Characteristics ( CHOCH )
2. Bearish Channel
3. Elliot Waves
4. RSI - Divergence
5. Support / Resistance
DXY (Dollar Index) Ready to BUY? | Monthly FVG in Focus! 💰 Smart Money Preparing for a Bullish Move on DXY!
The US Dollar Index (DXY) is approaching a key Monthly Fair Value Gap (FVG), which could act as a strong demand zone. If price reaches this level, we will look for confirmation on lower timeframes (H4/M15) before entering buys.
🔍 Why is this Important?
✅ Monthly FVG as a High-Probability Buy Zone
✅ Institutional Order Flow Aligning for a Bullish Reversal
✅ Strong Demand Expected at FVG
✅ DXY Strength = Bearish Pressure on Gold & Majors
📊 Key Market Levels:
🔹 Monthly FVG Buy Zone:
🔹 First Target:
🔹 Breakout Confirmation Above:
🔹 Invalidation Below:
⚡ Trading Plan:
📌 Wait for price to reach the Monthly FVG
📌 Look for Bullish Confirmation on H4/M15 (BOS, CHoCH, Liquidity Grab)
📌 Enter Buys Once Institutional Reversal is Confirmed
📌 Manage Risk – Watch CPI & FOMC Events
💥 Stronger DXY = Weak Gold & Bearish Pressure on Majors!
💬 Are you buying DXY at the Monthly FVG? Drop your thoughts below! 👇
#DXY #DollarIndex #Forex #SmartMoney #ICT #SMC #Liquidity #TradingView #OrderFlow

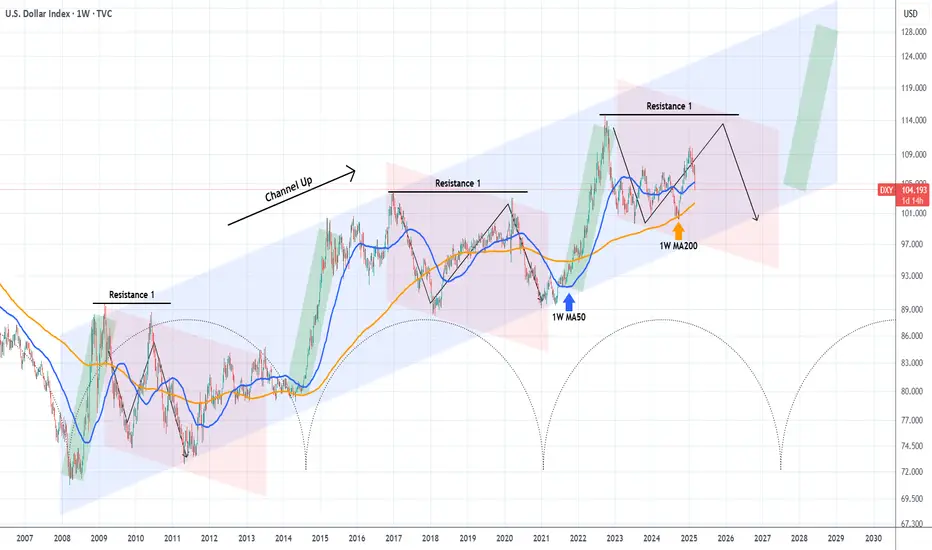
DXY looking for a final push higher before collapse.The U.S. Dollar index (DXY) has been on a strong decline recently, having even broken below its 1W MA50 (blue trend-line).
The multi-year trend is however bullish, a Channel Up pattern since the 2008 market bottom. With the use of the time Cycles tool, we can estimate when the next Bullish Leg starts, and that's not before 2027.
Based on the previous Channel Up corrections (red Channels) we should be expecting one final push towards Resistance 1, before a long-term decline and completion of the Bearish Leg.
As a result, as long as the 1W MA200 (orange trend-line) holds, we can take a low risk buy and target the 112.000 - 114.000 Zone.
-------------------------------------------------------------------------------
** Please LIKE 👍, FOLLOW ✅, SHARE 🙌 and COMMENT ✍ if you enjoy this idea! Also share your ideas and charts in the comments section below! This is best way to keep it relevant, support us, keep the content here free and allow the idea to reach as many people as possible. **
-------------------------------------------------------------------------------
💸💸💸💸💸💸
👇 👇 👇 👇 👇 👇
USD Index Drops Sharply – Watching for Reversal SignalsSo far, it has been a rough week for the USD, with the index dropping from the 107 zone to 104 and breaking below the key 106 support level.
However, the DXY is currently seated on strong support, and a relief rally could be imminent.
I’m closely watching for signs of a reversal for confirmation while keeping an eye for short trades on EUR/USD and GBP/USD.

3.5 Technical analysis of short-term gold operationsOn the first trading day of March, the US dollar index fell sharply. Data released by ISM showed that the US ISM manufacturing index in February was 50.3, lower than the expected 50.8, and the previous value in January was 50.9. 50 is the dividing line between prosperity and recession. Although the ISM manufacturing PMI continued to expand in January, the amplitude was small and tended to stagnate. Both new orders and employment shrank. At the same time, the material purchasing price index soared to the highest level since June 2022. After the data was released, the US dollar index fell further.
Gold rebounded sharply, challenging the 10-day moving average. The 5-day and 10-day moving averages still showed a dead cross. The daily RSI rebounded and reached the key pressure zone of 2900-10 in 4 hours. The short-term trend turned to bullish, but it was still not a strong bull market. You can wait for the opportunity to stabilize and go long near 2875.

DXY Correction Plays Out – Is a Reversal Next? Since the end of January, I have been anticipating a correction in the TVC:DXY , with a target around the 106 support level.
This correction has unfolded as expected, with the Dollar Index touching 106 on Monday, followed by another test and reversal yesterday.
A key observation is that since the early February spike, the DXY has been trading within a falling wedge—a pattern that often signals a potential reversal.
What’s Next?
✅ Bullish confirmation would come with a daily close above the 106.60–106.70 zone. If this happens, we could see a move up to 108.50, a key resistance level.
✅ Interim resistance sits at 107.30, which could also act as a potential target for bulls.
Trading Implications:
If the Dollar Index confirms an upside breakout, it could present selling opportunities in FX:EURUSD , FX:GBPUSD , FX:AUDUSD , and TRADENATION:NZDUSD .

Scenario on DXY 13.2.2025I would see the dollar index like this if I was considering going short I would first consider going above the monthly level of 108.048 if the market continued then I have one more SFP at a price around 108.6 if I was going to talk about a long position then first around the monthly level of 107.053 then the next one below the daily level of 106.724.

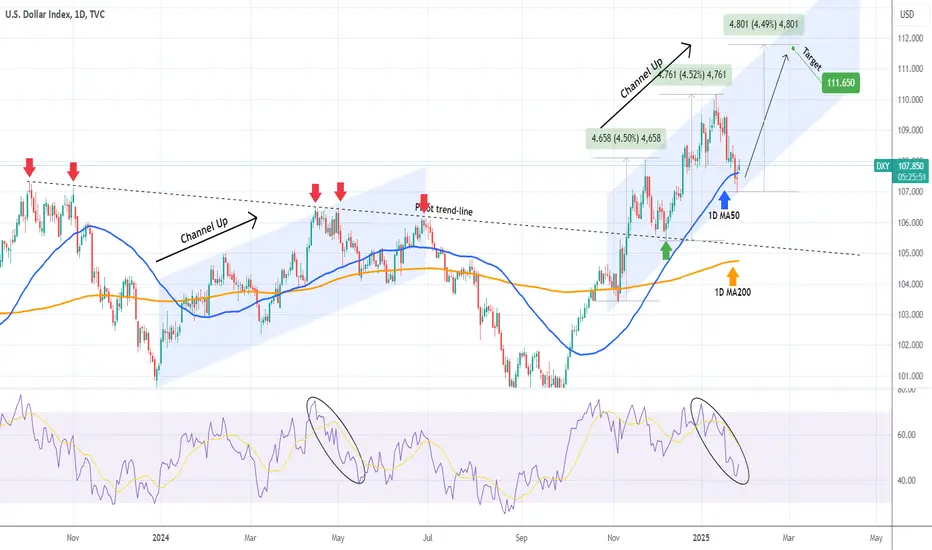
DXY rebounding on the 1D MA50 and bottom of Channel Up.The U.S. Dollar Index (DXY) has been trading within a Channel Up since the November 05 2024 Low and the break-out above the 1D MA200 (orange trend-line). Yesterday it made a new Higher Low exactly at the bottom of the Channel and shortly after breaching the 1D MA50 (blue trend-line).
This MA recovery confirms the start of the pattern's new Bullish Leg. The previous two delivered a rise of exactly +4.50%, and as such we will be looking for a similar Target at 111.650.
Note that, even though the 1D RSI resembles the May 15 2024 Low, which despite an initial rebound, it was rejected on the Lower Highs trend-line at the time, now the long-term trend has shifted to bullish as that Lower Highs trend-line turned into Support on the December 06 2024 contact.
-------------------------------------------------------------------------------
** Please LIKE 👍, FOLLOW ✅, SHARE 🙌 and COMMENT ✍ if you enjoy this idea! Also share your ideas and charts in the comments section below! This is best way to keep it relevant, support us, keep the content here free and allow the idea to reach as many people as possible. **
-------------------------------------------------------------------------------
💸💸💸💸💸💸
👇 👇 👇 👇 👇 👇
DXY- Start of correction?In my previous analysis of the DXY, I mentioned that the index might begin a correction after more than three months of upward movement and a 10% increase.
Yesterday, the market opened with a downside gap and broke below the rising trendline that had been supporting the price since the 100 mark. This suggests that 110 could now serve as a local top. As long as the price remains below this level, shorting the USD currency could present a viable trading opportunity.
I am currently looking for buying opportunities in currency pairs such as EUR/USD, GBP/USD, AUD/USD, and NZD/USD.

DXY could start correcting soonThe last quarter of 2024 was exceptionally bullish for the DXY, with the price climbing from 100 to a peak around 109—a substantial 9% increase in a relatively short period.
The bullish momentum has continued into the start of 2025.
However, since late December, the price action has become more overlapping, which could indicate the potential for a reversal.
At present, the price remains above the bullish trendline, so there are no clear reversal signals yet.
That said, it’s important to monitor for a downside break. If such a scenario occurs, the index could drop toward the 106 support level.

Bearish drop?US Dollar Index (DX is reacting of the pivot which aligns with the 61.8% Fibonacci retracement and could drop to the 1st support.
Pivot: 109.402
1st Support: 108.50
1st Resistance: 110.17
Risk Warning:
Trading Forex and CFDs carries a high level of risk to your capital and you should only trade with money you can afford to lose. Trading Forex and CFDs may not be suitable for all investors, so please ensure that you fully understand the risks involved and seek independent advice if necessary.
Disclaimer:
The above opinions given constitute general market commentary, and do not constitute the opinion or advice of IC Markets or any form of personal or investment advice.
Any opinions, news, research, analyses, prices, other information, or links to third-party sites contained on this website are provided on an "as-is" basis, are intended only to be informative, is not an advice nor a recommendation, nor research, or a record of our trading prices, or an offer of, or solicitation for a transaction in any financial instrument and thus should not be treated as such. The information provided does not involve any specific investment objectives, financial situation and needs of any specific person who may receive it. Please be aware, that past performance is not a reliable indicator of future performance and/or results. Past Performance or Forward-looking scenarios based upon the reasonable beliefs of the third-party provider are not a guarantee of future performance. Actual results may differ materially from those anticipated in forward-looking or past performance statements. IC Markets makes no representation or warranty and assumes no liability as to the accuracy or completeness of the information provided, nor any loss arising from any investment based on a recommendation, forecast or any information supplied by any third-party.

DeGRAM | DXY prepare for correctionThe DXY is in an ascending channel between trend lines.
The price is moving from the dynamic resistance and the upper boundary of the channel.
The chart maintains an upward structure, but the growth rate has slowed down and indicators indicate a hidden bearish divergence.
We expect a correction.
-------------------
Share your opinion in the comments and support the idea with like. Thanks for your support!

DXYDXY - U.S Dollar Index
Bullish Channel as an channel as an Corrective Pattern in Short Time Frame
Break of Structure
Completed " 12345 " Impulsive Waves
RSI - Divergence
Change of Characteristics

DollarDXY - U.S Dollar Index
Completed " 12345 " Impulsive Waves
Break of Structure
Rising Wedge as an Corrective Pattern in Short Time Frame
RSI - Divergence
Change of Characteristics

DXY Dollar Index Market Bullish Heist Plan🌟Hi! Hola! Ola! Bonjour! Hallo!🌟
Dear Money Makers & Robbers, 🤑 💰
Based on 🔥Thief Trading style technical and fundamental analysis🔥, here is our master plan to heist the DXY Dollar Index market. Please adhere to the strategy I've outlined in the chart, which emphasizes long entry. Our aim is the high-risk Red Zone. Risky level, overbought market, consolidation, trend reversal, trap at the level where traders and bearish robbers are stronger. 👀 So Be Careful, wealthy and safe trade.💪🏆🎉
Entry 📈 : You can enter a Bull trade at any point after the Breakout.
however I advise placing Buy limit orders within a 15 or 30 minute timeframe. Entry from the most recent or closest low or high level should be in retest.
Stop Loss 🛑: Using the 4H period, the recent / nearest low or high level.
Goal 🎯: 110.500
Scalpers, take note : only scalp on the Long side. If you have a lot of money, you can go straight away; if not, you can join swing traders and carry out the robbery plan. Use trailing SL to safeguard your money 💰.
Based on the fundamental analysis, I would conclude that the DXY (US Dollar Index) is: Bearish
Reasons:
Interest rate differential: The Federal Reserve's (Fed) interest rate (4.50%) is high compared to other major economies, but the rate hike cycle is expected to slow down, which could lead to a decline in the DXY.
Economic growth: The US GDP growth (2.1%) is slowing down, and the economy is facing headwinds from trade tensions and global economic uncertainty, which could lead to a decline in the DXY.
Trade balance: The US trade deficit (USD 50 billion) is large and growing, which could put downward pressure on the DXY.
Fiscal policy: The US fiscal policy is becoming increasingly expansionary, which could lead to a decline in the DXY.
However, it's essential to consider the following risks:
Global economic slowdown: A slowdown in global economic growth, particularly in China and Europe, could lead to a flight to safety and support the DXY.
Geopolitical tensions: Escalating geopolitical tensions, particularly in the Middle East and North Korea, could lead to a flight to safety and support the DXY.
Fed's monetary policy: The Fed's dovish stance and potential interest rate cuts could support the DXY.
Please note that this is a general analysis and not personalized investment advice. It's essential to consider your own risk tolerance and market analysis before making any investment decisions.
Take advantage of the target and get away 🎯 Swing Traders Please reserve the half amount of money and watch for the next dynamic level or order block breakout. Once it is resolved, we can go on to the next new target in our heist plan.
Keep in mind that these factors can change rapidly, and it's essential to stay up-to-date with market developments and adjust your analysis accordingly.
💖Supporting our robbery plan will enable us to effortlessly make and steal money 💰💵 Tell your friends, Colleagues and family to follow, like, and share. Boost the strength of our robbery team. Every day in this market make money with ease by using the Thief Trading Style.🏆💪🤝❤️🎉🚀
I'll see you soon with another heist plan, so stay tuned 🫂

DXYDXY - U.S Dollar Index
Bullish Channel as an Corrective Pattern in Short Time Frame
Break of Structure
Completed " 12345 " Impulsive Waves
Change of Characteristics
Strong Support
