TSM great potential before earnings call? Value to be collected!Hi guys we would be taking a look into our analysis for TSM!TSMC (TSM) Stock: Positioned for
Strong Growth Despite Tariff Pressures -
Taiwan Semiconductor Manufacturing Company (TSMC), the world’s leading contract chipmaker, continues to shine as a long-term winner in the semiconductor space, even amid renewed trade tensions and potential tariffs.
1. Resilience Amid Tariffs and Trade Tensions
While the U.S. has recently introduced or hinted at higher tariffs on tech-related imports from China, TSMC stands out due to its strategic positioning. As a Taiwan-based company with increasing investments in the U.S., including a major Arizona facility, TSMC is well-insulated from the harshest tariff implications. In fact, the shift toward U.S. domestic chip production could boost TSMC's presence and government support, solidifying its role in global supply chains.
2. Unmatched Technological Leadership
TSMC is years ahead of competitors in cutting-edge semiconductor manufacturing, particularly in advanced nodes like 3nm and 2nm chips. This technology edge secures high-value contracts with top-tier clients like Apple, NVIDIA, and AMD, ensuring a steady and growing revenue stream.
3. Surging Demand for AI and High-Performance Computing
With the global explosion of demand for AI infrastructure, data centers, and high-performance computing, TSMC is perfectly positioned. It is the go-to foundry for the most advanced AI chips, giving it a critical role in powering the next generation of tech innovation.
4. Strategic Global Expansion
TSMC’s global expansion—including new plants in the U.S., Japan, and Germany—reduces geopolitical risks and enhances its ability to serve major markets locally. These moves also align with government incentives and support from the CHIPS Act and similar programs.
Outlook:
TSMC is not only weathering the global trade climate—it’s thriving. Its dominant market share, world-class technology, and expanding global footprint give it a strong competitive moat. With rising AI demand and the shift toward local production, TSM is set to benefit on multiple fronts.
TSM stock remains a high-conviction play for investors looking to capture the future of tech.
TSMC has consistently delivered impressive financial results, with the company surpassing analyst expectations in the past 12 consecutive quarters. For instance, in the fourth quarter of 2024, TSMC reported earnings per share (EPS) of $2.24, exceeding the consensus estimate of $2.16. This track record underscores the company's robust operational efficiency and market demand for its advanced semiconductor solutions.
Upcoming Earnings Call
Investors are anticipating TSMC's next earnings call scheduled for Thursday, April 17, 2025, before the market opens. Analysts expect the company to report an EPS of $2.02 for the first quarter of 2025. Given TSMC's history of exceeding expectations, there is optimism that the company will continue its trend of strong financial performance.
EPS beat estimates 16 times in 17 quarters!!!!!
We are targeting approximetly 18% increase!!!
📌 Trade Plan
📈 Entry: 152
✅ Target 183
❌ SL: 128
Earnings

Is $GERN a stock for "Strong Holders"?Or is it just another stock whose value will be wiped out in the next few quarters, and the company will simply lose its listing on the Nasdaq?
Investors are likely to get an answer to this question today, before the market opens, when NASDAQ:GERN reports its quarterly earnings.
The company has an approved drug and has already begun commercialization, with a promising start.
Last quarter, the company generated $28 million in revenue, and this quarter, revenue is expected to reach $61.8 million.
The company has already achieved positive gross margins, and I expect them to improve significantly from the current 27% in the last quarter.
Operating expenses are close to $30 million per quarter, so we can expect a quick path to operating profitability.
Invested capital is around $135 million, which means that with an operating profit of $10 million per quarter, we could see interesting returns on invested capital.
The company is led by John A. Scarlett, M.D., who previously worked at NASDAQ:CTMX for six years, during which the company lost about 90% of its value.
There is some positive news regarding European approval: "The Committee for Medicinal Products for Human Use of the European Medicines Agency has issued a positive opinion." A decision is expected in the coming months, if not days, which should serve as a strong catalyst for the stock price.
The market valuation has dropped to $1.4 billion, despite having an FDA-approved drug in the U.S.
Cash reserves will be important as they indicate how much time the company has to develop without diluting its capital. In the last report, cash and short-term investments totaled $339 million, and on November 7, the company announced securing $250 million in funding, with the potential to increase it to $375 million.
As a result, the company has $589 million in cash reserves minus operating cash flow. How much will remain in the coffers?
The company should have enough cash for more than 12 months of successful operations, operational efficiency is improving, we are awaiting European approval, and only the quality of management raises doubts.
But do these doubts really hold weight given the current trajectory?
There are only a few hours left until the earnings report is released. Let's see what awaits us.
Strong Holders
Profiting From Strength
📉✊📈

City Group this weeks best choice from the earnings calendar!Hi guys we would take a look into our perspective for Citygroup, which out of this weeks earnings stocks gives us the best potential, we are targeting a whoping 20% increase for our end goal.
Citigroup (NYSE: C) is demonstrating strong growth potential in 2025, driven by robust earnings, strategic initiatives, and favorable market conditions. Here's our comprehensive analysis focusing on Citigroup's growth prospects:
📈 Recent Performance Highlights
Q1 2025 Earnings: Citigroup reported a 21% year-over-year increase in net income, reaching $4.1 billion ($1.96 per share), surpassing analyst expectations of $1.85 per share. Revenue rose 3% to $21.6 billion, exceeding forecasts. The growth was primarily driven by a 23% surge in stock trading revenues amid market volatility and increased client activity.
Return on Tangible Common Equity (RoTCE): The bank's RoTCE improved to 9.1%, nearing its target range of 10–11%, indicating enhanced profitability and efficient capital utilization.
📊 Growth Metrics & Analyst Outlook
Earnings Per Share (EPS) Growth: Analysts project a 15.3% annual EPS growth for Citigroup over the next five years, outpacing peers like Bank of America (9.0%) and JPMorgan Chase (3.9%).
Revenue and Earnings Growth: Citigroup is forecasted to achieve a 9.8% annual earnings growth and a 7.9% revenue growth over the next three years.
Share Repurchase Program: The bank has initiated a $20 billion share buyback program, reflecting confidence in its financial strength and commitment to returning capital to shareholders.
🚀 Strategic Initiatives & Market Position
Operational Efficiency: Citigroup is investing in technology and streamlining operations, including reducing reliance on external IT contractors and enhancing data management systems. These efforts aim to improve efficiency and regulatory compliance.
Market Leadership: The bank's diversified business model, encompassing trading, wealth management, and banking services, positions it well to capitalize on various market opportunities.
⚠️ Market Considerations
Economic Uncertainty: While Citigroup's performance is strong, broader economic uncertainties, including potential recessions and regulatory changes, could impact future growth. Analysts are monitoring these factors closely.
✅ Our Conclusion
Citigroup's robust earnings growth, strategic initiatives, and strong market position make it a compelling candidate for investors seeking growth opportunities in the financial sector. The bank's focus on operational efficiency and capital return strategies further enhances its growth prospects!
The entry would go as following -
Entry point : 63.80
Target 1 : 71.69 - just above the GAP which was previously formulated, when we pass it this would cement our uptrend formation.
Target 2 : 75.30 - finalizing almost 20% growth of the stock which would be around the strong resistance area.
Stop Loss : 55.50 - around the bottom zone , which there was a lot of volume supported by the buyers.

HOOD daily chart: breakout or fakeout? Key zone approaching.Robinhood's stock has formed a falling wedge pattern on the daily chart, indicating a potential bullish reversal. The price has broken above the 0.618 Fibonacci level at $44.00, suggesting further upside potential. Next targets are $48.40, $52.79, $58.22, and $67.00. RSI and MACD indicators confirm bullish momentum.
Fundamental Factors:
Robinhood continues to show revenue and profit growth, supporting positive investor sentiment. The company is expanding its services and attracting new users, strengthening its market position.
Scenarios:
Main scenario: continued rise to $48.40, then to $52.79 and higher.
Alternative scenario: pullback to $39.71 with potential decline to $36.00.

DoorDash (NASDAQ: $DASH) Gains Strength Ahead of May EarningsDoorDash, Inc. (NASDAQ: NASDAQ:DASH ) is showing strong momentum in a volatile market. As of April 11, DASH closed at $180.49, up 1.10% for the day. The stock has risen about 9% year-to-date, while the overall Computer and Technology sector has dropped around 11.8%. This places DoorDash ahead of many of its peers.
DoorDash belongs to the Computer and Technology group, which ranks #6 out of 16 sectors based on the Zacks Sector Rank. The company currently holds a Zacks Rank of #2 (Buy), signaling positive analyst sentiment. Over the last three months, analysts have revised DoorDash's full-year earnings estimate up by 14.7%. This indicates growing confidence in the company’s future performance.
Investors are now watching closely as DoorDash prepares to release its earnings report on May 7, 2025. The stock's upward trend and revised estimates may influence how it reacts to the upcoming results.
Technical Analysis
The daily chart shows that DASH recently bounced off a strong support zone around $162. This zone has acted as a demand area before, pushing the price higher in past sessions. Currently, DASH is approaching key resistance level at $200. A break above these could lead the stock toward the recent high at $215.25. The chart also suggests a possible retracement before a new leg up, reflecting a bullish continuation structure.
Volume increased during the bounce, indicating strong buying interest. RSI is at 48.16, which suggests neutral momentum with room for further upside. DoorDash remains one to watch heading into earnings season.

Netflix Earnings Growth Expected As It Prepares For Q125 ResultsNetflix (NASDAQ: NASDAQ:NFLX ) is set to report its earnings for the quarter ending March 2025 on April 17. Analysts expect year-over-year growth in both revenue and earnings. However, consensus earnings per share (EPS) estimates have been revised down slightly by 0.07% over the past 30 days. This suggests a cautious outlook among analysts.
At the close on April 11, Netflix stock traded at $918.29, down by 0.31%. In after-hours trading, the price edged slightly higher to $919.80. The stock traded with a volume of 4.07 million shares. RSI stands at 47.76, reflecting neutral momentum.
The final result could trigger a sharp price move. A positive earnings surprise might push the stock higher. On the other hand, a miss could lead to a decline. The outcome will also depend on management’s commentary during the earnings call.
Technical Analysis
On the daily chart, Netflix recently bounced off a key demand zone near the $820–$830 range. This zone had previously served as a strong support area. After touching this level, the price formed a reversal candle, signaling potential buying interest.
The stock is now hovering around $918.29, near the 50-day and 100-day moving averages at $961.61 and $931.24, respectively. If the price clears these levels, it may aim for the recent high of $1,064.50. A short-term retracement could occur before a possible continuation higher.
Volume analysis shows a spike during the bounce from support, indicating accumulation. The price pattern suggests a bullish structure is forming. Overall, eyes remain on the April 17 earnings report for the next major move, which might see Netflix surge to a new all-time high.

BlackRock Beats EPS Estimates Despite Revenue Miss in Q1 2025 BlackRock Inc. (NYSE: NYSE:BLK ) reported adjusted earnings per share (EPS) of $11.30 for Q1 2025. This beat the Zacks Consensus Estimate of $10.25, marking a 10.24% surprise. In the same quarter last year, EPS was $9.81.
Revenue came in at $5.28 billion, missing the estimate of $5.33 billion by 1%. However, it rose from $4.73 billion a year earlier. The company has surpassed EPS estimates in all four of the last quarters and has topped consensus estimates twice in that span. In the previous quarter, BlackRock posted EPS of $11.93, beating the $11.27 estimate. That represented a surprise of 5.86%.
BlackRock operates in the Financial - Investment Management industry. The market now awaits management’s outlook for future earnings. This will shape short-term price direction. So far in 2025, BlackRock shares have dropped 16.2%. In comparison, the S&P 500 has declined 10.4%.
Technical Analysis
BlackRock rebounded from a strong support zone near $780. This level aligns with the long-term horizontal support level that has held for over 3 years now. The RSI sits at 41, indicating it is nearly oversold. However, a bullish reversal momentum is forming around the support zone.
If the price continues to rise, resistance and target lie at the $1,084.22 recent high. A break above $950 may trigger a run toward the $1,000–$1,084 range. If the price is rejected, it could revisit the $780 support or possibly the ascending trendline sitting below the horizontal support.

Morgan Stanley (NYSE: MS) Reports Strong Q125 ResultsMorgan Stanley (NYSE: NYSE:MS ) Beats Q1 estimates with record Equity Trading Revenue. The bank posted earnings per share (EPS) of $2.60, beating analyst expectations of $2.18. Revenue reached a record $17.74 billion, topping forecasts of $16.44 billion.
The bank's equity trading revenue soared 45% year-over-year. It reached a new high of $4.13 billion as growth came across business lines and regions. Asia showed particularly strong performance. Prime brokerage and derivatives led gains, fueled by high client activity in volatile markets.
Morgan Stanley shares dropped 1% after the earnings release. However, the stock remains up over 20% in the past year. Volatility in global markets helped trading desks outperform.
Technical Analysis
Morgan Stanley bounced sharply from the $95 support zone. Buyers stepped in near the previous breakout level. Volume increased and confirmed renewed interest. This was seen as Trump paused tariffs for the next 90 days as well. Current price action suggests a recovery trend. The RSI stands at 39, hinting at oversold conditions. A potential path points to $142.03, which acts as the immediate resistance level.
If the price breaks $113 cleanly, momentum could carry it to $130 and beyond. If it fails, it is most likely to retest $95 support level. A strong break above recent highs would confirm bullish continuation. For now, Watch out the $113 and $142 levels closely.

CXAI Target $5A breakout of this triangle pattern could see CXAI move to $5.
Fundamentals and recent spike in volume looks good.
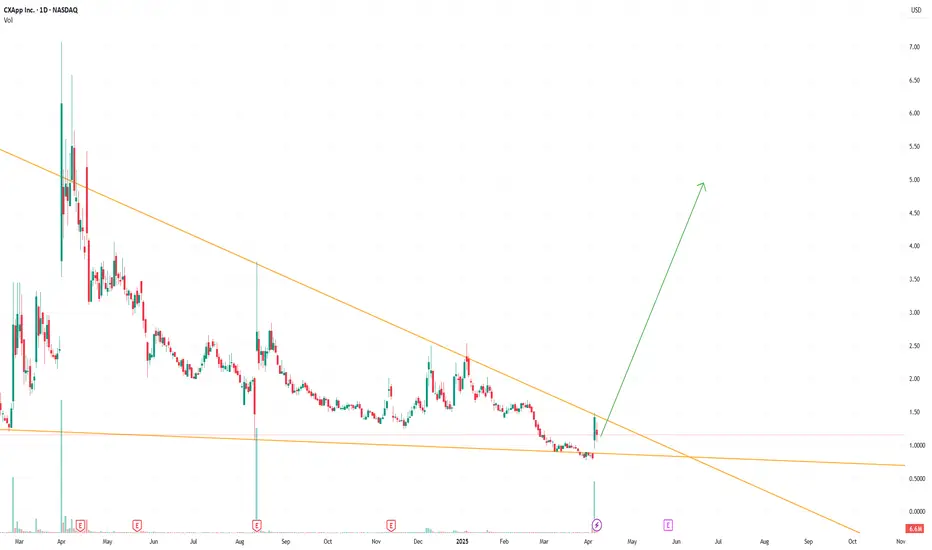
Good Price to Accumulate for Long TermCurrent price is trading at 3 times to Revenue/share which is on the lower side of it's historical valuation. Revenue has been growing over the years and it is trading at a good valuation. What else is needed to call it a good buy? Happy Investing :)

NXU & Lynx: Could we see a merge/acquisition in the future?Nxu's Strategic Partnership with Lynx Motors
Nxu, Inc. (NASDAQ: NXU), a company specializing in innovative EV charging and energy storage solutions, has announced a strategic partnership and investment in Lynx Motors. This partnership is outlined in a letter of intent (LOI) and represents a significant step in Nxu's commitment to electrification and the future of electric vehicles (EVs).
Key Details of the Partnership
Strategic Investment: Nxu's investment in Lynx Motors is structured as a share exchange, with $3 million in Nxu shares being exchanged for $3 million in Lynx shares. This investment will be reflected as an asset on Nxu's balance sheet.
Board Representation: As part of the transaction, Nxu will receive a seat on Lynx's Board of Directors, indicating a deep level of involvement and influence in Lynx's strategic direction.
Collaborative Development: Nxu aims to assist Lynx in leveraging its vehicle and charging technology to expedite the development of electrified products. Lynx Motors is known for reimagining classic vehicles with modern amenities and powertrains, blending tradition with innovation.
Financial Support: Lynx will issue an interest-free promissory note of $250,000 to Nxu in exchange for a $250,000 bridge loan, further solidifying the financial collaboration between the two companies.
Professional Analysis
Complementary Strengths: This partnership leverages Nxu's expertise in EV charging and energy storage with Lynx's focus on electrifying classic vehicles. It's a strategic alignment that combines technological innovation with a unique market niche.
Market Positioning: Lynx's approach to electrifying popular classic cars, coupled with its robust reservation list, suggests strong market demand. Nxu's involvement could accelerate Lynx's path to significant revenue and profitability.
Impact on Nxu's Market Compliance: The partnership is a step towards Nxu's compliance with Nasdaq's listing standards, potentially increasing shareholder equity and market confidence.
Future Prospects: The collaboration between Nxu and Lynx, especially in the realm of EVs, aligns with the broader trend towards electrification in the automotive industry. This partnership could position both companies favorably in a rapidly evolving market.
Conclusion
The strategic partnership between Nxu and Lynx Motors represents a synergistic collaboration that could enhance both companies' positions in the EV market. By combining Nxu's charging technology with Lynx's innovative approach to vehicle electrification, this partnership holds the potential for significant advancements in the EV sector, offering promising prospects for both companies and their stakeholders.

SNOW Finds Support at 200-Day SMASnowflake has been trading within a wide range between 108 and 240 over the past three years. During this period, revenue growth has remained steady, but operating and R&D expenses have consistently increased. This is a company that prioritizes growth and invests heavily in research, expanding its product offerings and business relationships.
However, the recent downturn, driven by tariffs and the broader selloff in AI and cloud-related stocks has exposed Snowflake's vulnerabilities.
The company reports reflect this caution. Recently, SNOW has received both downgrades and buy signals, highlighting analyst and market indecision. In such an environment, the stock’s performance will likely lean heavily on broader index movement. With a beta above 1.5, SNOW is expected to react more sharply to market swings. The consensus 12 month target still shows 38% upward potential.
Currently, Snowflake is finding support at the 200-day simple moving average. If the market manages to weather the impact of the April 2 tariffs and potential countermeasures, SNOW could stage a solid rebound. On the downside, the 130–135 zone stands out as a key support area just below the moving average.

Euro March 26, 2025All it want to take out the PDL - No strength for PDH at all even after all scenerios build supporting PDH as Liquidity

Think Like a Pro: Trade with Discipline, Not Emotion **Taming Greed: The Secret to Long-Term Trading Success**
Trading is a battlefield of emotions—**excitement, fear, hope, and greed**. Among them, **greed is the silent killer**, pushing traders to overtrade, overleverage, and chase the market, ultimately leading to disaster.
As the saying goes:
📉 **“Bulls make money, bears make money, but pigs get slaughtered.”**
**Why Greed is Your Worst Enemy**
Fear may hold you back, but **greed pushes you into reckless decisions**. It makes you **ignore your trading plan, risk too much, and hold losing trades for too long**—all in pursuit of bigger gains.
But here’s the truth: **The market rewards patience, not desperation.**
**How to Keep Greed in Check & Trade Like a Pro**
🔥 **Follow a Strict Trading Plan**
A well-defined **plan is your shield against impulsive decisions**. Know your entry, exit, and risk before placing a trade. **Discipline beats greed—every time.**
📊 **Master Risk Management**
Avoid the temptation to **bet big for quick gains**. A strong **risk strategy protects your capital** and ensures survival in the long run. The goal isn’t just to win—it’s to stay in the game.
⏳ **Say No to Overtrading**
More trades don’t mean more profits—**it usually means more losses**. Trade **with precision, not emotion**. If you’re trading just for the thrill, **you’re gambling, not investing**.
**Success = Patience + Discipline**
Greed is an illusion—it promises wealth but delivers ruin. The real path to trading mastery lies in **consistency, control, and calculated risks**.
💡 **Trade smart. Stay disciplined. Build wealth the right way.**

Angi | ANGI | Long at $20.05***New analysis / price targets given the recent 1/10 split:**
The historical simple moving average (SMA) I've selected for Angi (formerly Angie's List Inc) NASDAQ:ANGI is starting to enter stock price. This often means a directional change in price: up in this case. The price drop after the last earnings, I believe, was an algorithmic move for price entry/further consolidation. If true, the two large gaps above may be filled in the future. 70M float, 20% short interest...
Fundamentally, Angi maintains a solid financial foundation with $395 million in cash and cash equivalents. The company's free cash flow increased $29.2 million to $78.4 million for the first nine months of 2024, demonstrating strong cash generation capabilities. The company's transition to a consumer choice model, already successful in its European operations, positions Angi to capture greater market share. Despite revenue headwinds, Angi demonstrates robust financial health with operating income increasing to $7.8 million in third-quarter 2024, a significant improvement from the previous year. The company's adjusted EBITDA grew 27% to $35.4 million, while year-to-date operating income reached $20 million with adjusted EBITDA rising 47% to $114 million, showcasing effective cost management and improving operational efficiency.
Thus at $20.05, NASDAQ:ANGI is in a personal buy zone (this is the adjusted price from the original entry in December 2024 at $2.00, post 1/10 split). There absolutely could be more downside aside for this stock, but it is a personal buy and hold for the coming years (unless fundamentals drastically change).
Targets:
$22.50
$25.00
$30.00
$37.00

FCX - We had a great month, can we continue with the uptrend?FCX
Looking for a potential buy!
🔍 Technical Context:
FCX had a tremendous up-beat with 24% increase in the stock just in march!
MACD Bullish Crossover: A clear bullish cross on the MACD confirmed upward momentum.
RSI Strength: The RSI remains in bullish territory, signaling further upside potential.
Favorable Risk-Reward Setup: The stock maintains support above breakout levels, offering an attractive trade opportunity.
📰 Fundamentals
Analyst Upgrades: J.P. Morgan and Scotiabank both issued upgrades and increased their price targets, reflecting confidence in FCX’s future performance.
Tariff Advantage: Potential U.S. tariffs on imported copper could benefit domestic producers like Freeport-McMoRan, increasing their advantage.
Strategic Policy Support: FCX is advocating for copper to be classified as a critical mineral, which could unlock tax credits and boost annual profits by up to $500 million.
📌 Trade Plan
📈 Entry: 41.90
✅ Target: 58.30
❌ SL: 23.90
💡 Looking for a potential 35% increase!

CEMIG shares show projections of considerable declineCEMIG shares are showing a considerable decline in the coming months . Unofficial studies indicate a Submarket exposure of around 700 average MW, with a Long position in the Northeast submarket and a Short position in the Southeast submarket for the year 2025. The effects of these exposures will start to affect the company's cash flow as of the financial settlement in March/25 (which should happen by the end of April/25), extending until mid-July/25. The study indicates effects of around -R$200 million in Q1/2025, which could reach -R$500 million by Q2/2025.
BMFBOVESPA:CMIG3
BMFBOVESPA:CMIG4
BMFBOVESPA:CMIGP1!

ANTM Elliott Wave CountQ4 2024 is set to be very shiny for ANTM. Gold sales for Q4 only equals to 15 tons, meanwhile the first 9 months of 2024 amounts to only 28 tons. Additionally, nickel sales also jumped in the fourth quarter.
Chart-wise, ANTM just finished its fourth wave yesterday, quite a steep drop. Volume during was really good from the first until the third wave, and it dried up on this current fourth wave.
The target for ANTM is about 1750-1765.

Week of March 24 Earnings Plenty of earnings this week from major companies this week including:
Monday
NASDAQ:LUCD
NASDAQ:OCX
NASDAQ:SKYX
NYSE:EPAC
NASDAQ:DFLI
Tuesday
NASDAQ:CSIQ
NYSE:GME ( get your 1DTE calls ready )
NASDAQ:RUM
NASDAQ:PAVM
AMEX:ACCS
Wednesday
NASDAQ:DLTR
NYSE:CHWY
NASDAQ:CAN
NASDAQ:IVA
NASDAQ:MVIS
Thursday
NASDAQ:BITF
NYSE:SNX
NASDAQ:LULU
NYSE:OXM
NASDAQ:PDSB
Friday
NASDAQ:IPA
NASDAQ:KPLT
NASDAQ:SLE
NASDAQ:ZSPC
NASDAQ:SBC
Follow for weekly earnings reports!
NIKE - will the best sportswear deliver?Nike (NYSE: NKE) remains a strong investment choice, driven by its market leadership, brand strength, and impressive financial consistency. With 95% positive quarters since Q2 2021, Nike has demonstrated resilience, profitability, and long-term growth potential. Here’s why it remains an attractive stock:
1. Consistent Financial Performance
Nike’s ability to deliver 95% positive quarters since Q2 2021 highlights its financial stability and strong management. The company has consistently outperformed expectations, maintaining steady revenue growth and profitability even in challenging economic conditions.
2. Global Brand Power
As the world’s leading sportswear brand, Nike commands strong customer loyalty and dominates the athletic apparel and footwear markets. Its global reach, premium pricing power, and continuous product innovation keep it ahead of competitors.
3. Expanding Digital & Direct-to-Consumer Sales
Nike’s digital transformation is driving significant revenue growth. Its direct-to-consumer (DTC) business, including the Nike app and online sales, has improved margins and strengthened customer engagement, making it less reliant on third-party retailers.
4. Strong Market Position & Innovation
Nike continues to lead in innovation with advancements in sustainability, performance gear, and technology-driven products. With ongoing investments in AI, automation, and eco-friendly materials, the company stays ahead in a competitive industry.
5. Long-Term Growth Potential
Nike’s strong brand equity, global expansion, and continued investment in emerging markets position it for sustained growth. Coupled with its impressive track record of positive quarters, Nike remains a reliable and strategic long-term investment.
Entry: 73
Target 107 (the target is set up around the very strong resistance area, if that area is broken we can deffinetely see more momentum to the upside!
SL:55 (Below the strong support area so we can protect the trade)

Neutral or sell COLPALThis is a clear case of raised valuations across most of the stocks. As seen in the Revenue Grid indicator, this stock was trading at 8 to 10 of Price to Revenue ratio, but from July 2023 it suddenly started going up and went to 18 times it's Revenue per share. Why? God knows! :)
Now naturally coming back to it's historic valuation. To get to it's fair price, within a short duration, such as couple of months, levels of 2230 can be seen. Happy Trading :)

Direxion Regional Banks Bull 3X Shares | DPST | Long at $84.89In anticipation of interest rates going lower, a large number of regional bank insiders are buying a significant number of shares of their own stock. Such lowering will likely increase regional bank revenue and move ETFs like AMEX:DPST higher.
Thus, at $84.89, AMEX:DPST is in a personal buy zone.
Targets:
$106.00
$120.00

Accumulate for Long TermNestle is trading at a little discount as compared to it's historic valuation for last 6-7 years. This is a growing stock, so it will be good to buy some shares now. Some details of it's strategies and products portfolio below - Happy Trading :)
Over the past six to seven years, Nestlé India has demonstrated consistent revenue growth, driven by a combination of strategic initiatives and a strong product portfolio. Key factors contributing to this sustained growth include:
1. Innovation and Product Diversification: Nestlé India has prioritized innovation, launching over 140 new products in the past eight years. These introductions span various categories, including science-led nutrition solutions, millet-based products, and plant-based protein options, catering to diverse consumer needs.
BUSINESS-STANDARD.COM
2. Strengthening Core Brands: The company has focused on reinforcing its flagship brands:
Maggi: Achieved the status of the largest market globally for Maggi, driven by balanced product mix, pricing strategies, and volume growth.
THE HINDU BUSINESS LINE
KitKat: India became the second-largest market for KitKat worldwide, reflecting robust performance in the confectionery segment.
THE HINDU BUSINESS LINE
Nescafé: The beverage segment, particularly Nescafé, has seen significant growth, introducing coffee to over 30 million households in the last seven years.
THE HINDU BUSINESS LINE
3. Expansion into New Categories: Nestlé India is exploring opportunities in emerging sectors such as healthy aging products, plant-based nutrition, healthy snacking, and toddler nutrition. These initiatives aim to tap into evolving consumer preferences and health-conscious trends.
CFO.ECONOMICTIMES.INDIATIMES.COM
4. Focus on Premiumization: The company is enhancing its premium product offerings, including the introduction of Nespresso and health science products. This strategic move aims to have premium products contribute to 20% of sales in the long term, up from the current 12-13%.
GOODRETURNS.IN
5. Strategic Partnerships: A notable collaboration with Dr. Reddy's Laboratories to form a joint venture in the nutraceuticals space underscores Nestlé India's commitment to expanding its health science portfolio and leveraging synergies for growth.
THE HINDU BUSINESS LINE
Collectively, these strategies have enabled Nestlé India to maintain a consistent upward trajectory in revenue, effectively adapting to market dynamics and consumer demands.
