AMD: Fibonacci Framework (Fractal Analysis RECAP)In this idea, I’d like to share a quick recap about my unconventional approach to understanding the chaos of the market.
Price movements don’t just mirror fundamentals, they also reshape them in continuity. Relating recent fluctuations to historic swings is crucial, because markets operate within a structured, evolving framework where past price proportions subtly wire the future. The interplay between bulls and bears doesn’t unfold randomly — it reflects recurring behavioral cycles encoded in historical patterns. Each swing carries the imprint of collective psychology, liquidity dynamics, and structural forces, which tend to repeat in varying scales. In Fractal Analysis, I recognize 2 key aspects of price dynamics: magnitude (price) and frequency of reversals (time).
For example, capturing the direction of past bullish wave can be used to define boundaries of future bearish waves. In logarithmic scale, the movements exhibit relatively more consistent angle (as percentage-based distance factors in natural growth).
To build structural framework, we need another 2 chart-based frames of reference because having multiple Fibonacci channels layered across cycle creates a collective framework of confluence zones, where price reactions become more meaningful. When several channels align or cluster around the same price levels, those zones gain credibility as potential support/resistance, because independent measurements are pointing to the same structural levels. This is why by analyzing price within a broader historical context, we gain perspective on where current price action fits within the larger market narrative.
Economic Cycles

The Elliott WaveThe chart above shows the 5 waves which has been travelled by nifty
As per the Elliott wave pattern the coming waves will be a major correction waves with 'ABCDE' pattern most probably, of which wave 'A' has been made by nifty.
NSE:NIFTY

Eur/UsdUtilizing the M30 FVG alongside +OB as our defense area for support and resistance proved to be a strategic move. Running Asia set the perfect stage to effectively target those buy stops.

HBAR AnalysisSummary:
HBAR (Hedera Hashgraph) is the native cryptocurrency of the Hedera network, utilizing Hashgraph technology instead of a traditional blockchain. It is known for its high speed, low transaction fees, strong security, and energy efficiency. HBAR is widely used for smart contracts, fast payments, and enterprise-level decentralized applications (dApps).
Technical Analysis:
HBAR has shown strong resistance during recent market downturns and is currently in a consolidation phase. It has formed a well-structured setup suitable for both long and short trades.
The price is currently forming a Descending Triangle, maintaining a flat support level while making lower highs.
• After breaking the trigger level, it could move up toward the triangle’s resistance.
• There is a possibility of a trading range forming, but if the price confirms a breakout above the triangle, a bullish move may begin.
• If the price loses support and breaks downward, we could see a continuation of the bearish wave.
This setup provides clear trading opportunities depending on the direction of the breakout.

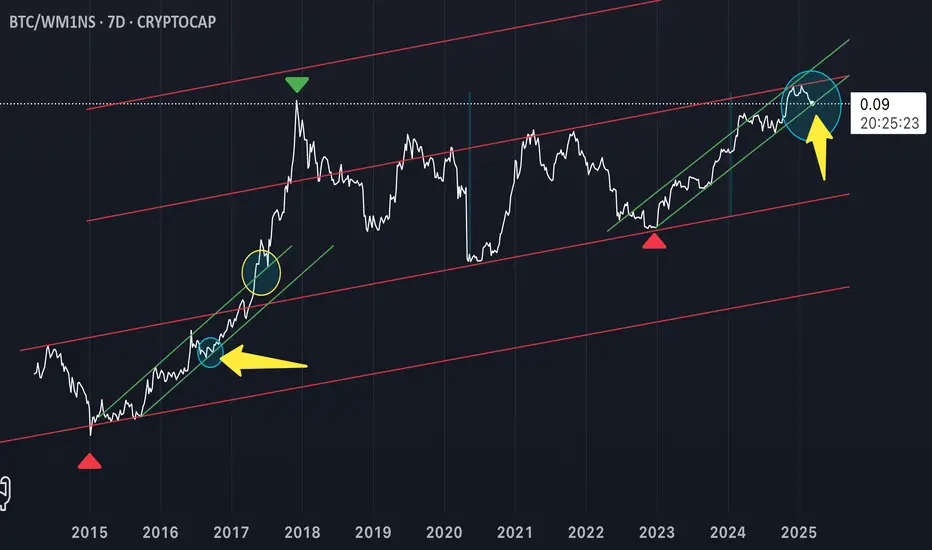
Where is Bitcoin?Squawk! Currently Bitcoin is at the 2nd yellow arrow! Compare to the first arrow for the roadmap my Squawky friends!
Eur/UsdI was hoping for a deeper move below Asia into H1 +OV to target the previous week's high as buy stops.
Missed opportunity, move on to the next day!

Short Idea on EURNZDBased On
- Williams POIV Divergence on 4H
- Interest rate and real rate differential increased
- Cycle analysis and quantitative data
- Overvalued Conditions

COOKIE’s Sweet Potential: Bullish Continuation Ahead?COOKIE 🍪 has shown strong momentum, and if the bull run isn’t over, we could see another leg up. Price action is forming a structure that suggests further upside potential, with key resistance levels in sight. If volume supports the move, a breakout could lead to new highs. 📈
Watching for confirmation signals—higher lows, strong demand zones, and bullish indicators lining up. A healthy pullback could offer prime entries before the next push. Stay cautious, but don’t ignore the signs of continuation.
I’m bullish on $COOKIE. What’s your take? Let’s discuss potential targets and invalidation points! 🍪

Long BTC, Long MSTR, Neutral to XAUExpecting BTC to consolidate relative to Gold for a few more days and then breaking out and outperform Gold. The ratios make it a more attractive trade with more upside potenial. Im buying NASDAQ:MSTR because of it´s leveraged bet in Bitcoin. I believe Microstrategy will outperform BTC in this scenario breaking out to new all time highs.
CME:BTC1!
COINBASE:BTCUSD
BINANCE:BTCUSD
BITSTAMP:BTCUSD
FX_IDC:XAUUSD
OANDA:XAUUSD
NASDAQ:MSTR

Q4 effects on BitcoinTIME BASED LONG TERM BITCOIN SPECULATION
First of all,
This analysis is not about to tell you that the bottom is in or not, this is a fun theory which has no confirmation for the future.
As i see every time Bitcoin enters the November zone, it starts to make a bigger move.
In this analytics maybe not the november month is what matters, it can be analysed by quarters or yearly periods too, but i chose the november zone.
2014 november: (A)
-top of the bull market
2015 (little bit after) november: (B)
-bottom of the bear market
2016 november: (C)
-breakout and retest to the fibonacci zones then rally
2017 (little bit after) november: (A)
-Top of the bull market
2018 (little bit after) november: (B)
-bottom of the bear market
2019 november: (C)
-breakout and retest to the fibonacci zones then rally
2021 november: (A)
-Top of the bull market
2022 november: (B)
-Bottom of the bull market?
We can also identify a gap between C and A period because the rally doesn't end in the next november cycle.
This analytics does not say that the bottom is in, but it can be already in or days/weeks away from the current price.
The structure has to be analysed by self, and this chart could give us a clue where should we see the price a year after.
The price should be in the 30k region to see a retest or a breakout from the zone.
in 2024 we should see 30k usd / BTC, but we don't know that if we will have a rally before it.
Hope i gave you something interesting.
Thanks for reading and have a nice trading carrier:)
(Always bullish on BTC)

Bitcoin Green Channel Are Telling!Waiting for Bitcoin to meaningfully breakout up through this 2nd green channel and confirm, followed by a steeper angle of attack move up! BTC/ WM1NS 7 Day Chart.
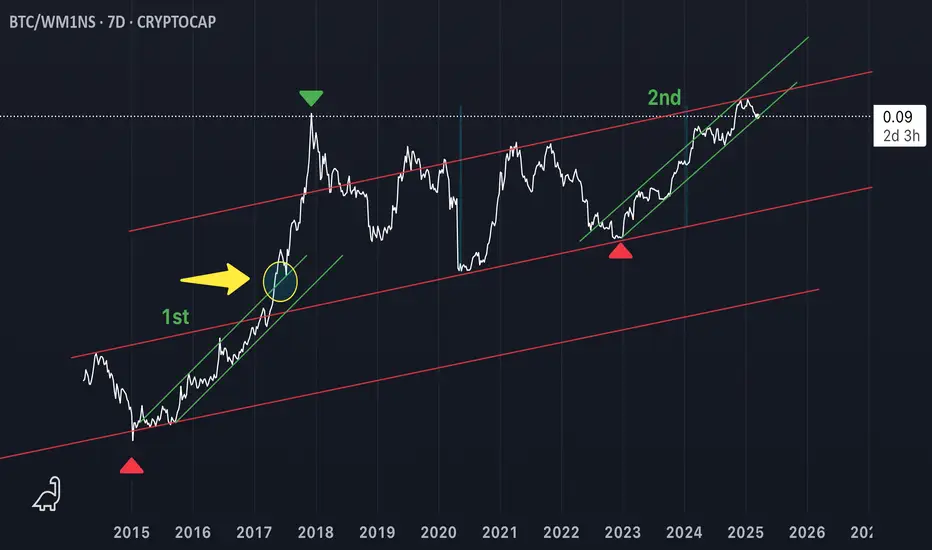
Bitcoin green channels are telling!Waiting for Bitcoin to breakout from the 2nd green channel and confirm meaningfully off of this channel top, higher at a steeper angle of attack! BTC/WM1NS 7 Day Chart

XAU to..... 3k++ ?Upgrades upgrades upgrades. Welcome to fake forex forecast analysis.
I see a huge LQ pool for a DOL to spool her price higher.
With Potus and his tariffs, who knows what may happen.

WIF/USDTHello friends
According to the market cycle, the price decline is ongoing and is expected to continue.
Now the only important support is the green area, which the price reaches there and we will see what reaction we get from the buyers.
Will they support the price or will the decline continue...
If you want to be with us in this alt season, send us a message.
*Trade safely with us*

AmazonAmazon should definitely reach 151.37 (even if it moves up again, it will start to move down again)

[ TimeLine ] Gold 6 March 2025Hello everyone,
I will be using the high and low price levels formed on the following dates as entry points for my trades:
March 6, 2025
We will wait for the price range from these candles to form as indicated with blue box. The trade entry will be triggered if the price breaks out of this range, with an additional buffer of 60 pips.
If the price moves against the initial position and hits the stop loss (SL), we will cut or switch the trade accordingly.

[ TimeLine ] Gold 27-28 February 2025Hello everyone,
I will be using the high and low price levels formed on the following dates as entry points for my trades:
February 27, 2025
and/or
February 27 + 28, 2025
We will wait for the price range from these candles to form as indicated with blue box. The trade entry will be triggered if the price breaks out of this range, with an additional buffer of 60 pips.
If the price moves against the initial position and hits the stop loss (SL), we will cut or switch the trade accordingly.

Integrating Modified ElementEarlier identified angle that maps growth cycle.
It has a strong frame of reference because:
Building blocks are arranged into their Fib orbit.
Direction of Cycle of Highs and Lows match
To validate the angle we can extend to the left to confirm prices respected that angle.
We can see it interconnects entire previous fractal cycle confirming angles credibility and therefore can be further utilized for building predictive modeling.
Relating
⬇︎
Applied

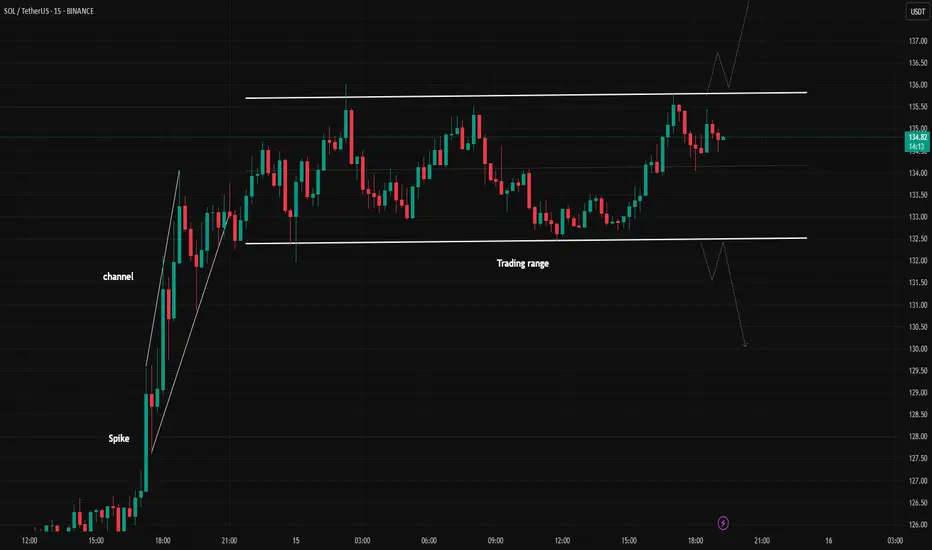
SOLUSDT Upward or downward?Hello,
In the 5-minute timeframe, you can sell at the top of the trading range and buy at the bottom of the trading range (by observing reversal candles and patterns).
Alternatively, you can wait for a breakout and enter in the direction of the breakout.
Be mindful of fake breakouts.
May your trades be profitable!
LINK is set to outperform ETH in this cycle ! 🔥 Hello Traders 🐺
In this idea, I want to talk about LINK/ETH and why we should pay attention to it 👇
As you might know, there are two indicators that usually signal the beginning of Altcoin Season:
1️⃣ BTC.D (Bitcoin Dominance)
2️⃣ ETH/BTC chart
These two factors help us identify when exactly ETH is going to outperform BTC and where the possible price targets are. I've already discussed them in my recent ideas — you can check them out on my profile or in the related ideas section. So make sure to follow me to stay tuned! ✅
⚡️ Why should we pay attention to LINK/ETH right now?
During Altcoin Season, other altcoins start to move alongside ETH, but how they react to ETH’s movements depends heavily on their chart performance against ETH. If an altcoin shows strength against ETH, we can easily see:
🚀 10% pump in ETH price
🚀 25% pump in that specific altcoin
📉 Let’s dive into the LINK/ETH chart:
As you can see, the price has already formed a W pattern and we've tested the neckline multiple times. And you know the rule:
👉 The more we test a support or resistance, the weaker it becomes!
🎯 Now the big question: What is the price target for LINK in this cycle?
📍 First target (minimum): 0.019600 ETH per LINK
📍 Second target: Around 0.03 ETH per LINK
💡 My personal strategy: Sell 50% of your LINK at the second target and keep the rest for bigger gains because LINK has massive potential for this cycle! 🚀
✅ I hope you enjoyed this idea!
Don't forget to like & follow for more 🔥
🐺 KIU_COIN 🐺

Short Idea on Nasdaq (NQ1!)- Stop loss : 22771.25
- Profit target : 20507.75
Based on seasonality,valuation, volume profile levels

Bitcoin is Headed to $36K And It’s Happening NOW!This might not be the most popular opinion, especially among those who still believe the current Bitcoin bull cycle hasn’t ended. However, I encourage you to take a few minutes, approach this with an open mind, and let me know whether you agree or disagree.
Understanding the Previous Cycle (2020–2021)
The last Bitcoin bull cycle began in March 2020, when BTC bottomed at approximately $3,810. It then surged to an all-time high (ATH) of $69,870 in November 2021, marking the cycle top.
By applying a Fibonacci retracement to this entire range, we can see that the golden pocket (0.618 - 0.786 Fib)—often a key support zone during bear markets—fell between $17,700 and $28,690.
Looking at the chart, BTC beautifully retraced into this zone, even dipping slightly below it to form a cycle bottom at $15,500 in November 2022.
The key sign that the bear market had ended and a new bull market had begun was when Bitcoin broke above the 0.786 Fibonacci level of the previous cycle and established a higher high on the weekly chart. This marked a clear shift from a bearish to a bullish market structure.
The Current Cycle (2022–2025)
From the November 2022 bottom, Bitcoin rallied, setting a new ATH at $73,600—just slightly above the previous peak. After some consolidation, it found strong support at the 0.236 Fib level of the previous bull cycle, signaling that the uptrend was still intact.
The real breakout came when BTC surpassed the psychological $100,000 level and consolidated around the -0.5 Fib extension of the previous cycle. The cycle top appears to have been put in after Donald Trump took office in January 2025, marking an approximately 26-month bull run—longer than previous cycles.
However, a major bear market confirmation signal has now emerged: BTC has decisively broken below the 0.236 Fib retracement of this cycle, which historically signals the end of a bull market and the beginning of a new bear phase.
Where is the Next Bottom?
By analyzing the Fibonacci levels of both the previous and current bull cycles, we can identify key potential support zones where Bitcoin may bottom out:
1. $51,370 - $53,700
• This range aligns with:
• 0.236 Fib of the previous bull cycle
• 0.618 Fib of the most recent bull cycle
• This zone has confluence, making it a high-probability support level.
2. $35,600 - $36,500
• This range aligns with:
• 0.5 Fib of the previous bull cycle
• 0.786 Fib of the most recent bull cycle
• If BTC breaks below the first support zone, this is the next key level to watch.
Historically, Bitcoin bear markets last around one year, so we can expect this downward trend to play out over a similar timeframe.
How to Position Yourself?
For long-term investors, these support zones offer prime buying opportunities to accumulate Bitcoin at discounted prices before the next bull run begins. While the market won’t move in a straight line down—expect bounces and fake-outs—the general expectation is that BTC will find its next higher low within one of these zones.
Looking Ahead: Next Bull Cycle Target
If we use the same -0.5 Fib extension strategy that predicted the previous cycle’s top, we can estimate the next bull market peak. Based on the current cycle’s Fib range, the projected ATH for the next bull run would be around $157,000.
Final Thoughts
While nobody can predict the future with certainty, historical price action, Fibonacci levels, and market structure provide strong clues about where BTC is headed next. As always, flexibility is key—if market conditions change, so should our expectations. But if history repeats itself, these levels offer a solid framework for identifying the best entry points and positioning for the next major bull run.
What do you think? Do you agree with this analysis, or do you see it differently? Let me know in the comments!

SMPH Possible Trend ReversalAfter months of downtrend, SMPH seems to be somehow recovering from its bearish sentiment. From downtrend to sideways
Confluence
Macro: Shift from downtrend to sideways
Daily chart: higher lows
RSI: higher lows
Short term outlook: Looking like a 1 month short term uptrend.
Other Notes
Possibly looking to make a DB MB BO and hopefully a DB BT BO
Coming from a macro downtrend, sentiment shifting to defensive stocks. Property sector may not be the first mover post bearish sentiment since its not a defensive sector but perhaps the speculated rate cuts may help.
Earnings also released and looking good.
