GOLD 4H CHART ROUTE MAP UPDATEHey Everyone,
Once again following on from yesterdays update, this 4 chart is also playing out perfectly. After completing both our Bullish 3343 and bearish 3282 targets; we stated price will play tennis between both levels. We also stated that we will look for ema5 cross and lock on either level to determine the next move.
- Ema5 crossed and locked below 3282 opening 3224. This was hit perfectly today on the drop completing the full retracement range. We will now look for a break below this level to open the swing range or failure to lock below will see a retest on the next Goldturn above. Each weighted level is still also providing the 30 to 40 pip bounces, just like we always state.
We will keep the above in mind when taking buys from dips. Our updated levels and weighted levels will allow us to track the movement down and then catch bounces up.
We will continue to buy dips using our support levels taking 30 to 40 pips. As stated before each of our level structures give 20 to 40 pip bounces, which is enough for a nice entry and exit. If you back test the levels we shared every week for the past 24 months, you can see how effectively they were used to trade with or against short/mid term swings and trends.
BULLISH TARGET
3343 - DONE
EMA5 CROSS AND LOCK ABOVE 3343 WILL OPEN THE FOLLOWING BULLISH TARGET
3404
EMA5 CROSS AND LOCK ABOVE 3404 WILL OPEN THE FOLLOWING BULLISH TARGET
3439
EMA5 CROSS AND LOCK ABOVE 3439 WILL OPEN THE FOLLOWING BULLISH TARGET
3503
BEARISH TARGETS
3282 - DONE
EMA5 CROSS AND LOCK BELOW 3282 WILL OPEN THE FOLLOWING BEARISH TARGET
3224 - DONE
EMA5 CROSS AND LOCK BELOW 3224 WILL OPEN THE SWING RANGE
SWING RANGE
3190 - 3138
EMA5 CROSS AND LOCK BELOW 3138 WILL OPEN THE SECONDARY SWING RANGE
SECONDARY SWING RANGE
3088 - 3046
As always, we will keep you all updated with regular updates throughout the week and how we manage the active ideas and setups. Thank you all for your likes, comments and follows, we really appreciate it!
Mr Gold
GoldViewFX
Community ideas

SOL Analysis Deep Dive: Identifying Optimal Entry and Exit ZonesYesterday, SOL gave a sharp downside shakeout, dropping from the weekly open at $147.98 (perfectly retested) down to the 0.5 Fib retracement of the swing at $140.25. Here’s a structured breakdown of the key levels, trade setups, and R:R profiles for both longs and shorts:
🔑 Key Levels & Confluences
1. Higher-Timeframe Opens
Weekly Open & Retest: $147.98 – pivoted price before the drop
Monthly & Prior-Day Open Cluster: $147.98–$146.31 – strong support confluence zone
2. Fibonacci Support Zones
0.5 Fib at $140.25 – primary mean-reversion entry
0.786 Fib (smaller wave) at $138.78 – secondary, deeper support
3. Order Block
Daily Bullish Order Block at $139.87 – just below 0.5 Fib, adds extra support
4. Volume-Weighted Average Price
Anchored VWAP (from ATH $295.83) at ~$166.45 – key upside resistance
5. Market Profile Value Areas (10-Day Range)
Value Area High (VAH) at ~$153.00 – overhead resistance confluence
Value Area Low (VAL) at ~$145.75 – underpins support
📈 Long Trade Setups
1. 0.5/0.786 Fib + Daily Bullish Order Block
Entry: $141-138.78
Stop-Loss: $137.5
Target: $165 (anchored VWAP / Fib zones)
R:R ≈ 9:1
2. Higher-Timeframe Open Cluster
Entry Zone: $147.98–$146.31(monthly/weekly open)
Stop-Loss: $142.5
Target: $165
R:R ≈ 3:1
• Why these levels? The 0.5 Fib is a classic mean-reversion zone, bolstered by the daily order block. The $147–146 zone ties together multiple opens (weekly, monthly, prior-day), offering a solid demand area if price retraces back up.
📉 Short Trade Setup
Trigger: Rejection / swing-failure around $153.4
Entry: $153.4
Stop-Loss: $154.3
Target: Weekly/Monthly open (~$147)
R:R ≈ 6:1
• Low-risk short: A clean rejection at the recent high lets you define risk tightly above the swing, aiming to capture the retrace back to the opens.
🎯 Summary & Game Plan
Primary bias: Look for long entries at the 0.5 Fib ($140.25) or the open-cluster zone ($147–146), with targets toward the anchored VWAP at ~$166.
Alternate bias: A short on clear rejection from $153.4, targeting the opens as support.
Risk management: Keep stops tight (SL below $137.5 or above $154.3) to maximize R:R on your favored setups.
Volume & Price Action: Confirm entries with an uptick in volume or bullish price structure (for longs) or swift failure patterns (for shorts).
Now it’s a waiting game! Let price revisit these zones, watch for confirmation signals, and then scale into your chosen side. Good luck! Don't chase, let the charts come to you!
____________________________________
If you found this helpful, leave a like and comment below! Got requests for the next technical analysis? Let me know.

ADA/USDT: Is ADA Preparing for Its Next Rally?(READ THE CAPTION)By analyzing the #Cardano (ADA) chart on the 3-day timeframe, we can see that over the past few months, the price surged from $0.33 to $1.32, delivering a gain of over 300%. After reaching its highest level in 3 years, it faced selling pressure and corrected down to $0.50.
Currently, Cardano is trading around $0.70, and if the price can hold and close above the $0.65 level, we may expect further upside in the medium term.
The next potential targets are $0.75, $0.81, $0.93, and $1.05, respectively.
Please support me with your likes and comments to motivate me to share more analysis with you and share your opinion about the possible trend of this chart with me !
Best Regards , Arman Shaban

Bitcoin - Repeating History: 100k Next Target?Bitcoin is continuing to move with clean structure, driven by demand imbalances and breakout continuation setups. After the initial breakout from the mid-April range, price moved in a highly technical fashion, consolidating, breaking out, forming a fair value gap, and then retesting it before continuation. That exact structure looks like it's playing out again. Bitcoin just broke out of another multi-day consolidation and left behind a fresh 4h imbalance, suggesting the potential for another leg higher if it respects that zone on a pullback.
Consolidation Structure
The prior breakout came from a tight range just below $86,000. BTC spent several days compressing in that area, then broke out impulsively, creating a 4h FVG and retesting it cleanly. That retest held perfectly and launched a rally of nearly $10,000.
The current setup is structurally the same. BTC spent 8 days consolidating under $95,000, repeatedly testing the resistance without breaking it. It finally closed decisively above, leaving behind another fair value gap. The sequence is familiar, sideways accumulation, breakout, FVG left behind, and now a setup for retest.
Bullish/Bearish Scenarios
The bullish scenario is centered on a retest of the new 4h FVG, located between roughly $94,200 and $95,000. If price pulls back into that imbalance and buyers defend it, the setup for continuation is clean. Based on recent behavior, a successful retest here could easily carry BTC toward the $100,000 level.
If price instead breaks back below $94,000 and falls into the previous consolidation range, that invalidates the breakout structure. In that case, Bitcoin could either enter another range-bound phase or trap longs with a deviation. That would shift the focus to reassessing structure instead of chasing continuation.
Price Target and Expectations
The short-term upside target is $100,000. That level is both a psychological milestone and a likely liquidity magnet. From a structural perspective, it aligns with the last breakout leg, which moved over $9,000 after a similar retest setup. If buyers defend the FVG, there is not much in the way until $100,000.
The momentum behind the breakout supports that expectation. The move was impulsive, clear, and not showing signs of exhaustion. As long as structure holds, price is in a strong position to continue toward that key round number level.
Current Stance
This setup is not a breakout chase, it’s a retest setup. The breakout already happened, and the market left behind a fair value gap that now needs to be tested. If price pulls into the $94K to $95K zone and reacts strongly, that would confirm demand. That’s the moment to step in, with invalidation placed below the FVG and former resistance.
Until then, it's about staying patient and letting price come to the key level. The structure is clear, the plan is defined, and there’s no need to force a trade in the middle of the range.
Conclusion
Bitcoin looks like it’s repeating the exact same structure we saw earlier this month. Range, breakout, FVG, retest, that sequence played out before and led to a major leg higher. It’s playing out again now with nearly identical timing and behavior.
If the 4h imbalance holds, the next phase of this rally likely targets $100,000. The structure is clean, the behavior is technical, and there’s no reason to overcomplicate it. Let price do its thing, wait for the retest, and if the reaction is strong, follow the same playbook that’s already worked once this month.
___________________________________
Thanks for your support!
If you found this idea helpful or learned something new, drop a like 👍 and leave a comment, I’d love to hear your thoughts! 🚀
Make sure to follow me for more price action insights, free indicators, and trading strategies. Let’s grow and trade smarter together! 📈

Mastering Stop Losses: How Not to Trigger Them at the Worst TimeThere are few things more humiliating in trading than setting a stop loss… only to have the market tag it by a hair’s breadth before rocketing in the direction you knew it was going to go.
Oftentimes (hopefully not too often), stop losses are the financial equivalent of slipping on a banana peel you placed yourself.
But stop losses aren't the enemy. Their placement, however, could be.
If you’ve ever rage-quit your chart after being wicked out by a fakeout, this one’s for you. Let’s talk about how to master stop losses — without feeling like the market is personally out to get you.
😬 The Necessary Evil: Why Stop Losses Exist
First, let's acknowledge the elephant in the room: stop losses sometimes sting. They're like smoke alarms. Annoying when they chirp over burnt toast, lifesaving when there’s an actual fire.
The purpose of a stop loss isn’t to predict exactly when you’re wrong — it’s to limit how wrong you can be. It's the difference between losing a quick battle and losing the whole war.
Trading without a stop loss is like walking a tightrope without a net — all fine until it’s not.
🤔 The Amateur Mistake: "Where Should I Put My Stop?"
A lot of traders approach stop-loss placement like they're picking lottery numbers: random, emotional, hopeful.
"I’ll just slap it 10 pips below my entry. Seems safe."
But the market doesn’t care about your preferred round numbers. It cares about liquidity, volatility, and structure, regardless if it's the forex market , the crypto space , or the biggest stock gainers out there.
Good stop-loss placement is about logic, not luck. It's about asking:
Where is my trade idea invalidated?
Where does the market prove me wrong?
If you're placing stops based on how much you're "willing to lose" rather than where your setup breaks down, you’re setting yourself up to be triggered — emotionally and financially.
💪 The Art of "Strategic Suffering"
Good stops hurt a little when they’re hit. That’s how you know they were placed properly.
Stops shouldn't be so tight they get hit on routine noise, but they also shouldn't be so far away that you need therapy if it fails. Think of it as strategic suffering: you’re accepting controlled pain now to avoid catastrophic pain later.
Legendary trader Paul Tudor Jones famously said: “The most important rule of trading is to play great defense, not great offense.”
🤓 Where Smart Traders Place Their Stops
Want to know where smart money hides their stops? It's not random. It’s calculated.
Below key swing lows for long trades (how much below depends on the risk-reward ratio they’ve chosen to pursue)
Above key swing highs for shorts (how much above is, again, tied to the risk-reward ratio)
Outside of obvious support/resistance zones (also, risk-reward plays a role)
In other words: start thinking like the market. Where would a big player have to exit because the structure is truly broken? That’s where you want your stop.
👀 Avoiding the Stop-Hunter’s Trap
Is stop-hunting real? Oh yes. And no, it’s not personal. You're just very readable if you park your stops in obvious, lazy places.
The market loves liquidity. Price often pokes below swing lows or above highs because that’s where the money is. Stops create liquidity pockets that big players exploit to enter their trades at better prices.
So how do you avoid becoming easy prey?
Give stops a little breathing room past obvious levels.
Use volatility measures like ATR to set dynamic buffers.
Respect structure, not just random dollar/pip amounts.
A good stop is hidden in plain sight but protected by logic, not hope.
⚖️ Sizing Smarter: Risk per Trade Matters More Than Stop Distance (What’s Risk-Reward Ratio?)
Here’s where many traders mess up: they think tighter stops are always better. Wrong. Your stop distance and your position size are a package deal. If your trade idea requires a wider stop to be valid, your position size should shrink accordingly.
Trying to cram your usual size into a wide stop setup is how small losses turn into account-threatening disasters.
Hedge fund pioneer George Soros once said: “It’s not whether you’re right or wrong that's important, but how much you make when you're right and how much you lose when you're wrong.”
Master your sizing relative to your stop, and you master your survival. In other words, the risk-reward ratio should be playing a key role in placing your stop losses.
🥤 Mental Stops vs Hard Stops: Pick Your Poison
Some traders swear by mental stops: “I'll get out when it hits this level.” Others use hard stops: set-and-forget protective orders baked into the system.
Both have pros and cons:
Mental stops allow flexibility but risk emotional sabotage.
Hard stops guarantee protection but can trigger on sudden, hollow wicks.
Pro tip? Use hard stops if you’re new or undisciplined. You don’t want to be the guy saying “I’ll close it soon...” while watching your unrealized loss grow a second head.
🤯 Stop-Loss Psychology: It’s You, Not the Market
If you find yourself constantly blaming “stop-hunting whales” or “market manipulation” every time you get tagged out... maybe it’s not them. Maybe it's your stop placement.
Discipline in trading isn’t just about clicking buttons at the right time. It’s about planning for the tough times—and sticking to your plan even when it feels bad.
❤️ Final Thought: Love Your Stops (Or at Least Respect Them)
Stop losses aren't your enemy. They're your overprotective friends. Sometimes they’ll throw you out of a trade you "knew" would come back. But more often, they’ll save you from very dangerous outcomes.
Mastering stop losses isn't about never getting stopped out. It’s about getting stopped out properly — with dignity, with minimal damage, and with your account intact.
In trading, pain is inevitable. Wipeouts are optional.
Your move: How do you manage your stops — and have you ever been wicked out so badly you considered quitting trading? Drop your best (or worst) stop-loss stories below.

TradingView Live Show: Charting Volatility with TradeStationJoin us for an insightful TradingView live stream with David Russell, Head of Global Market Strategy, as we dive into the impact of tariffs, market volatility, and key macroeconomic developments shaping today's trading environment.
Oh, and don't forget, TradeStation is sharing ideas here: www.tradingview.com
In today’s session, we’ll break down how escalating tariff tensions and unpredictable global trade policies are fueling market volatility—and how you can navigate these shifts using powerful tools on the TradingView platform.
We’re also unveiling a major update to our broker integration with TradeStation, opening the door to expanded trading opportunities. With this enhanced connection, you can now trade equity options directly on TradingView—an exciting addition to our growing suite of options tools like the strategy builder, chain sheet, and volatility analysis. These features are especially useful in today’s uncertainty-driven markets.
TradeStation, a fintech pioneer since 1982, is known for delivering institutional-grade tools, personalized service, and competitive pricing. They continue to be a trusted partner for both active traders and long-term investors looking to navigate complex markets with confidence.
This session is sponsored by TradeStation, whose mission is to deliver the ultimate online trading experience for self-directed traders and investors in equities, equity index options, futures, and futures options markets. Equities, equity options, and commodity futures services are offered by TradeStation Securities Inc., member NYSE, FINRA, CME, and SIPC.
Important disclosures:
tradestation.com/important-information/
tradestation.com/insights/etf-disclosures/

Unlock Trading Success with Multi-Timeframe MasteryIn trading, particularly in the Forex market, a well-defined strategy is crucial for consistent profitability. One of the most effective techniques used by successful traders is multi-timeframe (MTF) analysis. By examining price action across different timeframes (e.g., daily, 4-hour, 1-hour), traders gain a clearer understanding of market structure, trend direction, and optimal entry/exit points. This article explores how MTF analysis works, its benefits, and practical steps to implement it in your trading.
🔍1. Analyzing a Pair Across Multiple Timeframes for Clearer Trend Direction
The foundation of MTF analysis lies in identifying the major and minor trends. By analyzing at least two timeframes, traders can align their strategies with the broader market direction while fine-tuning entries on shorter timeframes.
⚡The High Wave Cycle (HWC) Approach
To begin, determine your High Wave Cycle (HWC), which depends on your trading strategy and timeframe. For instance:
If you trade on the daily timeframe, your HWC might be the monthly chart.
If you trade on the 1-hour timeframe, your HWC could be the weekly chart.
The HWC helps you identify the major trend. For example, on the daily chart, you might analyze the trend using Dow Theory, pinpoint key support and resistance levels, and identify trendlines or patterns. This gives you a clear picture of the market’s broader direction.
Once the HWC is defined, give it significant weight when analyzing lower timeframes for trade setups. For instance, if the daily chart (HWC) shows a downtrend, you’d prioritize bearish setups on the 1-hour chart, even if a minor uptrend appears.
Example: SOLUSDT Trade Setup
Consider a scenario where the 1-hour chart shows a strong uptrend. The price breaks a key resistance level and a descending trendline, suggesting a potential long position.
However, checking the daily chart..
(HWC) reveals a clear downtrend. According to Dow Theory, a major trend reversal requires a confirmed break above the previous high (e.g., $150). Since this hasn’t occurred, the market remains bearish.
In this case, MTF analysis guides your strategy:
Reduce position size to lower risk, as you’re trading against the major trend.
Take profits early, as the price could reverse at any moment.
Avoid overtrading by limiting the number of positions until the trend change is confirmed.
This approach ensures your trades are aligned with the bigger picture, minimizing losses from false signals.
🎯2. Spotting Entries and Exits by Confirming Trends Across Timeframes
MTF analysis not only enhances risk management but also improves the precision of your entries and exits. By confirming signals across timeframes, you can filter out noise and focus on high-probability trades.
Example: Bitcoin (May 15, 2021)
Let’s rewind to May 15, 2021, during Bitcoin’s post-bull run correction. On the daily chart (HWC), the price formed lower highs and lows, breaking a key support level, signaling a bearish trend and a potential exit for long positions. This indicates that spot traders should sell, and swing traders on lower timeframes should focus exclusively on short positions.
On the 1-hour chart, you might spot a minor pullback, tempting a long trade. However, MTF analysis reminds you to align with the daily downtrend, so you’d only consider short setups. This disciplined approach prevents you from trading against the major trend, improving your win rate.
📊The Medium Wave Cycle (MWC) for Added Clarity
Between the HWC and lower timeframes lies the Medium Wave Cycle (MWC), which provides an intermediate perspective. For example, if your HWC is the daily chart, the MWC might be the 4-hour chart. The MWC helps confirm the major trend’s strength or detect early signs of reversals before zooming into lower timeframes for entries. By checking the MWC, you can filter out noise and ensure your trades align with both the major and intermediate trends.
💡Conclusion
Multi-timeframe analysis is a game-changer for traders seeking consistency and precision. By combining the major trend from your HWC, the intermediate perspective from your MWC, and minor trends on lower timeframes, you can make informed decisions, manage risk effectively, and time your trades with confidence.
Start by defining your HWC and MWC, analyzing the major trend, and aligning your entries and exits with multiple timeframes. Pick a pair, test this strategy on a demo account, and share your results in the comments below! With practice, MTF analysis will give you a tactical edge in navigating the markets.
🤍 btw im Skeptic :) & If you found this article helpful, don’t forget to like, share, and follow for more insights and trading strategies! <3

Can non-agricultural data break the deadlock of shocks!Let's sort out the news that have affected the trend of gold in the past two days:
On Tuesday (April 29), gold suddenly began to fall sharply in the Asian market, and the current gold price is around $3,316. Gold prices weakened during the Asian trading session on Tuesday, replicating the trend of the Asian market on Monday. Amid optimistic market sentiment, the recovery of US dollar demand seems to put downward pressure on gold prices. New optimism about the possible progress in trade negotiations between the United States and its major trading partners supports risk appetite and boosts the performance of the US dollar against major currency competitors. Gold sellers are trying to regain control.
On Monday, US Treasury Secretary Scott Bessent said that several major trading partners have made "very good" suggestions to avoid US tariffs, and India may be one of the first countries to complete the agreement. At the same time, US President Donald Trump softened his stance on China. In addition, there was new news about Trump's tariffs, which triggered a rebound in market risk appetite. At present, the conflict between India and Pakistan has intensified, the geopolitical situation has become tense, and the market's risk aversion has heated up. In addition, this week is a "super week" and US employment data has become the focus. The specific arrangements are: JOLTS job vacancies will be released on Tuesday, ADP employment report will be released on Wednesday, initial jobless claims will be disclosed on Thursday, and the April non-farm employment report will be released on Friday.
Now the gold price has fallen from a high level, reaching a minimum of 3305 for a rebound. If there are traders waiting for the operation ideas during the European trading session, my suggestion is to wait until the rebound near 3329 to intervene in short orders and bearish (aggressive ones can directly enter the short order at 3325 and wait for the rebound to 3329 to increase positions). See if today's low of 3305 will fall below, followed by around 3285. Overall, today's short-term operation ideas for gold are mainly rebound shorting and callback longing. The short-term focus on the upper side is 3329-3339 resistance, and the short-term focus on the lower side is 3300-3290 support.
At the same time, please pay attention to the information and data releases that affect the trend. These will affect the price of gold at the last closing time of this week and the trend of the opening next week!

Gold-Silver Ratio: Silver’s Lag and Historical DivergencesThe gold-silver ratio - the number of silver ounces equals in value to one ounce of gold – has surged recently as gold prices rally while silver underperforms. Gold, a traditional safe-haven, has climbed to record highs amid economic uncertainty, whereas silver, which is partly an industrial commodity, has struggled to break past $35/oz. As a result, the ratio is around 100 – meaning gold is ~100 times the price of silver despite the correction in the ratio from its peak around 125.
For context, the ratio averaged 57 from 1975-2000, and between 2000-2025 the ratio has ranged from 32 and 125 (with the max level reached this month with an average of 68. The ratio has observed extreme spikes in unusual crises).
Today’s elevated ratio highlights the divergence between gold’s sharp rally and silver’s lagging performance. The 25-year mean of the ratio is at 68, suggesting the present levels (100) represent an extreme deviation in favour of gold.
Historical Parallels in Gold-Silver Divergences
Similar wide divergences between gold and silver have occurred in the past. Key historical episodes illustrate how silver eventually played “catch-up” after lagging gold – albeit with varying lag times:
1970s – Silver’s Late Surge: After the U.S. abandoned the gold standard, gold prices soared while silver lagged. However, silver eventually staged a sharp rally later in the decade, quickly closing the gap and driving the gold-silver ratio sharply lower.
1980s – Prolonged Underperformance: Following the 1980 peak, precious metals collapsed, with silver suffering far more than gold. The gold-silver ratio surged and remained elevated through the 1980s and 1990s, as silver failed to catch up and largely moved sideways until the 2000s.
Early 2000s – Post-Recession Catch-Up: After the 2001 recession, gold began a
new bull market while silver initially lagged. Eventually, silver outpaced gold’s gains over the next several years, significantly narrowing the gold-silver ratio.
2008 Financial Crisis – Sharp Divergence and Recovery: The 2008 crisis caused gold to outperform sharply as silver collapsed. However, as the economy recovered, silver staged a dramatic rebound, quickly closing the gap and normalizing the ratio by 2011.
Why Is Silver Lagging Now? Industrial Demand Uncertainty
Roughly half of silver demand is industrial (electronics, photovoltaics, chemicals). Persistent worries about a global manufacturing slowdown and elevated inventories have capped silver’s upside just as investors have chased gold for geopolitical protection.
Source: Silver Institute
Worries about industrial demand have been exacerbated by the recent trade uncertainties which impact industrial sectors in an outsized manner.
By contrast, gold’s appeal as a safe haven has been boosted by geopolitical and inflation fears, driving it to record highs in 2025.
Despite cyclical swings, the underlying secular trend has crept higher for decades. Gold’s monetisation (central-bank reserves, ETF holdings surge) versus silver’s demonetisation, higher real production costs for gold, and silver’s growing industrial elasticity are all factors that represent a risk to normalization of the GSR.
Even a forceful mean-reversion might therefore stall nearer 60–70 than the sub-40 extremes of earlier cycles.
Hypothetical Trade Setups
History shows that once macroeconomic uncertainty clears, silver often recovers lost ground quickly. In previous periods of extreme gold-silver divergence, from the 1970s through 2008, silver staged strong rallies that pushed the gold-silver ratio (GSR) back toward normal levels.
Today, however, silver’s outlook remains clouded by uncertainty, particularly amid the ongoing trade war. Prices risk stalling below resistance around $35/oz. Consequently, the normalization in the GSR may instead result from a correction in gold prices. Gold has consistently broken record highs, and its long-term outlook remains firmly bullish. Nevertheless, concerns about the sustainability of the recent rally are valid - last week, gold fell sharply after setting a new high above $3,500/oz.
In summary, a normalization in the GSR could result from either a silver rally or a gold correction. While each path remains uncertain, a position focused on the ratio itself is relatively insulated from further divergence.
Given this environment, we could express our view in GSR through a long position in silver and a short position in gold. Investors can implement this using CME Micro Silver and Micro Gold futures. This setup benefits from 72% margin offsets. The Micro contracts balance the notional value between both legs by using one contract each.
A hypothetical trade setup consisting of a short position in CME Micro Gold futures expiring in June (MGCM2025) and a short position in CME Micro Silver futures expiring in June (SILM2025), offering a reward to risk ratio of 1.6x, is described below.
MARKET DATA
CME Real-time Market Data helps identify trading set-ups and express market views better. If you have futures in your trading portfolio, you can check out on CME Group data plans available that suit your trading needs tradingview.com/cme .
DISCLAIMER
This case study is for educational purposes only and does not constitute investment recommendations or advice. Nor are they used to promote any specific products, or services.
Trading or investment ideas cited here are for illustration only, as an integral part of a case study to demonstrate the fundamental concepts in risk management or trading under the market scenarios being discussed. Please read the FULL DISCLAIMER the link to which is provided in our profile description.

$SPY Bullish and Bearish TA signals, but leaning BullishShowing multiple time frames with different TA patterns--some harmonizing, while some are conflicting. When I put it all together the sum for me is slightly bullish.

EURUSD -Broke and Retested Right ShoulderEU - Is providing a great entry. Its sitting on a 4 hour ob. price has been sitting for 3 years in a consolidation phase. looks like this year we are looking to be in a bullish phase. price is sitting on a nice solid support. I will be looking to enter a buy today and hold to the next resistance area

Signs of a possible topBoth spy and vix reached a possible ending target today. We'll see what it looks like tomorrow but right now my feeling is either we topped or there will be one more final squeeze to 5600 tomorrow.

WOLF has short squeeze potential.Initially, I was looking at this just as a day trade due to it matching my criteria. These were my notes for pregame trade.
"1. Stock is in play, premarket rvol showing 14.
2. continuation play from yesterday with a gap up; technicals is showing two converging patterns, a cup and handle, and a GAP fill; has CLEAR resistance lines on the way up.
3. price is within my 1.5 - 25$ range
4. No real news catalyst. (usually prefer one)
5. Hot market (semiconductors made in USA)
I say its a B+ set-up given the parameters. Definitely the choice to play at this point of the market day.
P.S. Stock has the HIGHEST short interest / percentage in the semiconductor market. 41% ish of float is shorted. so ANY large up trend can be an AMAZING uptrend."
Then I realized how much 40% short interest actually is with a float of around 150mil, thats a ton of shortage. And more importantly, (or equally) there are TWO gaps in the chart that can be filled. I think these can force liquidate the shorts. This can easily reach $17 in the next two weeks to month.

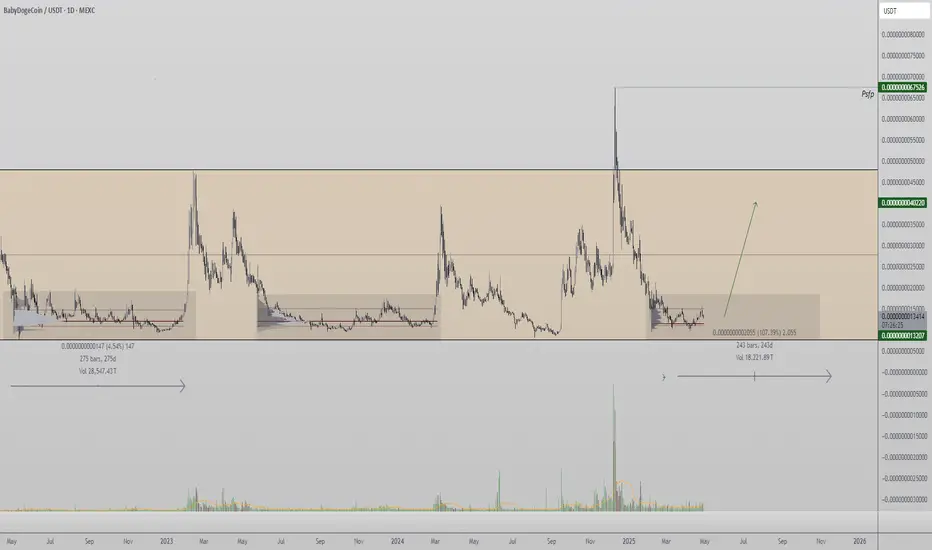
BabyDoge to Pump from range lows? high time-frame trading rangeBaby Doge is once again trading at a historically significant range low—a level that has previously acted as a base for strong bullish expansions. The current setup mirrors past consolidations that lasted over 270 days, each leading to a rapid move toward the range high.
The confluence of extended consolidation time, strong support holding, and low-volume accumulation suggests another potential build-up phase. This gives credence to a bullish bias if the range low continues to hold firm in the coming weeks.
However, the flip side remains clear: a clean breakdown of this level will invalidate the structure and likely trigger a deeper retrace. Given Baby Doge’s status as a high-risk, low-cap coin, position management and risk-to-reward remain key.
In summary, Baby Doge is sitting at a pivotal zone. If accumulation sustains here, history may repeat with another breakout rally toward the highs.
Optimal Position Size May Reduce RisksOptimal Position Size May Reduce Risks
Position sizing in trading is a crucial yet often overlooked aspect of risk management. It's the art of determining how much capital to allocate to each trade, balancing the potential for effective trading with the need to protect your investment. This article delves into the principles of position sizing, offering insights into how traders may optimise their strategies to potentially reduce risk and maximise their trading opportunities.
What Is Position Sizing in Trading?
Position sizing, or trade sizing, is a fundamental concept in trading that determines how much capital is allocated to a specific trade. This process isn't about maximising profits; it's crucial for managing risk. The right position size may minimise the potential loss on each trade relative to the overall capital, potentially ensuring that a single loss doesn't significantly impact the trader's account.
In essence, determining trade sizes is a balancing act. It involves calculating the appropriate amount to invest based on various factors like account size, risk tolerance, and market conditions. This calculated approach contrasts sharply with random or emotional decision-making, where the size of a trade might be based on a hunch or a desire to recoup losses.
The Role of Leverage in Position Sizing
Leverage in trading is comparable to a double-edged sword. It allows traders to control larger positions with a smaller amount of capital, effectively amplifying both potential returns and risks. When a trader employs leverage, they borrow capital, increasing their trading power.
However, when combined with strict position sizing and stop-loss placement, leverage serves a different role. It doesn't necessarily increase the risk but rather reallocates capital more efficiently.
For example, if someone uses leverage to open a position, they're required to commit only a fraction of the trade's total value, known as the margin. If they’re risking 1% of their account balance on a single trade and never move their stop loss, the trader’s loss is limited to this 1%, regardless of how much leverage they use. The only difference is that lower leverage uses more capital for margin and vice versa.
Key Factors Influencing Position Size
When it comes to determining the right position size in trading, two key factors come into play, both crucial for tailoring risk management to individual needs:
- Risk Tolerance: Every person has a unique comfort level with risk. Some might be inclined to use a larger proportion of their account balance on a given trade, accepting higher potential losses for greater potential gains, while others may prefer a more conservative stance, prioritising capital preservation.
- Market Volatility: The level of volatility in the market significantly influences position sizing. In highly volatile markets, where price swings are more pronounced, reducing position size can be a prudent strategy to potentially limit exposure to sudden and severe market movements.
Calculating Optimal Position Sizes
Understanding how to calculate position sizes is a cornerstone of effective trading. The process involves several steps that balance risk management with the potential for returns. Here’s a detailed breakdown:
- Determining Risk Tolerance Per Trade: First, decide what percentage of your trading capital you are willing to risk on a single trade. A common guideline is the 1% rule, meaning if you have $10,000, you will lose no more than $100 per trade.
- Setting a Stop-Loss Order: This is a predetermined point where a losing trade will be closed to prevent further losses. The stop-loss is set based on market analysis and does not exceed the risk tolerance.
- Calculating the Risk per Share/Unit: Subtract the stop-loss level from the entry price. For example, $50 (entry price) in the stock market - $45 (stop-loss) equals a $5 risk per share.
- Determining Position Size: Divide the dollar amount you’re willing to risk by the risk per share/unit. Using the $100 risk on a $10,000 account, divide this by the $5 risk per share: $100/$5 = 20 shares. Thus, you should buy 20 shares to stay within your 1% limit.
As a result, if your stop-loss is triggered, you’d only lose 1% of your total capital.
Position Sizing Strategies
In trading, there are two commonly used position-sizing strategies:
- Fixed Percentage Model: This strategy involves risking a fixed percentage of the total trading capital on each trade. For example, one might consistently risk 2% of their capital per trade. This method automatically adjusts the dollar amount at risk based on the current account size, potentially ensuring that losses are proportionate to the account's value.
- Dollar Amount Risk Model: Here, traders potentially lose a set dollar amount on every trade, regardless of the account size. For instance, a trader may decide to risk $500 on each trade. This model is simpler and easier to manage, especially for traders with less experience, but doesn't adjust for changes in the total account value, which could be a drawback as the account grows or shrinks.
The Impact of Position Sizing on Trading Performance
Optimal position sizing is risk-reducing and plays a critical role in a trader's overall performance. By allocating the right amount of capital to each trade, they potentially can manage potential losses more effectively, preserving their trading capital over the long term. This approach is believed to help traders be sure that a series of losing trades does not significantly deplete the account, allowing them to remain in the market.
Moreover, optimal position sizing may contribute to emotional stability. Traders are less likely to experience extreme stress or make impulsive decisions when they know their risk is controlled and losses are within acceptable limits. This psychological benefit cannot be overstated, as a calm and focused mindset is essential for making rational trading decisions.
The Bottom Line
In essence, mastering position sizing is key to balancing potential gains with prudent risk management. Remember, optimal position sizing is about protecting your capital while maximising opportunities and is a valuable tool in long-term, sustainable trading.
This article represents the opinion of the Companies operating under the FXOpen brand only. It is not to be construed as an offer, solicitation, or recommendation with respect to products and services provided by the Companies operating under the FXOpen brand, nor is it to be considered financial advice.

Silver’s Bullish Transition: $50 and BeyondSilver OANDA:XAGUSD FX:XAGUSD TVC:SILVER COMEX:SI1! has completed a multi-decade accumulation phase and is now entering a global bullish supercycle, capable of reshaping the balance of power in the precious metals market. Below is the current view across timeframes, structures, and macro drivers.
🔭 Global Perspective
Since the early 1980s, silver has been moving within a broad corrective structure, with two major corrections: from 1980 to 1995 and from 2011 to 2020.
Now there is strong evidence that a transition phase — wave (III) — has begun, which could potentially break historic highs and push prices toward $100+.
Upon reaching the $50 mark, the chart would complete a classic institutional "cup with handle" pattern, similar to gold, potentially triggering an exponential rally.
⏱ Mid-Term View
Since August 2022, silver has been developing an impulsive structure.
The deep correction we observed in April 2025 likely represents wave C of a flat correction, completing wave (4) of the current impulse.
Currently, silver is building wave (5). Within it, the first subwave (i) has either been completed or is still forming.
In the coming weeks or month, a local pullback is possible, followed by a continuation of the bullish rally, with a medium-term target in the $42–50 range.
🌐 Macro and Fundamental Drivers of Growth:
📈 Inflation and declining real interest rates — Silver, like gold, acts as an inflation hedge, especially during periods of monetary easing.
💵 Weakening U.S. Dollar — A falling DXY and potential QE strengthen demand for silver.
⚙️ Growing industrial demand — Silver is essential for solar panels, electronics, electric vehicles, and the medical sector.
🌍 Green energy transition — Silver is a critical material for photovoltaic technologies and the expansion of renewable energy.
📉 Structural supply deficit — Declining mining investment and ore grades are forming a long-term supply shortage.
🏦 Increasing institutional interest — ETFs, hedge funds, and banks are expanding their exposure to silver, boosting liquidity and long-term price support.
⚠️ Geopolitical risks — Metals act as a safe-haven amid rising global instability and de-dollarization trends.
📌
The supercycle is intact — we are likely within wave (III).
Short-term corrections are possible, but the overall structure remains bullish.
Medium-term target — $42–50.
The full cycle may take years, but the directional bias is clear.
Fundamental factors strongly support the technical outlook, pointing to significant long-term upside.

ASX 200 Stalls at Resistance, Pullback Pending?Here is my 2-minute take on the ASX 200 futures daily chart, where I discuss my hunch that a pullback could be due and how that could set us up for a better long setup further out.
Matt Simpson, Market Analyst and Forex.com and City Index

The Gold-Silver Ratio ExplainedCOMEX: Micro Gold Futures ( COMEX_MINI:MGC1! ), Micro Silver Futures ( COMEX_MINI:SIL1! )
The Gold-Silver Ratio is a financial term that measures the relative value of gold to silver. Specifically, how many ounces of silver it takes to buy one ounce of gold.
The Gold-Silver Ratio is an important tool for traders and investors. It has been used to indicate the market sentiment towards these two precious metals. A high ratio suggests that gold is more valued than silver, often seen during economic turmoil or when investors seek safe-haven assets. On the contrary, a lower ratio implies that silver is gaining value relative to gold, which normally occurs during periods of economic growth and strong industrial demand.
The ratio fluctuates over time due to supply and demand dynamics, geopolitical events, and changes in the global economy. By analyzing the ratio, traders can make informed decisions about when to buy or sell. This ratio reflects not only the market’s valuation of these metals but also an instrument for profit-making in the commodities market.
Historical Gold to Silver Ratio
Since 2000, the Gold-Silver Ratio has seen considerable fluctuations, reflecting various economic and market conditions. In the first decade of the 21st century, the ratio hovered around 65:1, meaning it took 65 ounces of silver to buy one ounce of gold.
However, the ratio has spiked during times of economic uncertainty. For example, during the financial crisis of 2008, the ratio reached highs not seen in decades. More recently, in the wake of the COVID-19 pandemic and the ensuing economic turmoil, the ratio surged, at one point exceeding 110:1 in 2020, indicating a strong preference for gold as a safe-haven asset compared to silver.
Over time, the Gold-Silver Ratio has been trending up, meaning gold has gained value at a faster pace compared to silver.
As of last Friday, gold is trading around all-time high at $3,330, while silver is quoted at $33.0. This makes the Gold-Silver Ratio almost exactly at 100.
When to Buy and Sell based on the Gold-Silver Ratio?
The decision to buy or sell the ratio hinges on interpreting its current value in the context of historical trends and market conditions.
When to Buy Silver: A high Gold-Silver Ratio, typically at or above the 90:1 mark, suggests that silver is undervalued relative to gold. This is often interpreted as a buying signal for silver. In such scenarios, silver is cheaper than gold, and investors may see it as an opportunity to purchase silver at a relatively low price. The rationale is that if the ratio decreases, the relative value of silver will increase compared to gold, potentially leading to significant gains.
When to Sell Silver/Buy Gold: Conversely, when the Gold-Silver Ratio is low, say around 50:1, it indicates that silver is relatively expensive, or gold is undervalued. In such situations, investors might consider selling silver and buying gold. The expectation is that the ratio will normalize or increase, meaning that gold’s value could rise relative to silver, offering a favorable return on the gold investment.
The Gold-Silver Ratio can be a valuable indicator of when to buy or sell gold and silver. However, since the ratio is not stable but upward trending over time, we could not use a mean-reversion strategy. The price band for normal, high and low ranges should be updated regularly.
Trade Setup with Micro Gold and Silver
Traders could deploy the Gold-Silver Ratio trading strategy using COMEX Micro Gold Futures ( AMEX:MGC ) and Micro Silver Futures ( AMEX:SIL ). The big advantages of using futures contracts are capital efficiency and leverage.
MGC contracts have a notional value of 10 troy ounces of gold. With Friday settlement price of $3,330.7, each June contract (MGCM5) has a notional value of $33,307. Buying or selling one contract requires an initial margin of $1,500 at the time of writing.
By putting a deposit equivalent to less than 0.5 ounce, traders could gain the full exposure to 10 ounces of gold. If gold prices move up by 5%, a long futures position would double in value (= (33307*0.05) / 1500 = 111%). This futures contract has a built-in leverage of 22:1.
Conversely, Micro Silver (SIL) contracts have a notional value of 1,000 troy ounces of silver. With Friday settlement price of $33.02, each June contract (SILM5) has a notional value of $33,020. Buying or selling one contract requires an initial margin of $3,000 at the time of writing.
By putting a deposit equivalent to 91 ounces, traders could gain the full exposure of 1,000 ounces of silver. If silver prices move up by 5%, a long position in Micro Silver futures would gain 55% (= (33020*0.05) / 3000). This futures contract has a built-in leverage of 11:1.
Micro gold futures (MGC, 10 oz) contracts tap into the deep liquidity of standard-size gold futures contracts (GC, 100 oz). As of last Friday, GC has an open interest (OI) of 447,356 contracts, while the OI for MGC is 44,449, according to data from CME Group.
The OI for standard Silver Futures (SI, 5000 oz) and Micro Silver Futures (SIL, 1000 oz) are 154,276 and 12,345, respectively.
Happy Trading.
Disclaimers
*Trade ideas cited above are for illustration only, as an integral part of a case study to demonstrate the fundamental concepts in risk management under the market scenarios being discussed. They shall not be construed as investment recommendations or advice. Nor are they used to promote any specific products, or services.
CME Real-time Market Data help identify trading set-ups and express my market views. If you have futures in your trading portfolio, you can check out on CME Group data plans available that suit your trading needs www.tradingview.com

To the Moon: Space Isn't Just for Billionaires. It's for You TooTo your parents, getting involved in space meant joining NASA, becoming an astronaut, or — more realistically — building a scale model of the Saturn V and telling them you wanted to be "just like Neil Armstrong."
Today? You don’t need a PhD, perfect vision, or the ability to survive on dehydrated ice cream. The economics of orbit is accessible from your screen through the shares of publicly listed companies.
While billionaires are busy trying to out-flex each other in orbit, there’s a rapidly growing group of public companies that you can use as a launchpad to space exposure.
Let's explore (pun intended) how space is no longer science fiction only — it's an economic sector you can trade.
🚀 SpaceX: The Giant with a Gravitational Field
First, let’s get this out of the way: SpaceX is still private. Elon Musk’s rocket-powered unicorn dominates the headlines — and deservedly so. The company is launching Starlink satellites by the hundreds, winning NASA contracts, and discussing building cities on Mars where we can move and grow space potatoes.
But unless you have deep VC connections or you run a private equity fund, you can’t buy SpaceX stock yet. (Cue the tiny violin.) According to private-market estimates, SpaceX boasts a valuation of $350 billion, making it the world’s most expensive private company.
What you can do is invest in companies that supply, compete with, or benefit from the SpaceX era. Here are a few ideas.
🛸 Rocket Lab NASDAQ:RKLB : The Mini-SpaceX
If SpaceX is the Goliath of orbital launches, Rocket Lab is the David — except instead of a slingshot, it's using the Electron rocket and prepping the bigger Neutron.
Rocket Lab specializes in small satellite launches — think communications, Earth observation, climate monitoring. The company is cheaper, faster, and more frequent than the heavy-lifters like Falcon 9 by SpaceX. If you’re bullish on the boom in low-Earth orbit activity, Rocket Lab could be the small-cap rocket you can strap your portfolio to.
Bonus points — it’s not just a launch company. Rocket Lab, valued at around $10 billion, is expanding into satellite manufacturing, in-orbit services, and deep space missions.
👽 Intuitive Machines NASDAQ:LUNR : Houston, We Have a Moonshot
With a ticker symbol NASDAQ:LUNR — obviously leaning into the Moon theme — Intuitive is all about lunar landers and space infrastructure. The company is part of NASA’s Commercial Lunar Payload Services (CLPS) program, helping deliver payloads (science experiments, rovers, tech gizmos) to the Moon.
In the absence of crypto moons, these guys are aiming for the real thing.
But be warned: Intuitive is a true moonshot investment. As recently as March, the company's moon lander, Athena, couldn't pull off a stellar touchdown and its shares nosedived roughly 60%. Year to date, the stock is down 55%.
The startup is pioneering in a market that doesn’t quite exist yet at scale. Revenues are coming in phases, tied to contracts, with success as lumpy as a Moon crater. In a nutshell? It's a high-risk, high-reward kind of ride.
Still — if you're looking for an early, pure-play exposure to the Moon economy, Intuitive Machines, valued at just $1.5 billion, is basically as close as you can get.
🌟 Northrop Grumman NYSE:NOC : The Silent Space Titan
While Rocket Lab and Intuitive Machines get the Reddit buzz, Northrop Grumman keeps a low profile, winning contracts and building stuff that actually gets yeeted into space.
The company is deeply involved in NASA’s Artemis program, manufacturing boosters for the Space Launch System (SLS) — the rocket that’s supposed to return humans to the Moon. It also makes satellite systems, missile defense tech, and stealthy aerospace goodies for the US government.
Northrop isn’t going to quadruple overnight on a meme rally — it’s worth just under $70 billion. But it provides serious, steady exposure to the high-stakes space game — with dividends. It’s the choice for traders who like their moonshots with a side of mature risk management.
✨ Lockheed Martin NYSE:LMT : Space Cowboys in Business Suits
Lockheed Martin isn’t just the F-35 fighter jet company. It also builds the Orion spacecraft — NASA’s chosen ride for deep space missions, including Mars (if Elon doesn’t get there first).
Lockheed’s space division covers everything from weather satellites to missile warning systems. The company, worth around $111 billion, has been in the space race before Jeff Bezos came up with Blue Origin and way before Musk founded SpaceX.
Think of Lockheed like the expert-level astronaut: calm, collected, and still racking up mission hours while everyone else is learning which button not to press.
💫 Boeing NYSE:BA : Sometimes Up, Sometimes… Not So Much
Boeing’s Starliner capsule is supposed to ferry astronauts to the International Space Station. Supposed to. It’s been delayed more times than your average budget airline flight.
The astronauts that were stuck in space for nine months? Riding a Starliner that failed during docking (the mission was supposed to be a ten-day roundtrip). So Musk’s SpaceX had to intervene and bring those two space explorers back to earth in March.
Still, despite technical hiccups and PR headaches, Boeing remains heavily involved in the space economy. It builds rockets, satellites, and space station modules. Even when it trips, it trips forward — thanks to government contracts and industrial clout.
If you can stomach some turbulence, Boeing, worth $134 billion, offers another angle on the space trade.
🌙 RTX NYSE:RTX : Watching the Skies
You may not think "space" when you hear RTX (formerly Raytheon), but you should. The company builds sensors, satellites, and missile tracking systems — vital components of the US space and defense apparatus.
Space isn’t just about launching astronauts and rovers; it's about surveillance, communications, and security. RTX, valued at a whopping $168 billion, plays behind the scenes, helping make space a battlefield for signals, not soldiers.
Steady, profitable, and sneakily important, RTX is the stealth bomber of space stocks.
🪐 Other Orbit-Worthy Notables
Outside of the headliners, there’s a growing constellation of companies playing critical roles in space commerce:
Redwire NYSE:RDW : In-space manufacturing and tech solutions.
Blacksky Technology NYSE:BKSY : Real-time satellite imagery and analytics.
Virgin Galactic NYSE:SPCE : Richard Branson’s waning dream of space tourism, working to make suborbital flights a regular experience (careful, though, the stock is down 99.9% from peak).
☄️ Your Portfolio Doesn't Have to Stay on Earth
Space is no longer just a billionaire’s playground or a sci-fi dream. It's an investable theme — one that covers exploration, infrastructure, defense, data, and connectivity.
Sure, the sector is volatile. There will be delays, explosions (hopefully unmanned), stock swings, and moments where it all seems like an expensive science experiment. But there’s also real innovation, massive contracts, and a trillion-dollar economy forming right above our heads.
The thing is, while the biggest names in tech make the headlines and get daily coverage , you won’t see those space companies featured on the front page of big financial journals or covered in the weekly take of your financial podcast.
Traders who are serious about catching the big moves before they blast off should keep one tool close: the earnings calendar . These companies’ quarterly reports highlight progress, revenue, profit or loss figures, and present forward-looking guidance to act as a compass to traders and investors.
The economics of space isn’t just exciting because it’s shiny and futuristic — it’s exciting because the groundwork is being laid quietly, deal by deal, launch by launch. And the traders who are paying attention before the crowd shows up? They’re the ones best positioned for lift-off.
Your turn : Are you already investing in the space economy? Did we miss any names in there? Tell us — what’s your favorite way to reach for the stars? ✨🚀🌔

Russia-Ukraine Peace Agreement what could it mean to forex!A peace agreement between Russia and Ukraine could send ripples through the Forex and Commodities markets. Here's how major assets might react:
📊 Key Market Shifts to Watch:
✅ Risk-On Sentiment Returns
Traders may rotate out of safe havens like USD, JPY, CHF, and Gold.
Risk currencies like AUD, NZD, and emerging market currencies could strengthen.
✅ Euro Strength Likely (EUR ↑)
Europe gains the most relief → energy prices fall, inflation cools, confidence grows.
✅ Oil & Energy Prices May Drop
Peace reduces supply fears → crude oil and gas prices could fall → impacting CAD, NOK, RUB.
🔀 Likely Forex Movements:
🔼 Pairs Likely to Rise 💡 Reason
EUR/USD Euro up on peace; USD weakens as fear fades.
AUD/JPY Aussie rises on risk appetite; Yen weakens.
EUR/JPY Similar to AUD/JPY—EUR gains, JPY loses.
NZD/JPY Risk-on favors NZD; JPY drops.
EUR/CHF Swiss Franc weakens; Euro benefits.
USD/ZAR (falls) Rand strengthens on global optimism.
🔽 Pairs Likely to Fall 💡 Reason
USD/JPY USD and JPY both weaken, but USD may drop more.
USD/CHF Same story—less demand for safe havens.
USD/RUB Ruble recovery if sanctions ease.
CAD/JPY Oil-sensitive CAD may dip slightly
🟡 What About Commodities Like Gold? (XAU/USD)
⬇️ Gold Likely to Fall
As a traditional safe-haven, Gold (XAU/USD) tends to rise during geopolitical turmoil.
Peace = lower fear = investors rotate out of Gold into riskier, yield-bearing assets.
Lower inflation expectations could also reduce demand for Gold as an inflation hedge.
🧠 Key Level Watch:
If peace is confirmed, XAU/USD could drop below key support zones, especially if USD strengthens slightly on rate differentials.
🔍 Final Thoughts:
The magnitude of these moves depends on the terms and credibility of the peace deal.
If it includes sanctions relief and long-term commitments, expect larger market reactions.
Stay alert for central bank policy shifts, especially if inflation drops.
💬 What pairs or commodities are you watching if peace becomes a reality? Drop your insights below!
📌 Follow me for more macro-FX breakdowns, commodities analysis, and trading insights.

Will History Repeat Itself? $580 Target For SPY By Early MayThe market has been in the doldrums since finding support after a nasty wave of selling that caused AMEX:SPY to decline by an additional 15% in a matter of days. Since we’ve been chopping around in this $65 range, we have seen some sharp swings both ways, but little sense of direction. i think that is about to change soon. Using the time around the Death Cross (When the daily 50MA crosses below the 200MA) of 2022 as a frame of reference, and taking recent PA into account using Elliott Wave, I think it is clear a bear market rally is already underway.
Starting with 2022, the price fell in three distinct waves before making a significant retracement. The day after the 50MA crossed below the 200MA, the price found a temporary bottom before chopping around for 13 sessions. Volume was on a steady decline before the price made a higher low and retraced nearly 75% of Wave (A) over the course of another 13 sessions (13 is a fibonacci number btw). The price briefly spiked above all of the moving averages (50/100/200) before getting sold off again in the strongest wave of the bear market of that year.
Now looking at the daily chart for this year, the setup is a little bit different but there are still similarities. For starters, the 50MA crossed below the 200MA a few days after the market found a temporary bottom at $482. What I’m counting as Wave A of (B) lasted for five sessions (another Fibonacci number). Wave B of (B) was actually four sessions but I decided to compare the volume of both movements using the same chunk of time. As you can see, there was nearly double the volume in Wave A vs Wave B, signaling that bulls are in control (for now). Volume in Wave A was comparatively higher on average than the entire downtrend, which is also worthy of note.
Since we are now in Wave C of (B) and the 100MA is converging with the 200MA, we should see the squeeze here. A similar retracement to complete Wave (B), when comparing to 2022, would suggest AMEX:SPY will spike above $580 rather quickly before the next sell off. If Wave C were to unfold in a more conservative eight sessions (the next biggest fib number) we should see Wave (B) end around Thursday May 1st. It could take a little bit longer since the next FOMC is May 6-7, which could be an event that will cause the market to change directions.
Lastly, for a closer look, this is how I am counting the sub-waves on the 500R ($5) chart. Wave B was a classic Regular Flat pattern that saw wave (c) find support slightly past 100% of wave (a) at roughly $509. The price quickly found support (much faster than I would have expected) without filling the gap and ripped higher. We’ve also seen the price hover around monthly VWAP for a while, which indicates somewhat of an agreement on price despite the wild swings.
The price gapped up over 2% on Wednesday before seeing some selling in the afternoon. We could either close this gap on Thursday or continue higher to close the upper gap at $560 and beyond. Volume increased from wave (b)-(c), and has remained higher - which I think is accumulation. Using intraday ratios, Wave C of (B) could extend as high as the 1.618 extension at $587.
Actually, one last thing. TVC:VIX price action also supports my thesis. Even through the PA on AMEX:SPY was relatively neutral on Wednesday after the gap up, VIX still importantly dropped below support and is now below the 0.618 retracement. I think it will return to the 200MA for support, which usually hovers around $20. Fib circles added just because they’re kind of interesting to me when analyzing VIX.
If you’ve made it this far, thank you for reading and good luck. As always - use your best judgement and be ready to react to anything that happens in the market.

Is Meta The Most Undervalued Stock In The Magnificent 7?In a recent post on key investment trends for the next decade, we highlighted the addictiveness and pervasiveness of social media as a critical long-term shift. Today, we're buying Meta Platforms NASDAQ:META which we believe represents an exceptional investment opportunity.
The Financials
META's recent financial performance has been stellar. The company has maintained 20%+ year-over-year revenue growth for most of the last two years – impressive for a business generating nearly $50 billion quarterly. Even more compelling is bottom-line growth, with net income increasing approximately 50% year-over-year.
This growth is underpinned by META's robust margin profile, which has strengthened considerably since 2022. We attribute this performance to the company's powerful network effects across Facebook, Instagram, WhatsApp, and Messenger – platforms that effectively capture user attention and provide advertisers with compelling ROI.
The Valuation
What makes META particularly attractive right NOW is the valuation. We consider it the most competitively priced among the Magnificent 7 stocks. With the exception of Google, META offers the most favorable metrics on P/E, EV/EBITDA, and P/S ratios. When factoring in growth expectations, META's PEG ratio actually comes in below Google's.
Historically, META is trading at or below its long-term average multiples – with its P/E ratio currently in the lower standard deviation band.
Overall, we believe META's combination of robust growth, significant margins, and attractive multiple make it the most undervalued Magnificent 7 stock. In a choppy market, we rate the stock a "Strong Buy".

Bitcoin Cycle Update – Are We Nearing the Peak?Check out this BTCUSDT chart – we’re at GETTEX:92K today, and seems like things are heating up!
▸We’ve seen a Cycle Bottom in late 2022 - early 2023, followed by strong Bull runs in 2023 and 2024.
▸Those Consolidation phases (sideways channels) gave us the perfect setup for massive pumps!
▸Right now, we’re in a Pause Triangle after a big rally – but the Cycle Top could be just around the corner in mid-2025.
▸After that? A potential Bear phase – time to plan your moves!
💡 What’s your strategy? Are you riding this wave to the top, or preparing for the next dip? Let’s discuss 📨
