SPX, NDX, IWM Short: Expects 3rd Wave down, Trendline BreakThis idea is recorded during the Asian hours. But it is really just an update to previous calls for a down move in the equities. I touched briefly on the wave counts and discussed on the setting of stops and price targets.
Elliott Wave

FBMKLCI should be back to Wave 1fbmklci already went down, creating quite similar condition like the starting of covid and also april-may 2023

GOLD → Recovery after the FB of 0.5 fibo. What's next?FX:XAUUSD on Thursday tests 0.5 fibo, which I outlined to you on April 17, forms a false breakdown and recovers amid unstable geopolitical relations in the world. Price may continue its northward run.
The dollar continues to fall. The fundamental background depends on the relationship between the US and China as well as economic data especially after Powell's speech. The weekly session closes close to support, the decline may continue.
Gold after the shakeout is heading back north. Based on the fundamental background, the price may continue to rise. There are three days of downtime ahead as traders rest.
Fundamentally, anything can happen over the weekend, however, technically, the emphasis is on intermediate levels. The trend is still strong and bullish
Resistance levels: 3332, 3344, 3357
Support levels: 3313, 3288, 3284
If nothing supernatural happens over the weekend, gold in the Asian session may bounce off the nearest resistance and test trend support before continuing the uptrend. If there are any critical changes in the mood of countries/politicians then I will update the situation
Regards R. Linda!

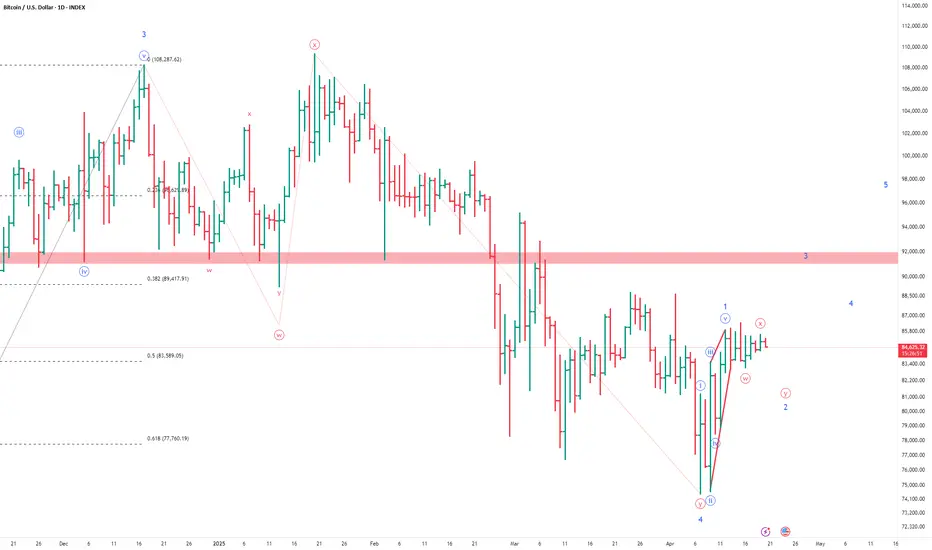
Bitcoin short Elliott waves counts update Nothing much to say over here as I've already given analysis previously for Bitcoin. Just wave counts update.

Wave Outlook Correction on GBP/USDFX:GBPUSD The wave outlook for GBP/USD suggests a continued upward movement. A further increase is anticipated to complete the fifth wave.

XAUUSD Volatility in Focus: Caution Advised for PullbackCurrently, I estimate that XAUUSD is nearing the end of wave iii of wave (v). I present two potential scenarios:
In the black label scenario, XAUUSD may continue its upward movement to complete wave iii, with a projected target in the 3,372–3,410 range.
However, under the red label scenario, there is a possibility of a short-term correction toward the 3,284–3,301 area before resuming the uptrend toward the same target zone.
Traders should closely monitor price action, as increased volatility is likely in the near term.

Wave Analysis: Potential Correction Before Further Upside MovemeFX:EURUSD The price continues its upward movement, and we might witness a correction soon towards the fourth wave. After that, the ascent is likely to resume, reaching the fifth wave.

JPYIDR Continues Its Uptrend: Strength Momentum Remains IntactI estimate that JPYIDR is currently in its uptrend phase, forming part of wave (iii) of wave . This indicates that JPYIDR still has room to strengthen, with the nearest upside target projected in the 122–128 range.

ZRO: Altcoin hero?If you find this information inspiring/helpful, please consider a boost and follow! Any questions or comments, please leave a comment!
ZRO is worth keeping on the radar. Out of most altcoins it arguably has the cleanest setup for a potential bullish reversal—at least structurally.
While it could be done here, I’m leaning on the idea that the Y wave still needs one more leg down. That’s typically the behavior we see: Y waves tend to be slower and more drawn out compared to the W wave. If that holds true again, the ideal target zone falls between $2.12 and $1.88. That would allow for a proper test of structure while staying within the bounds of the larger corrective patterns most likely target.
This is still a bullish interpretation—but only after one more low and a meaningful reaction from it.
That said, both the bull and bear counts are pointing down in the near-term. My personal invalidation sits above the (c) wave high. If ZRO clears that, this setup likely needs to be re-evaluated. Until then, any move beyond the orthodox end of wave A of the Y leg should be considered “enough” from a pattern swing perspective.
Patience here could pay off—especially if price enters the key zone and shows strength.
Trade safe, trade smart, trade clarity.

SILVER – Wave 3 Breakdown Using Elliott Wave Theory3-Day Silver Chart Analysis
We're analyzing the full structure of Wave 3, which itself consists of 5 smaller waves, following the Elliott Wave impulsive pattern:
Impulse Wave Structure (5 Waves):
Wave 1: 5 subwaves (either impulse or leading diagonal)
Wave 2: 3-wave correction
Wave 3: 5 subwaves (impulse)
Wave 4: 3-wave correction
Wave 5: 5 subwaves (can be impulsive or corrective)
Right now, we’re in Wave 5 of Wave 3, and within that, we’re in subwave 1, expecting a subwave 2 correction next.
Trade Plan:
- Watch for the subwave 2 correction to develop
- Once wave C of the correction forms, draw a trendline and enter on the breakout
- Set hard stops below the invalidation level, or under Wave 2 after the breakout
- Take profit levels: 35, 37, 39
Good luck and as always, trade safe!
Take a look at our earlier Silver setups below:
Free Setups
SILVER:
SILVER:
SILVER:
VIP Setups
SILVER:
SILVER:
SILVER:
SILVER:

Natural gas bullish?With elliot wave and possible time-cycle, there is a strong possibility of a strong upmove as long as price convincingly stays above current lows.

I started this analyses Aug 2022. Now I think HEY can grow to 60After the price breaks € 40, the way is open to grow to € 60.
Ofcourse, with ups and downs in between. Never a straight line.
I strarted my analyses August 2022 and since then, I had almost every movement right.
I advise to work with options on this beside stocks.

Could this be beginning of 5th wave up in Bitcoin?Being cautiously optimistic - I can see a potential leading diagonal formation followed by 3-3 legs which could be legs w-x of w-x-y or w-x-y-x-z .
Only time will tell if this is what I think it is o it evolves into another corrective rise followed by further downside.
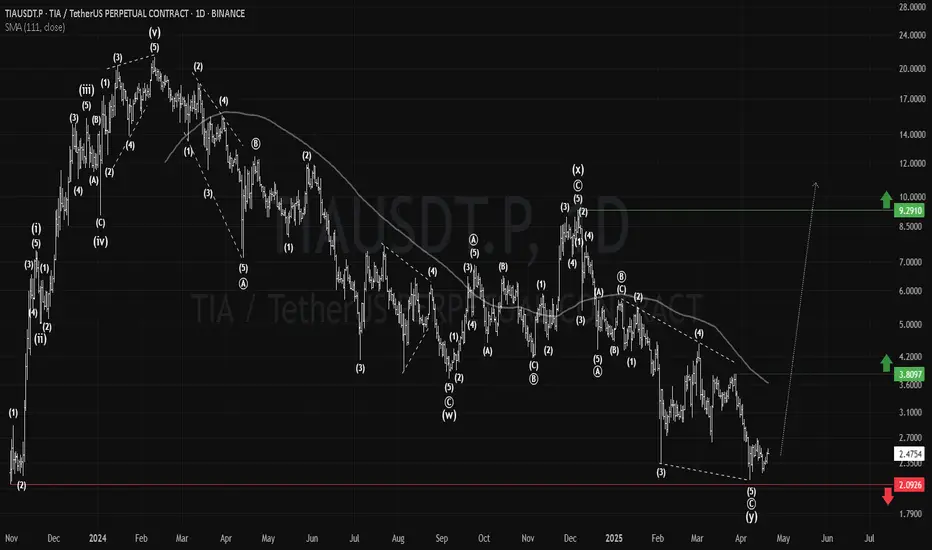
TIA: Crazy Risk to Reward Ratio#Tia faced steep losses since Dec 2024, underperforming similar coins.
Now near its ATL, it presents a high risk-to-reward setup.
Below $2.10 is the stop-loss, while passing above $3.80 signals a bullish reversal in trend with higher targets ahead.
#Celestia
SOLUSDT | 1 DAY | SWING TRADING Hey friends!
I’ve put together a detailed analysis on Solana just for you. The harmonic pattern has completed, and we’ve already seen some strong buying from that exact zone. 📈
Now, I’ve got two targets for you:
🎯 Target 1: 170.00
🎯 Target 2: 219.00
🔴 STOP: 75,81
"Just a heads-up — since this is a swing trade, the target might take some time to hit. Good to keep that in mind."
Remember, the more love and likes I get from you, the more motivated I am to keep sharing these analyses. All I ask is for a simple like to show your support. 💙
Huge thanks to everyone supporting with their likes — I truly appreciate it!

CFX: The Complicated SituationLSE:CFX
#CFX has shown complex price action since March 2023, with its correction repeatedly extending.
As the broader market nears a potential reversal, CFX now has a chance to rise in a motive wave, possibly targeting levels above its March 2024 top.
#Conflux

ZRO: New Challenge@LayerZero_Fndn is a new coin backed by major hedge funds. It made a strong rebound last month and is now in a corrective wave.
Key levels: $1.48 is the stop-loss, while passing $3.16 is a bullish indication.
#LayerZero

Threshold Network(T) Analysis: From Bear Trap to Bullish TrendAs long as Bitcoin ( BINANCE:BTCUSDT ) and Ethereum ( BINANCE:ETHUSDT ) are in a range, it is a good opportunity to take advantage of the movement of other tokens and take a look at their charts.
Today, I want to analyze the Threshold( BINANCE:TUSDT ) project for you, which has increased by +70% .
What Is the Threshold Network?
Threshold Network is a decentralized protocol that combines cryptography and privacy to power secure, permissionless applications. It enables users to protect their digital assets through threshold cryptography—where no single party has full control—supporting use cases like private key custody, privacy-preserving smart contracts, and tokenized Bitcoin on Ethereum (via tBTC).
Reasons for Price Increase:
Token Buybacks : Threshold Network is actively buying back T tokens from the market, potentially increasing demand and positively impacting the token's price.
Halting Treasury Sales : The project has stopped selling T tokens from its treasury, signaling confidence in the token's future value and reducing potential market supply.
BitcoinWorld
Reducing Operational Expenses : By streamlining operations to save costs, the project aims for long-term sustainability in the volatile crypto landscape.
-----------------------------------------------------
Technical Analysis:
Now let's take a look at the Threshold(T) chart on the Daily timeframe .
Can we still take advantage of the increase in the price of T Token or not!? Please Stay with me.
The Threshold(T) project is moving near the Heavy Support zone($0.0189-$0.0147) and has managed to break the Resistance lines with a high-volume candle , which could be good news for the continuation of the T token's bullish trend .
The Threshold(T) Project also created a Bear Trap , which basically moves in the opposite direction of the Trap after traps on the price chart with high momentum , which is what happened here as well.
In terms of Elliott Wave theory , the T token is currently completing 5 impulsive waves after completing a Zigzag Correction(ABC/5-3-5) , which seems like we should wait for the main wave 4 and then a re-increase .
I expect the T token to start rising again from the Potential Reversal Zone(PRZ) and give us at least +30% profit opportunity .
Note: If the T token goes below $0.016, we should expect further decline and possibly a break of the Heavy Support zone($0.0189-$0.0147).
Please respect each other's ideas and express them politely if you agree or disagree.
Threshold Analyze (TUSDT), Daily time frame.
Be sure to follow the updated ideas.
Do not forget to put a Stop loss for your positions (For every position you want to open).
Please follow your strategy and updates; this is just my Idea, and I will gladly see your ideas in this post.
Please do not forget the ✅' like '✅ button 🙏😊 & Share it with your friends; thanks, and Trade safe.

Still no progress for BitcoinHi traders,
Last week Bitcoin consolidated the whole week. The outlook is still the same.
Now we saw a 5 wave pattern up (which could be a leading diagonal wave 1) and a correction down. So we could see the next impulse wave after the finish of the correction.
Or we see one more impulse wave down and after that more upside.
Let's see what the market does and react.
Trade idea: Wait for the (corrective) move down to finish. After that you could trade longs.
If you want to learn more about trading FVG's with wave analysis, please make sure to follow me.
This shared post is only my point of view on what could be the next move in this pair based on my analysis.
Don't be emotional, just trade your plan!
Eduwave

Little more up for goldHi traders,
This is what I've said last week in my outlook: next week we could see a correction and more upside for this pair.
And I drew an arrow for the target. Now check the chart.
This is the power of wave analysis in combination with liquidity sweeps and FVG's!
For next week we could see a little more upside (finish grey wave 3) and after that a bigger correction for (grey) wave 4.
Let's see what price does and react.
Trade idea: Wait for a change in orderflow to bullish. After an impulse wave and a small correction down on a lower time frame you could trade (short term) longs.
If you want to learn more about trading FVG's & liquidity sweeps with wave analysis, please make sure to follow me.
This shared post is only my point of view on what could be the next move in this pair based on my technical analysis.
Don't be emotional, just trade your plan!
Eduwave

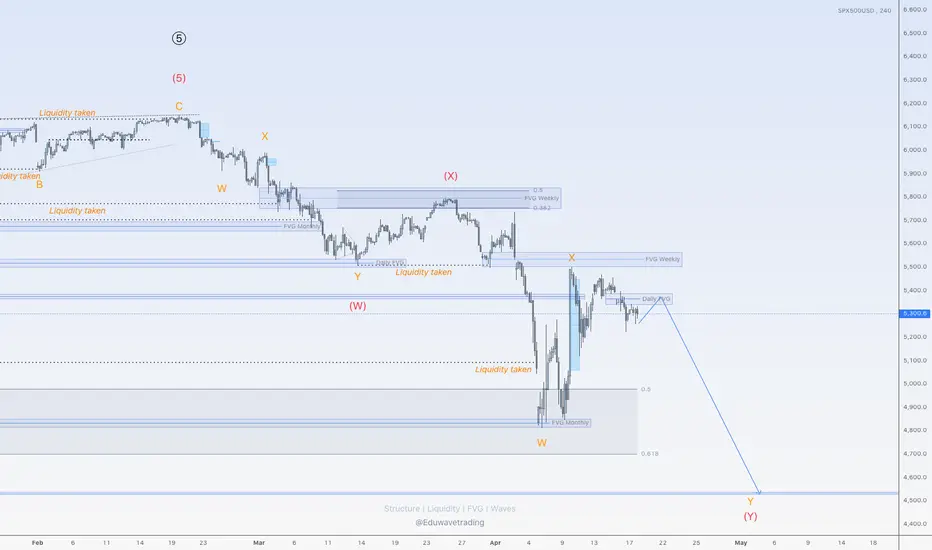
More down for SPX500USDHi traders,
SPX500USD consolidated the whole week last week.
So next week we could see the start of the last impulse wave down to finish the bigger (red) WXY correction.
Let's see what the market does and react.
Trade idea: Wait for a small correction up on a lower timeframe to trade shorts.
If you want to learn more about trading FVG's & liquidity sweeps with Wave analysis, then please make sure to follow me.
This shared post is only my point of view on what could be the next move in this pair based on my technical analysis.
Don't be emotional, just trade your plan!
Eduwave
More upside for EUHi traders,
Last week EU finished the correction (orange) wave 4 and after that it went up again for wave 5 (orange).
As you see price made a three wave impulse so wave 5 could be an ending diagonal or wave 4 becomes a Triangle.
In both cases we could see some more upside next week.
Let's see what the market does and react.
Trade idea: Wait for a change in orderflow to bullish, an impulse wave up and a correction down on a lower timeframe to trade longs.
If you want to learn more about trading with FVG's, liquidity sweeps and Wave analysis, then make sure to follow me.
This shared post is only my point of view on what could be the next move in this pair based on my technical analysis.
Don't be emotional, just trade your plan!
Eduwave

NIFTY50.....Correction ahead?Hello Traders,
the NIFTY50 has achieved my target range @ 23872 and touched the wave x² range of a possible triple pattern. This was inline to my analysis!
It will be interesting to observe how market will react in the coming one or two days ahead!
Chart analysis!
As to seen, there is a trend line drawn, and it has been touched three times, what makes this one really important! On the way up, there are some gaps to the upside, and sooner or later, they will be closed.
A first target for this scenario could be a range of about 22867 area.
The bulls have to watch the impulsive structure, that has been formed at the last days, 'cause it's possible to count an impulsive move up (1-2-3-4-5)! The next move, when it is done, is a correction within a wave 2, that more often than not retrace a 0.618 Fibo of wave 1 of any degree. New lows, while not expected, are just below @22194 a real scenario!
When the bulls are willing to extend the gains, one target range is around the wave x of the triple @ 24857 a realistic idea!
Well, friends, that's it for a quick note.
Happy Easter and a great week for all of you.....
Ruebennase
Please ask or comment as appropriate.
Trade on this analysis at your own risk.
