Elliot Wave B then C on 4hrTo confirm a low is in and Wave B’s final leg is starting:
✅ 15M CHoCH – Price must break previous lower high (LL > HL shift).
✅ Bullish volume surge on breakout.
✅ Higher low retest (entry zone).
✅ RSI breaks above 50.
This would line up with a reversal inside your 4H Demand/Reaction Block, adding confluence from both timeframes.
Elliott Wave

Reliance Reliance Cmp 1394
this is daily chart of reliance...
looking at the chart,
this are my wave counts on reliance....
we are in wave c of wave B....
I am expecting reversal from current levels or from the marked levels...
we can soon see wave C moving down and retesting new low as 1st tgts ....
Just a View!!!
Vedang ! :)
Discliamer: Chart is for study purpose only!!!

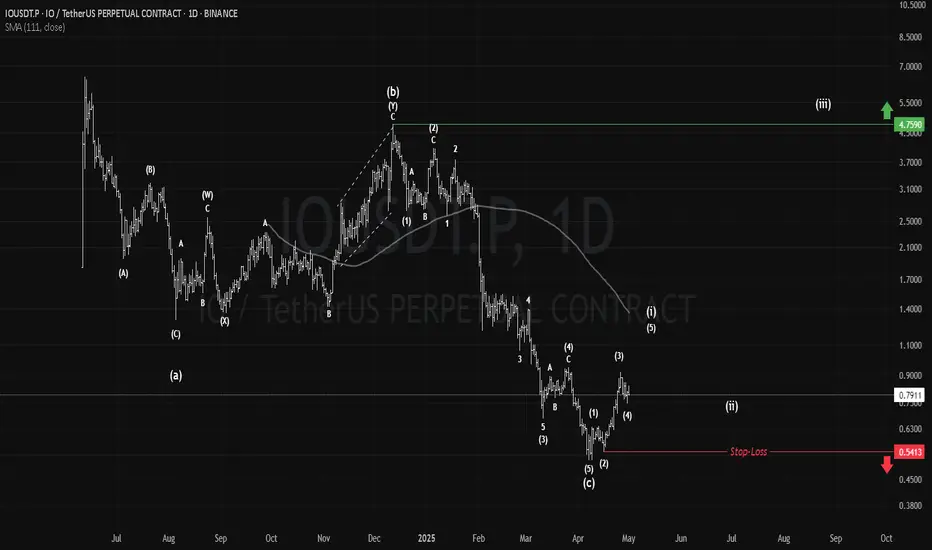
IO: The AI Comeback?#IO is a new AI token that was launched back in Jun 2024. Recently bounced from the ATL with a bullish PA so far, it shows an optimistic view for this token and for the AI sector in general.
As long as it holds above $0.54 (the stop-loss), a major motive wave shall start to target the ATH.
#IOnet
Gold Short: Update to wave counts and H&SThis is an update to the Gold short idea that I posted yesterday. I showed how we can draw another head-and-shoulders and demonstrated how to use Fibonacci extensions set take profit targets.

SPX as an exampleCorrect me if I'm wrong, but this has got to be one of the craziest monthly candlesticks the stock markets have ever printed, and perfectly completes a potential wave 4 in a 5 wave count.

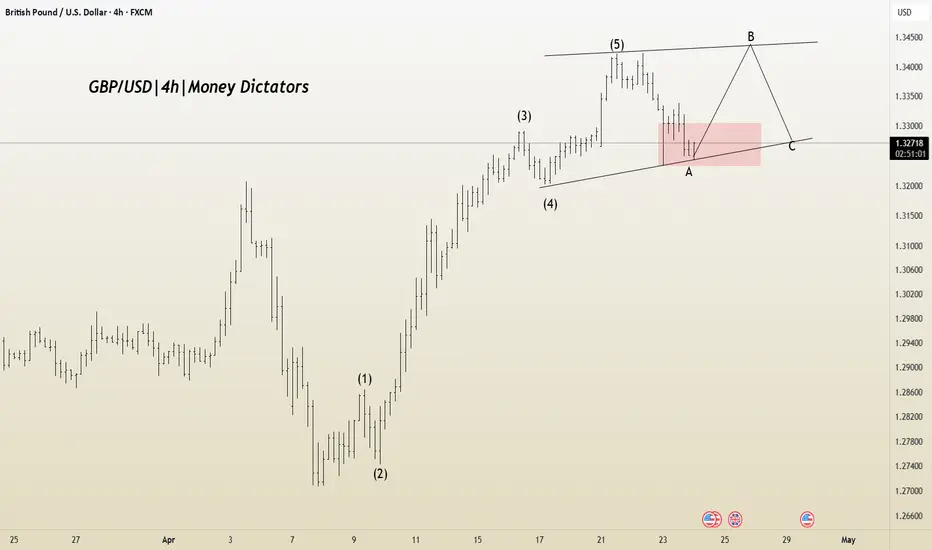
GBP/USD at a Turning Point – Correction Pattern in PlayIt appears that corrective Wave A in the GBP/USD pair is nearing completion, and Wave B may be forming. The Wave 1 to 5 structure seems to have been completed, indicating the beginning of an A-B-C corrective phase.
If the correction unfolds as expected, potential upside targets are 1.32918 and 1.33555. However, if the market faces rejection below the trendline, the stop-loss level would be 1.32021.
GOLD → Consolidation. Traders are waiting for news...FX:XAUUSD remains in consolidation at 3370-3270. Traders are in no hurry to take any action, as there is a lot of important news ahead. Let's take a closer look at the situation...
On Wednesday, gold is trading lower, remaining in a sideways range as traders await the release of US GDP data for the first quarter. A sharp slowdown in growth is expected, and a possible contraction in the economy could increase bets on a Fed rate cut and support gold. Meanwhile, the dollar is holding steady amid tariff news and expectations for key employment and inflation data.
A retest of the range support is forming. The approach is quite sharp, and the pre-breakout potential has been exhausted. A false breakout of support could trigger an upward correction.
Support levels: 3270, 3245
Resistance levels: 3314, 3329, 3352
If the dollar continues to fall after the news, this could support gold and the price could continue to trade between 3370 and 3270. Unpredictable news could trigger a breakout and a fall.
Best regards, R. Linda!

The Views on STX#STX had a strong rise from Nov2022 to Mar2024, but both that rise and the current decline from that top appear corrective.
This unclear structure leaves multiple possibilities in play, 3 ideas are outlined below.
Maintaining $0.566 keeps the bullish ideas active.
#Stacks

Gold is in a descending triangleGold is in a descending triangle. This descending triangle is wave B of an ABC correction. The descending wave C will begin soon.

Map Of FillIt has been moving sideways for more than two years and a head and shoulders pattern has been formed on a large monthly fact first glance at the chart, we find that it has been moving sideways for more than two years, forming a head and shoulders pattern, which indicates a further decline. On the other hand, a sideways wave has been formed, which is an X wave, and we are preparing for a large bearish W wave to come.rame, so it is expected to fall again strongly to one of the two areas specified below.
Note: There is a previous analysis of this currency on my page and all its legacies were explained before.
*In principle, I am not a supporter of any direction, but I am only giving my point of view, which may be right or wrong. If the analysis helps you, then this is for you. If you do not like this analysis, there is no problem. Just ignore it. My goal is to spread the benefit. I am not one of the founders of the currency.

solusdtThe breakout area has been successfully tested and we will see the next step, the drop to the shaded area.
*In principle, I am not a supporter of any direction, but I am only giving my point of view, which may be right or wrong. If the analysis helps you, then this is for you. If you do not like this analysis, there is no problem. Just ignore it. My goal is to spread the benefit. I am not one of the founders of the currency.

Coming down!I see three corrective waves in front of me that have been completed and concluded with an ending diagonal pattern. Please be careful of the possible upcoming decline.
*In principle, I am not a supporter of any direction, but I am only giving my point of view, which may be right or wrong. If the analysis helps you, then this is for you. If you do not like this analysis, there is no problem. Just ignore it. My goal is to spread the benefit. I am not one of the founders of the currency.
EUR/USD : 5-Wave Uptrend with Key Support at 1.1200 On the daily timeframe, EUR/USD is moving in a 5-wave bullish structure 📊.
The critical support is at 1.1200 🛡️ — as long as price stays above, the path is open toward 1.1717 and 1.2024 🎯.
However, a break below 1.1200 could signal a shift in sentiment ⚠️.
Watch this level closely — it’s a key zone for trend continuation!

Wave C Analysis After Triangle PatternCMCMARKETS:EURUSD The beginning of wave C from B after the completion of the triangle pattern.

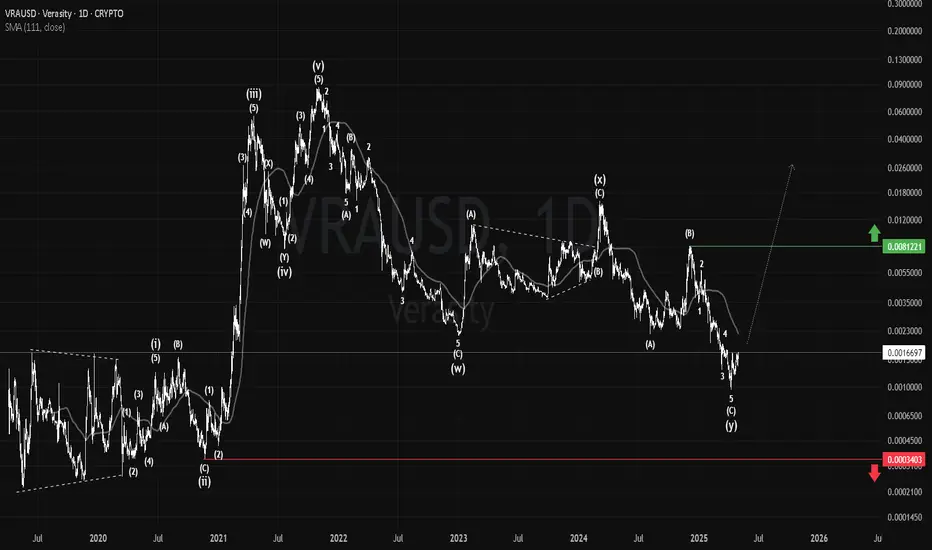
VRA: Completed Deep Correction#VRA has a long history of disappointing it's investors, but that may change soon.
It looks like it completed a major correction that began in Oct 2021.
Holding above $0.0012 keeps this outlook valid, while passing $0.0082 confirms targeting $0.0250 firstly.
#Verasity
XAGUSD Buy trade. Multiply your account 50 times with a perfect text book elliot wave correction setup. we are in the up trend and we will buy the ABC correction at current levels.

Gold Short: Walkthrough of Wave Counts and H&SThis is the video walkthrough of the Elliott Wave Analysis of Gold that I posted 8 hours earlier. I made an update to the head-and-shoulders in this video and discusses the change in neckline. I also discuss about why I chose to label the waves as they are and how they might have been labelled otherwise. In the end, this is still a short call but with the H&S tilt shifted down.
I realised that I missed out on how to do the profit target, but please refer to the linked static idea for the profit target and stop loss. Thank you!

Gold Short: H&S and Wave 3 downOver here, I've labelled all the waves breakdown as well as drawing a tilted head-and-shoulders. I believe that we are going into a wave 3 (minute degree) that is supported by the formation of the right shoulder.
I expect the neckline to be broken which will then goes down to the first resistance provided by the lower blue trendline.
The next resistance in green will be our first TP target. This is where we can choose to reduce the position, or to adjust the stop loss down in order to ride the position. As the lower target cannot be seen without squeezing the chart and causing the waves breakdowns to be unclear, I will update again when that happens.
The stop loss is above the right shoulder.
Good luck!

APTOS MarketCap#Apt presents a strong motive diagonal on its all-time market cap chart, quite different from the price chart due to ongoing token unlocks.
It’s still in an ongoing correction since Dec 2024, with more downside likely before the major structure completes.

APT: The Solid Range#Aptos is a solid project that has traded within the same range ($3–$20) since its late 2022 launch.
Currently, #APT is in the demand zone of this long-term range.
A strong rebound is likely from current levels as long as $3 holds as the stop-loss.

Ripple Potential UpsidesHey Traders, in today's trading session we are monitoring XRPUSDT for a buying opportunity around 2.16 zone, Ripple is trading in an uptrend and currently is in a correction phase in which it is approaching the trend at 2.16 support and resistance area.
Trade safe, Joe.

GOLD → Consolidation ahead of news. What to expect?FX:XAUUSD is consolidating. Focus on 3370 - 3269. Economic data is expected tomorrow, and gold is likely to trade within the consolidation range for several days.
Optimism about US trade talks with key partners boosted risk appetite and supported the dollar. The US Treasury Secretary reported progress with India, while President Trump softened his rhetoric on China, which also strengthened the dollar. At the same time, traders took a wait-and-see stance ahead of the release of US GDP data for the first quarter. If the figures turn out to be weak, gold could rise sharply as a safe-haven asset. Thus, the gold market remains sensitive to trade news and macro data, especially against the backdrop of rebalancing at the end of April.
At the moment, as part of the current momentum and correction, I expect prices to recover from the 0.5 - 0.7 Fibonacci zone. Gold may test 3323-3325 before resuming its correction within the consolidation.
Resistance levels: 3323, 3352, 3370
Support levels: 3290, 3270
Traders are waiting for a resolution in the tariff dispute as well as economic data due tomorrow. However, while the price is consolidating, I expect a rebound from support. BUT! If the price continues to squeeze towards any boundary, with priority to support, then the chances of a breakout from the consolidation base may increase.
Best regards, R. Linda!

NZDCHF → The global bearish trend may continueFX:NZDCHF has been within a local upward wedge pattern for a long time. A breakout of support could trigger a continuation of the downtrend.
After breaking through the wedge support, the currency pair is one step away from the start of the realization. The focus is on consolidation at 0.4982 - 0.4919. A breakout of support could trigger a decline in the currency pair amid a weakening NZD and a rising dollar index, which overall creates a negative backdrop for the pair.
A retest of the previously broken boundary of the figure or resistance at 0.4953 is possible before the decline continues, but a consolidation of the price below 0.4918 will be a good signal for the start of the movement.
Resistance levels: 0.4953, 0.4981
Support levels: 0.4918, 0.4872
Trend pressure plays an important role, as does the fact that the price is coming out of a wedge consolidation. The breakout is directed towards the main trend, and price consolidation below the key support will only confirm this.
Best regards, R. Linda!
