Hellena | EUR/USD (4H): LONG to the resistance area 1.11613.Colleagues, the price is in the correction of wave “2”. I believe that the upward five-wave impulse is not yet complete. In any case, I think that the price will still reach the maximum of wave “1” at 1.11613.
The question is how far will the correction of wave “2” go or is it over? There is no way to know for sure, so I don't recommend selling. I think we should stick to long positions.
Manage your capital correctly and competently! Only enter trades based on reliable patterns!
Elliotwaveanalysis

Comprehensive Research - McDonald’s Stock Set to SoarQuick read:
McDonald's stock is poised for a bullish move, with Wave 3 likely starting and strong support near 290.50–295.00. Traders should long on dips within this range, for next resistance levels, 326.00 and 348.00 with a invalidation below 276.00. This setup offers a solid risk-to-reward in a long-term uptrend. Alternative safe entry is possible after the break of corrective channel breakout of wave (2).
Elliott Wave Forecast:
TF - Daily
The chart suggests that McDonald’s stock is in the middle of a larger upward move known as Wave C, which comes after completing a complex correction. Wave C is expected to unfold in five smaller waves, a pattern that usually points to a strong uptrend. It appears the correction is behind us, and a fresh bullish phase is underway.
Starting from the low at 276.53 , marked as Wave B, the price climbed to 326.32 , forming Wave one. After that, the stock pulled back to 290.50 , forming Wave two. This pullback followed a typical ABC pattern within a corrective channel, which often signals the end of a downturn and the beginning of an upward move.
Now, Wave three seems to be starting, and this is usually the strongest part of Wave C. The price is expected to move above 335 , take a small pause for Wave four, and then rise again to complete Wave five somewhere around 345 to 350 dollars. This positive outlook remains intact as long as the price stays above 290.50 . With the breakout from the corrective channel, the setup looks strong and clear for buyers.
Fibonacci levels:
Fibonacci Extension Targets:
1.000 extension: 326
1.618 extension: 348
Correction Retracement Levels:
Wave 2 retracement: 78.6%
A = C in A-B-C correction: 289.21
Price Action & shifting of value:
TF: Weekly
McDonald’s stock has been steadily climbing inside a rising channel since late 2020, showing a clear long term uptrend. The price has respected both the top and bottom edges of this channel very well, and interestingly, the middle line has acted like a pivot, providing support or resistance multiple times over the years.
Recently, the stock made a higher low at 276.53 and bounced back strongly, keeping the bullish structure intact. It then pulled back to 290.50 , right around the middle line of the channel, and held above an upward sloping trendline. This kind of price action shows strength and suggests buyers are stepping in.
The sharp move from 276.53 up to current levels looks like a strong bullish leg, possibly driven by accumulation. If the stock can break above its recent high of 326.32 , it could head toward the upper end of the channel. As long as the price stays above 290.50 and especially above 276.53 dollars, the bulls remain in control. Even if the price dips a bit, the long term trend stays positive unless the lower boundary of the channel breaks down.
I will update more Information here.

USDT.D(based on NEowave)check the long term of usdt dominance then you will understand this.
according to bow tie diametric(from 12H counting) we will see a new bull run and this is the last wave of that.

Elliott Wave Update – Clean Count DevelopmentBINANCE:SOLUSDT
We are currently tracking a developing (B) wave as part of a larger corrective structure.
The move up from the local low unfolds as a classic 5-wave impulse (yellow), where wave 3 is completed, wave 4 is forming as an A-B-C flat correction, and wave 5 is still expected to follow, completing wave (C) of (A).
After that, we anticipate a drop into wave (B) of the corrective sequence before a potential final push into the green target zone to complete wave (C) of (B).
Once this entire correction is done, the expectation remains for a larger 5-wave decline to complete the macro structure.
Wave count stays valid as long as internal rules of Elliott Wave Theory are respected.

EUR/NZD Wave Structure Shift: 4th Wave Correction in ProgressThe 3rd wave in EUR/NZD appears to have been completed, and the market seems to be entering the 4th wave. There is a possibility that the 4th wave could take support near the Fibonacci 0.5 level (1.19164). After that, the 5th wave of the impulse phase may move upward.
If the market falls below 1.98303, it would confirm the beginning of the 4th wave. In that scenario, the first target could be around 1.95907 .

Elliott Wave Analysis – Focus on Wave StructureBINANCE:SOLUSDT
The current setup shows a completed green (A) wave, followed by a corrective (B) wave unfolding as an A-B-C structure.
Within wave (C) of (B), we can clearly identify a 5-wave impulse:
Wave 1 is complete
Wave 2 formed as a correction
Wave 3 extended strongly
Wave 4 is currently developing
Wave 5 is expected to complete wave (C) of (B)
Once this move finalizes, a larger downward (C) wave is anticipated to complete the overall corrective pattern.
This setup remains valid as long as the internal structure respects the rules of Elliott Wave Theory.

Hellena | SPX500 (4H): LONG to resistance area of 5445.2.Explaining what is happening in terms of wave theory is quite difficult, but always possible. Of course, geopolitics has been affecting the price a lot lately, but even in this chaos there are regularities.
Let's take a look at the wave markup. I believe that there is a big correction going on at the moment. Most likely it is not finished yet and has just started to form wave “B”, which means that wave “C” is coming, but I still want to see an upward movement to the resistance area at 5445.2. The price has been in a downtrend for too long and I think a correction is very likely. Well, let's see.
Manage your capital correctly and competently! Only enter trades based on reliable patterns!

Russell 2000 - 5th wave of Y leg may already be in progress... The rejection at 2100 price level also happens to be the 38.2% Fib of the decline from the 14th of February 2025. The decline from 6th of February 2025 counts beautifully as waves 1, 2, 3 & 4. If this wave count is correct, then the Russell is currently in wave 1 of 5 of Y of (ii).
This is my primary wave count as long as the 2100 resistance is not breached.
This changes my initial wave count from a complex WXYXZ to a simple WXY.
Click on the link to see the previous wave count which is still valid and is now an alternate wave count if the 2100 resistance is breached:
Only updating the wave count. My bias and direction remain the same.
Wave Y is possibly in progress. Looks like we are going to have a bearish April & possibly May as well. Selling corrective rally is still the way to trade for now. Take profit at 1905/1900, which is where technically, the Russell 2000 will possibly turn up for wave (iii).
Stop Loss can be placed above wave 4, well out of the way in case of any wild swing on this PCE Friday.

Dogecoin Daily Chart Analysis: A Fresh Start Ahead ?Hello friends, let's analyze Dogecoin, a cryptocurrency, from an Elliott Wave perspective. This study uses Elliott Wave theory and structures, involving multiple possibilities. The analysis focuses on one potential scenario and is for educational purposes only, not trading advice.
We're observing the daily chart, and it appears we're nearing the end of Wave II, a correction. The red cycle degree Wave I ended around 2024 December's peak. Currently, we're nearing the end of red Wave II, which consists of black ((W)), ((X)), and ((Y)) waves. Black ((W)) and ((X)) are complete, and black ((Y)) is nearing its end.
Within black ((Y)), we have Intermediate degree blue (W), (X), and (Y) waves. Blue (W) and (X) are complete, and blue (Y) is nearing its end. Inside blue (Y), red A and B are complete, and red C is nearing its end. Once red C completes, blue (Y) will end, Once blue (Y) completes, means black ((W)) will end that means higher degree cycle wave II in red will end.
If our view remains correct, the invalidation level for this Elliott Wave count is 0.04913. If this level holds and doesn't touch below it, we can expect a significant reversal to unfold wave III towards new highs. This is an educational analysis, and I hope you've learned something by observing the chart and its texture.
I am not Sebi registered analyst.
My studies are for educational purpose only.
Please Consult your financial advisor before trading or investing.
I am not responsible for any kinds of your profits and your losses.
Most investors treat trading as a hobby because they have a full-time job doing something else.
However, If you treat trading like a business, it will pay you like a business.
If you treat like a hobby, hobbies don't pay, they cost you...!
Hope this post is helpful to community
Thanks
RK💕
Disclaimer and Risk Warning.
The analysis and discussion provided on in.tradingview.com is intended for educational purposes only and should not be relied upon for trading decisions. RK_Charts is not an investment adviser and the information provided here should not be taken as professional investment advice. Before buying or selling any investments, securities, or precious metals, it is recommended that you conduct your own due diligence. RK_Charts does not share in your profits and will not take responsibility for any losses you may incur. So Please Consult your financial advisor before trading or investing.

USDT.D(based on NEo wave) short termIm waiting for wave f and g but not sure about f
we should wait for it to show the pattern and breaking down 5.4 will confirm the bullish market.

BTC.D( based on NEo wave)Bitcoin dominance is too messy for counting but I just count 2 time frames and I find out there is a little bearish wave on the way but breaking 62% confirms this.
if it happens good bullish wave can make eth over 4K

S&P 500: Historic Crash or Just Another Chance?Let’s be real: What’s happening with the S&P 500 right now is rare. This is only the fourth time in history that the index has dropped more than 10% in two days (technically three, including today’s Monday session). The other times? October 1987, November 2008 during the financial crisis, and March 2020 during the pandemic crash.
And now? We’re seeing a similar drop, this time triggered by a global tariff war , stoked by the U.S. and other governments playing chicken to see who folds first.
Yeah, it sucks. It hurts. But it could also be a hell of an opportunity.
We just tagged the 4,800 level —a place many didn’t expect to see this quickly. Neither did I. But here we are. The untapped VWAP got hit, and this might very well be the start of Wave A. Could we go lower? Absolutely. There’s a monthly Fair Value Gap around $4,500, and a drop to $4,250 isn’t out of the question either.
But here’s the thing: it depends entirely on your perspective.
If you’re trading on the 30-minute chart, this is a full-blown crisis. But zoom out to the daily, weekly, or monthly chart—and it’s just market noise.
Pull up the log chart from 1953 to 2025 in the top left corner. We’ve seen this before. A handful of times. And on that scale? Nobody cares.
If you’re in the game to build long-term wealth, this moment is just another temporary shakeout. If you’re doing dollar-cost averaging, this is exactly where you want to be adding—not panicking.
The market doesn’t care about your plan. It forces you to adapt. You can’t fight it, only flow with it.
And if you’re in it for the long haul? This is just noise. Ignore it, zoom out – and stay the course.

NAKAUSDTAn analysis at the height of market fear..
A situation where all markets are experiencing sharp declines due to US tariffs and Middle East tensions..
It seems that around $0.25 is the ideal area for short-term buying for $0.75 targets and the ideal time to start this upward movement is early April..
Just an analysis that may be wrong..

Elliott Wave Analysis on $SOLUSDT – ElliotWave count🟢 Current Wave Structure
The chart shows a complex corrective structure that fits well within the Elliott Wave principle:
We are currently in a larger ABC correction, with the green-labeled wave (C) likely approaching completion.
The most recent move down in green (C) may have marked the end of a broader corrective cycle.
The current movement looks like a short-term ABC correction in red – typical for a corrective bounce after a strong sell-off.
🟥 Short-Term Movement (Red Wave A-B-C)
Within the lower timeframe, we can see a corrective recovery forming a red A-B-C structure:
Wave A (red) has already completed,
Wave B (red) is currently forming (sideways or slightly lower),
Wave C (red) could result in a final push upwards towards the green descending trendline – targeting around 138–142 USDT – unfolding as an internal orange A-B-C.
🟩 Key Trendline (Green)
The green descending trendline has been respected multiple times and acts as strong technical resistance.
⚠️ Scenario: A rejection from this level is highly likely and would mark the end of the current relief rally – completing the larger green wave (B).
🟧 Short Entry Zone
The orange Fibonacci zone around 142 USDT marks an ideal short setup area.
This level is confluence of Fibonacci extensions and previous resistance.
⚪ What’s Next?
After the orange wave C finishes (completing green wave (B)), I expect an impulsive move to the downside – likely unfolding as a classic 1-2-3-4-5 wave within the green wave (C).
Target zones:
First zone: ~108 USDT (highlighted by green/yellow/red Fibonacci extension),
Final bear target: Possible deep wick below due to the high volatility and liquidity in that zone.
✅ Key Support Zone (Green / Yellow / Red)
Around 108 USDT, we find a strong confluence support – labeled as End of Bears.
This zone may act as a potential reversal point, possibly kicking off a new bullish cycle with long-term targets reaching 200+ USDT.

Crude Oil: A Major Breakdown in the Making?Last Friday, April 4th, 2025, crude oil decisively broke below a key long-term support level that had held strong since late November 2021.
This significant downside breakout, if confirmed, could mark a major shift in the oil market structure — potentially opening the door for a deeper decline.
Based on Elliott Wave analysis, it appears that wave B has been completed in the form of a contracting triangle, and we are now likely entering wave C. According to Fibonacci projections, wave C could extend down toward the $41–$44 range, which represents roughly a 28% drop from current levels.
From a chart pattern perspective, price action has also broken down from a descending triangle — a classic bearish pattern — with a projected target that aligns closely with the Elliott Wave count around $44.
Moreover, this entire bearish move, which began in early June 2022, fits neatly within a descending channel — further validating the confluence of technical signals.
Breaking below such a well-established support zone alone could be a strong bearish signal. But when this is backed by Elliott Wave structure, pattern projection, and broader macroeconomic concerns, it suggests a high-probability short opportunity in crude oil.

Gold(based on NEo wave)on this branch of gold it is making a symmetrical and wave g is ending>
I think a good corrective wave is on the way!

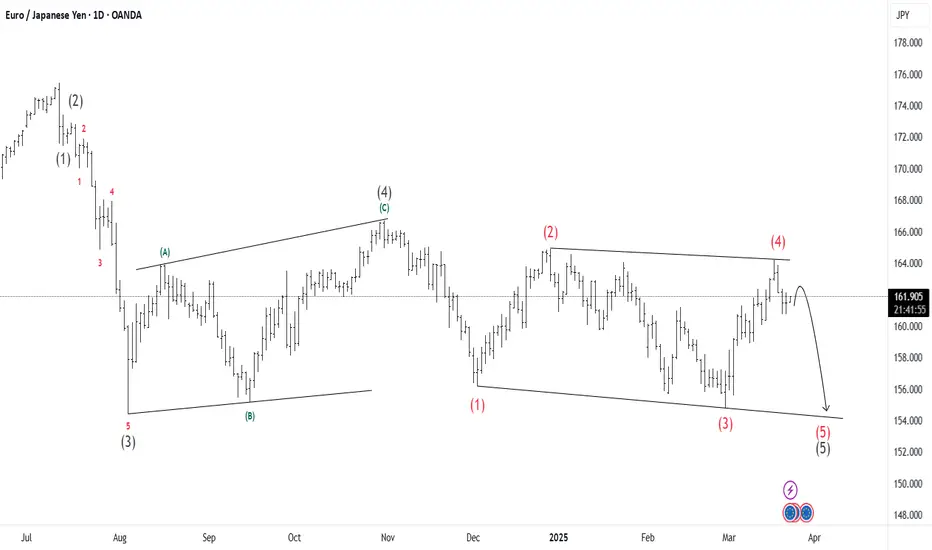
EUR/JPY – Bearish Setup with Elliott Wave AnalysisThis EUR/JPY daily chart shows an Elliott Wave analysis, suggesting a possible bearish continuation. The current wave structure indicates the pair is moving through the final phase of a five-wave impulsive sequence.
The market has completed three waves of a larger impulsive cycle, with Wave (4)
The price movement between Wave (2) and Wave (4) shows a pause or slowdown after going up. This means the buyers are losing strength, and the price may soon start to fall
If the price gets rejected near 162.900 , it could confirm further downside.
If it breaks below the 159.674 level, it may speed up the decline, with a possible target around 155.526 level.
“Weak Demand Signals Potential for a Lower Low”Currently, the position of NCF1! or Newcastle Coal is within wave 5 of wave (C) of wave , indicating that Newcastle Coal remains vulnerable to further corrections toward the 86.55–96.15 range, as represented by the black labels.
A similar pattern is observed in the red labels, where Newcastle Coal is also nearing the completion of wave (5) of wave .
We observe continued pressure on coal demand due to weak consumption and oversupply, as many countries are increasingly investing in renewable energy sources amid slower global economic growth.

Hellena | Oil (4H): SHORT to support area 65.268.We need to talk about one important nuance. Many people ask “Hellena, you say you can't buy oil, but it's going up. Well, it is, yes. But all my data and wave markings suggest that the price will soon start a downward movement. There are major changes in geopolitics and I am not in a position to stop them. I just set a stoploss and wait for the trade that will bring me profit.
Now coming to the forecast, I think that the downward movement will start soon, but before it, the price may rise quite high, maybe even to the area of 74.000.
But the main direction is the support area of 65.268.
There are 2 possible ways to enter the trade:
1) Entry at market price.
2) Limit pending sell orders if the price starts an upward movement to the area of 74.484.
Manage your capital correctly and competently! Only enter trades based on reliable patterns!

XAU/USD: 5th Wave Rally After CorrectionOn the 1-hour timeframe, XAU/USD has formed an Elliott Wave corrective structure. This is an expanded flat correction, typically seen in the 4th wave. The correction seems to have been completed at 3,054, suggesting that the 5th wave may be in progress.
For bullish traders, a potential long position can be considered around the 0.236 retracement level as a pullback entry point.
The 5th wave has the potential to reach the following upside targets: 3,110, 3,145, 3,165
However, this bullish outlook remains valid only if the low of Wave IV holds. A breakdown below this level would invalidate the bullish scenario.

BTC - Elliott Wave Impulse and Corrective StructureThis chart illustrates an Elliott Wave pattern on BTCUSDT in the 4-hour timeframe. The market initially completed a 5-wave impulse move to the upside, labeled as (1)-(2)-(3)-(4)-(5), signaling a strong bullish trend. Following the completion of Wave (5), a corrective ABC structure has begun, indicating a potential retracement phase.
- The 5-wave impulse structure suggests a completed bullish cycle.
- Wave (A) marks the initial corrective decline, followed by a recovery in Wave (B).
- Wave (C) is in progress, likely targeting lower levels before a potential reversal or continuation of the trend.
Traders should watch key support and resistance levels to identify potential reversal zones or continuation patterns. If BTC finds strong support at a key level, it could indicate a buying opportunity for the next bullish wave. Conversely, a deeper breakdown could confirm extended correction.
Always apply proper risk management and confirm setups with additional technical indicators.

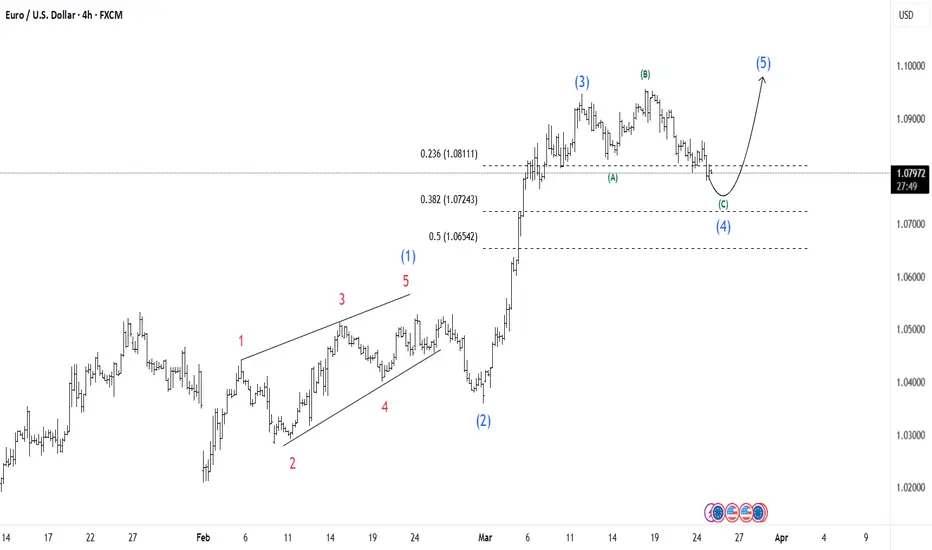
Elliott Wave Forecast: EUR/USD Prepares for Next Bullish Leg!This EUR/USD 4H chart presents an Elliott Wave analysis, showing the market’s movement within a five-wave structure. The price has completed Wave 3 and is currently in a corrective Wave 4, finding support around Fibonacci retracement levels of 38.2%
• Wave 3: A sharp rally forming an extended third wave.
• Wave 4: An ABC correction is currently in progress and is expected to be completed around levels of 1.07456
If the market respects the proper Fibonacci levels, the target for wave 5 could be 1.09504 .
GBP/USD Technical Outlook: Elliott Wave Mapping the Next MoveThis GBP/USD 4H chart presents an Elliott Wave analysis.
Wave (1) and (2): The market had an impulsive bullish movement in Wave 1, followed by a corrective Wave 2.
Wave (3): A strong bullish move with momentum.
Wave (4): A corrective phase, forming a triangle pattern (a-b-c-d-e), which suggests the market is preparing for another impulsive leg.
Entry Confirmation: A breakout above the triangle pattern.
First Target: 1.31457 (Fibonacci 0.382)
Second Target: 1.32105 (Fibonacci 0.5)
